August 2022 Climate Summaries
Mobile Alabama and Pensacola Florida Area
National Weather Service Mobile Alabama
September 1, 2022
August 2022 in Review - A wet pattern across the Gulf coast contributed to daily highs coming in a couple degrees below normal on average while warm, muggy nights resulted in lows being nearly one degree above normal. When considering the highs/lows, temperature averages evened out to near normal. There were a couple notable warm spells in the Mobile area, the first being the period between the 14th and the 17th when highs averaged 3.5° above normal. The second short period closed out the month on the 29th through the 31st where highs averaged 3° above normal. Between the two, a longer duration wet pattern flipped the highs between the 22nd and 26th to well short of normal by 7.0° on average. In fact, during this period, Mobile saw a new record low high temperature hitting the record books. A similar temperature trace was noted in the highs for the Pensacola area. No record temperatures were reached at Pensacola though.
Monthly total precipitation was more notable at both Mobile and Pensacola where the rain gauge caught more than 11". On one day alone, 39% of the monthly total rain fell at Pensacola and also set a new one day record rainfall.
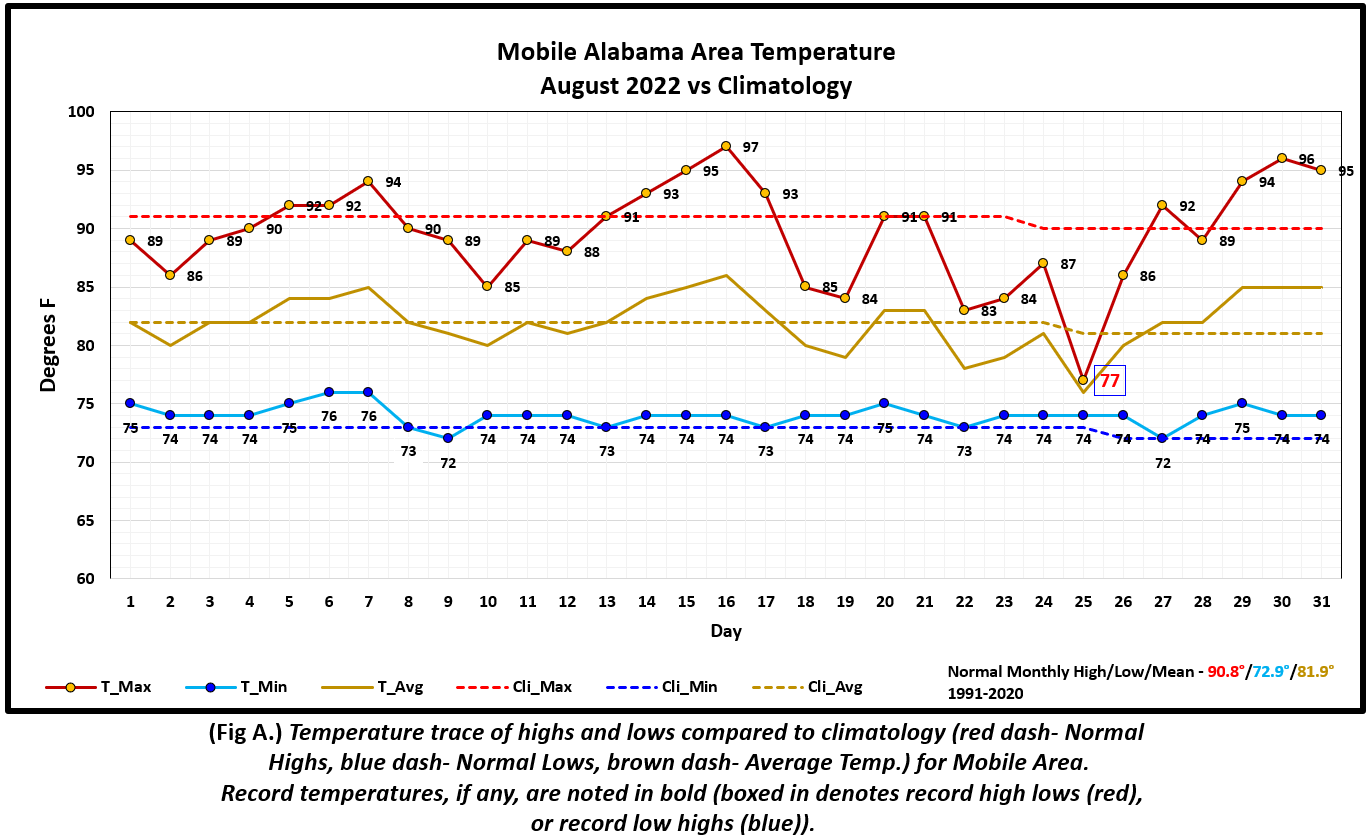
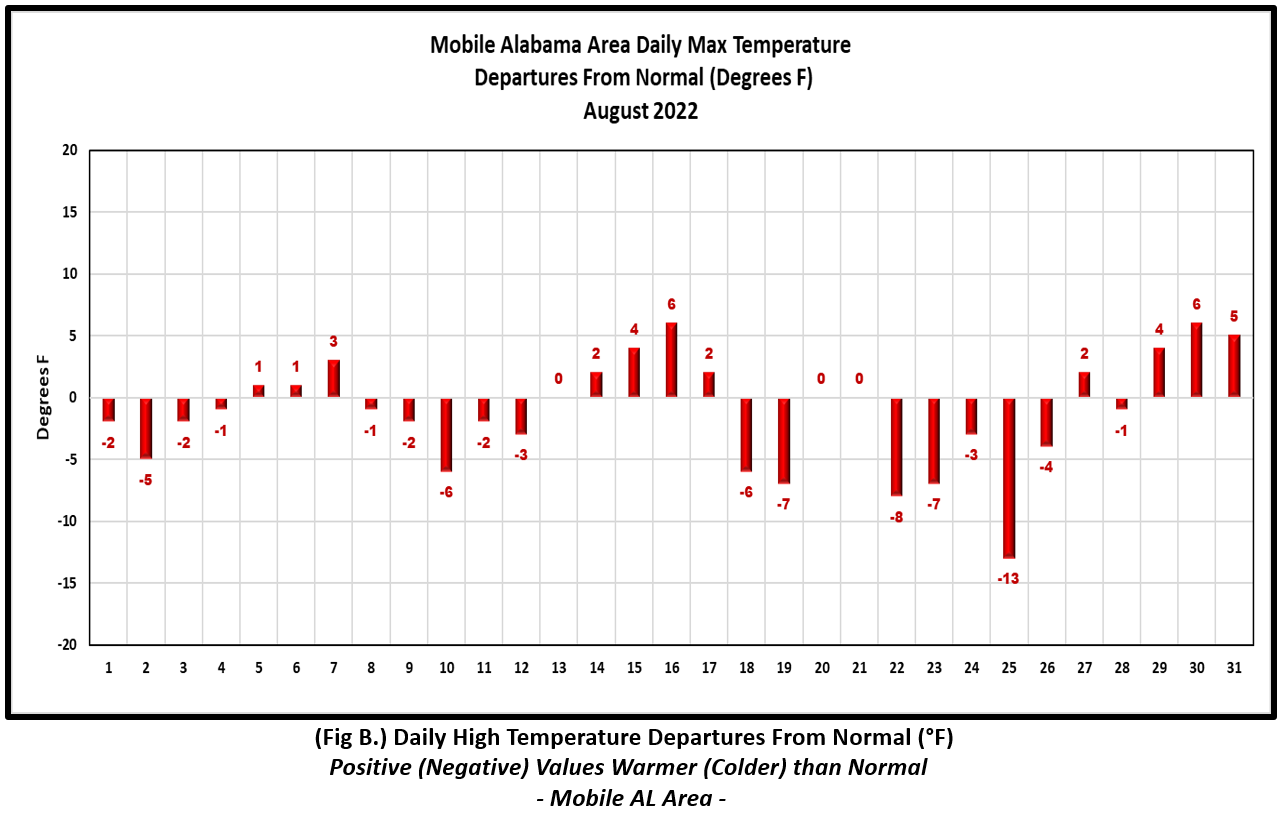
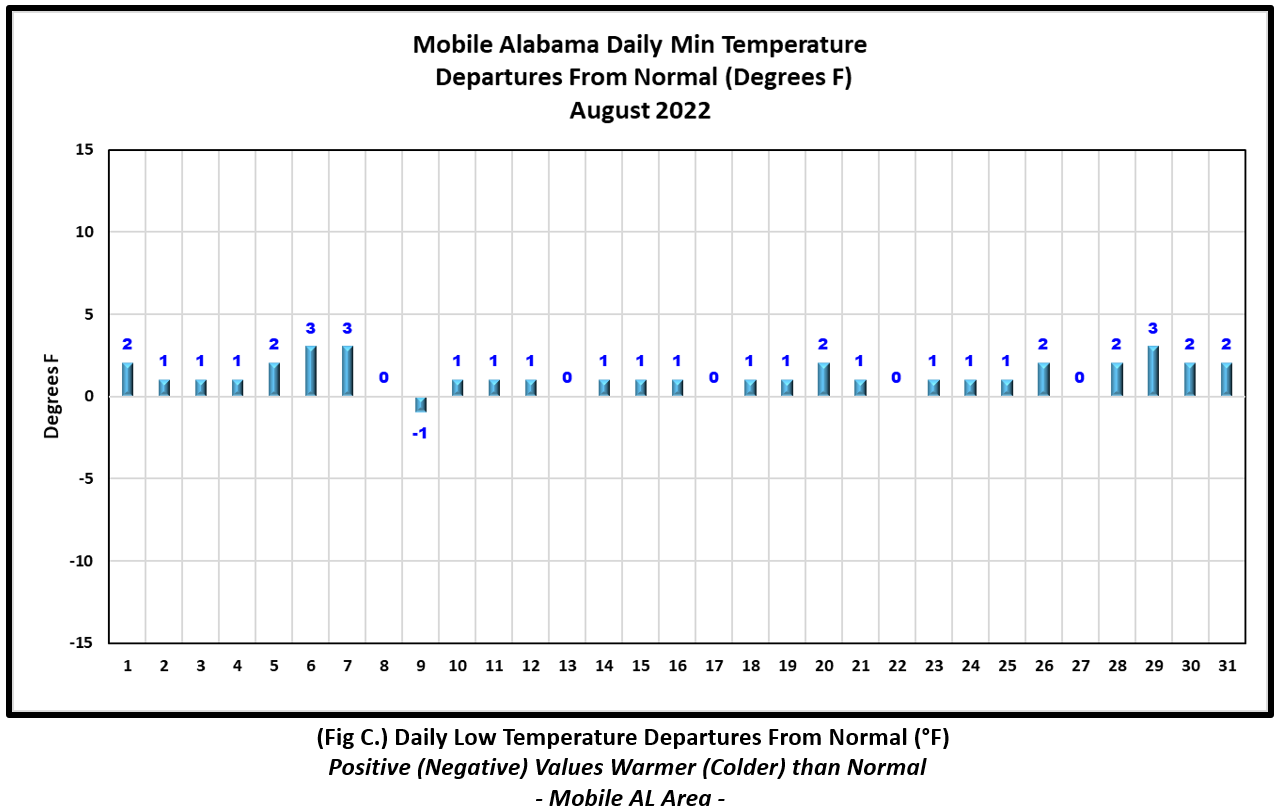
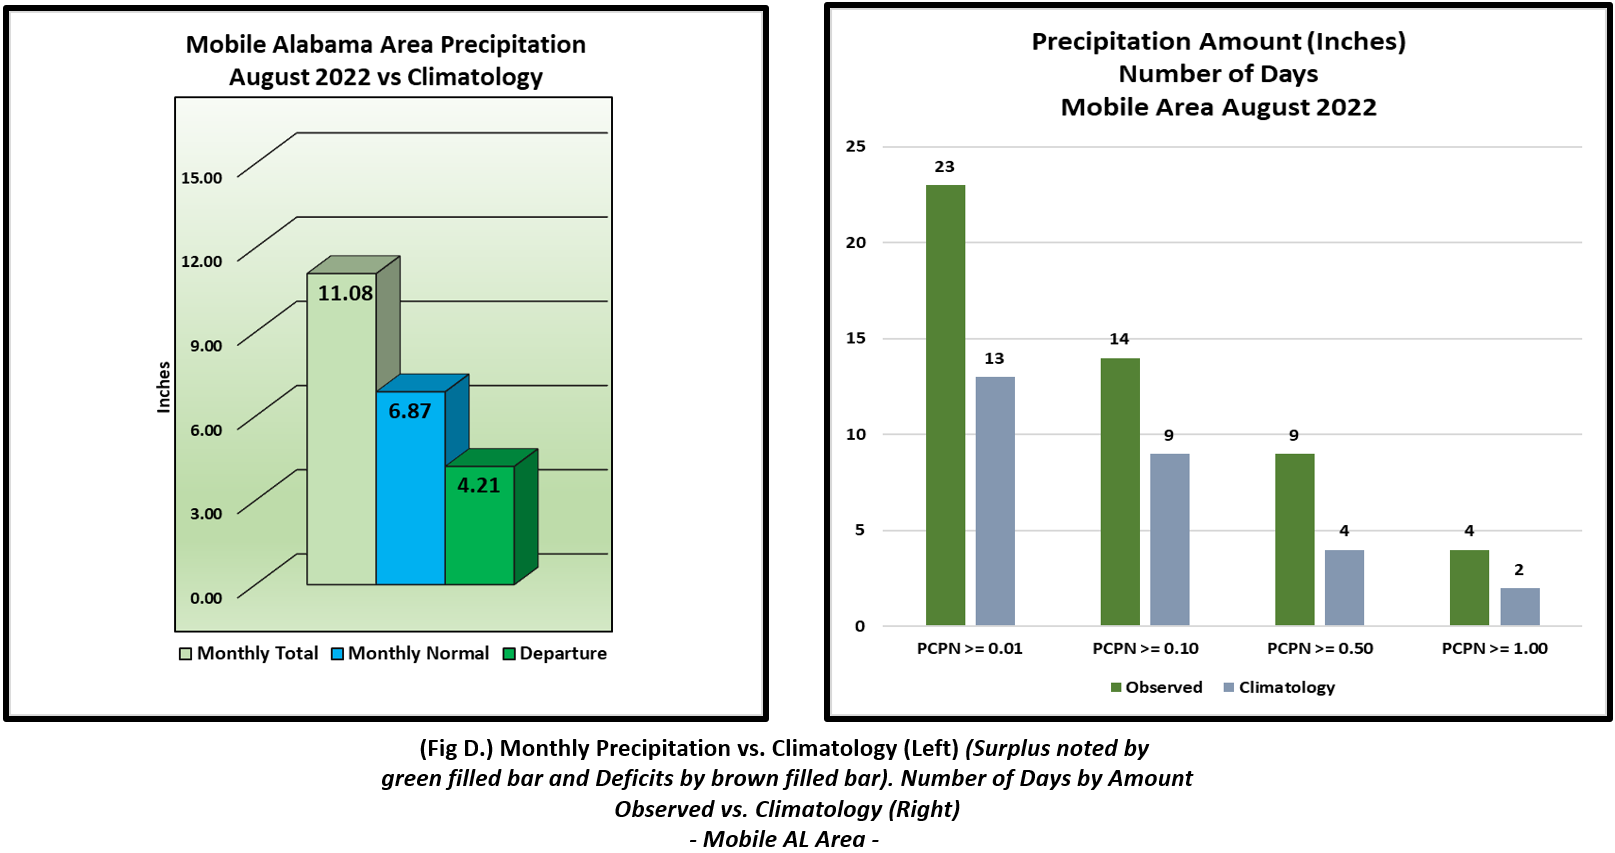
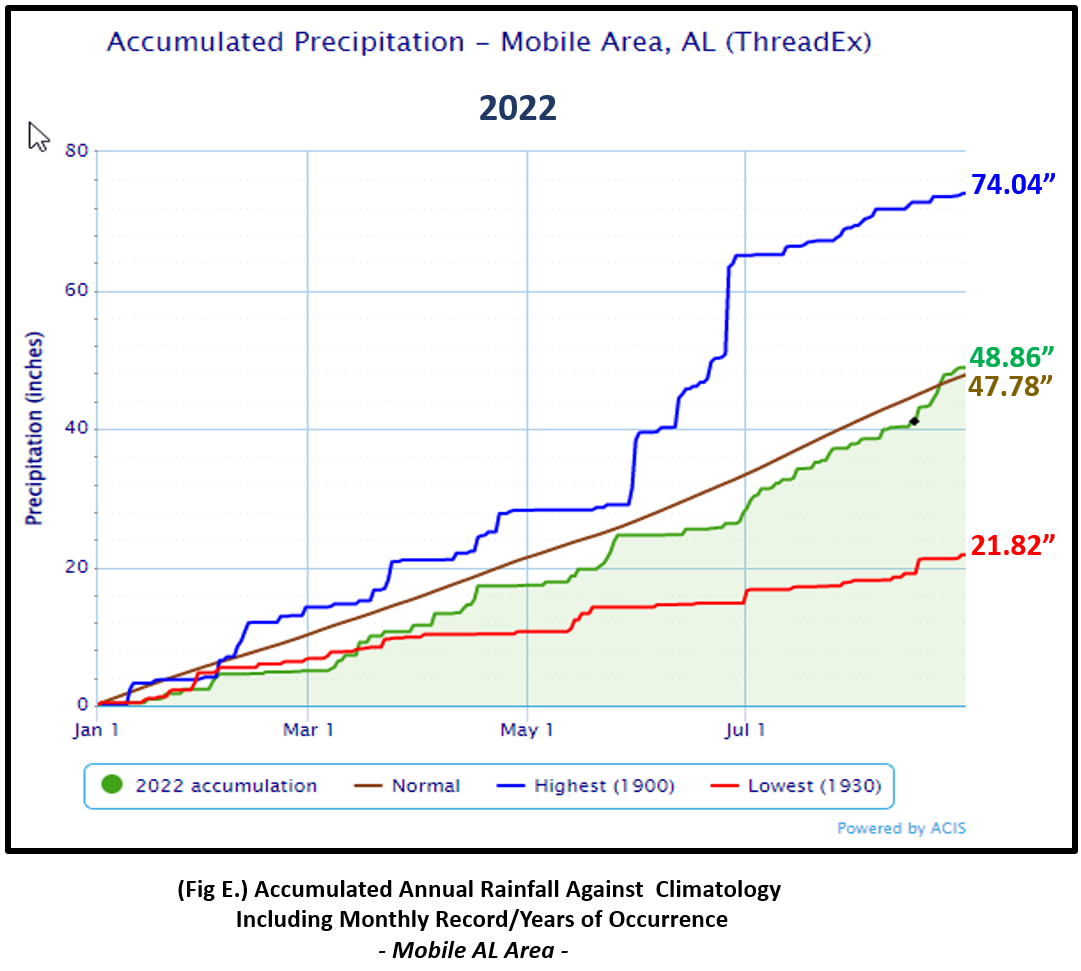
Mobile Alabama Area [Climate Normal Period 1991-2020, Climate Record Period 1872 to Present]- The average monthly high of 89.5° was 1.3° below normal. The average monthly low was 74.0° or 1.1° above normal. The average monthly temperature of 81.8° was 0.1° below normal. The highest temperature for the month, 97° on the 16th was 6° above the normal for the date. The lowest temperature for the month, 72° on the 9th and 27th, was just 1° below normal and normal respectively for these dates. A new record low high temperature of 77° was set on the 25th and was 13° below normal for this date. The previous record low high on this date was 78° last set way back on two occasions, 1936 and 1921. (Fig. A) shows a graphical representation of how the Mobile area temperatures compared to the seasonal normal daily highs and lows, which are shown by the colored dashed lines. Bar graphs reflecting the daily high/low temperature departures from normal are provided in the table below (Figs. B and C). The rain gauge caught 11.08" (Fig. D), 4.21 " above the monthly normal. After seeing a running annual to date rainfall deficit ending the last seven months, excessive rains for August finally put the Mobile area over the top of annual normal by just slightly over 1". (Fig. E)
August top records for the month during the Period of Record for the Mobile Area:
Click on the Mobile Alabama area climate graphics below to expand:
|
|
|
|
|
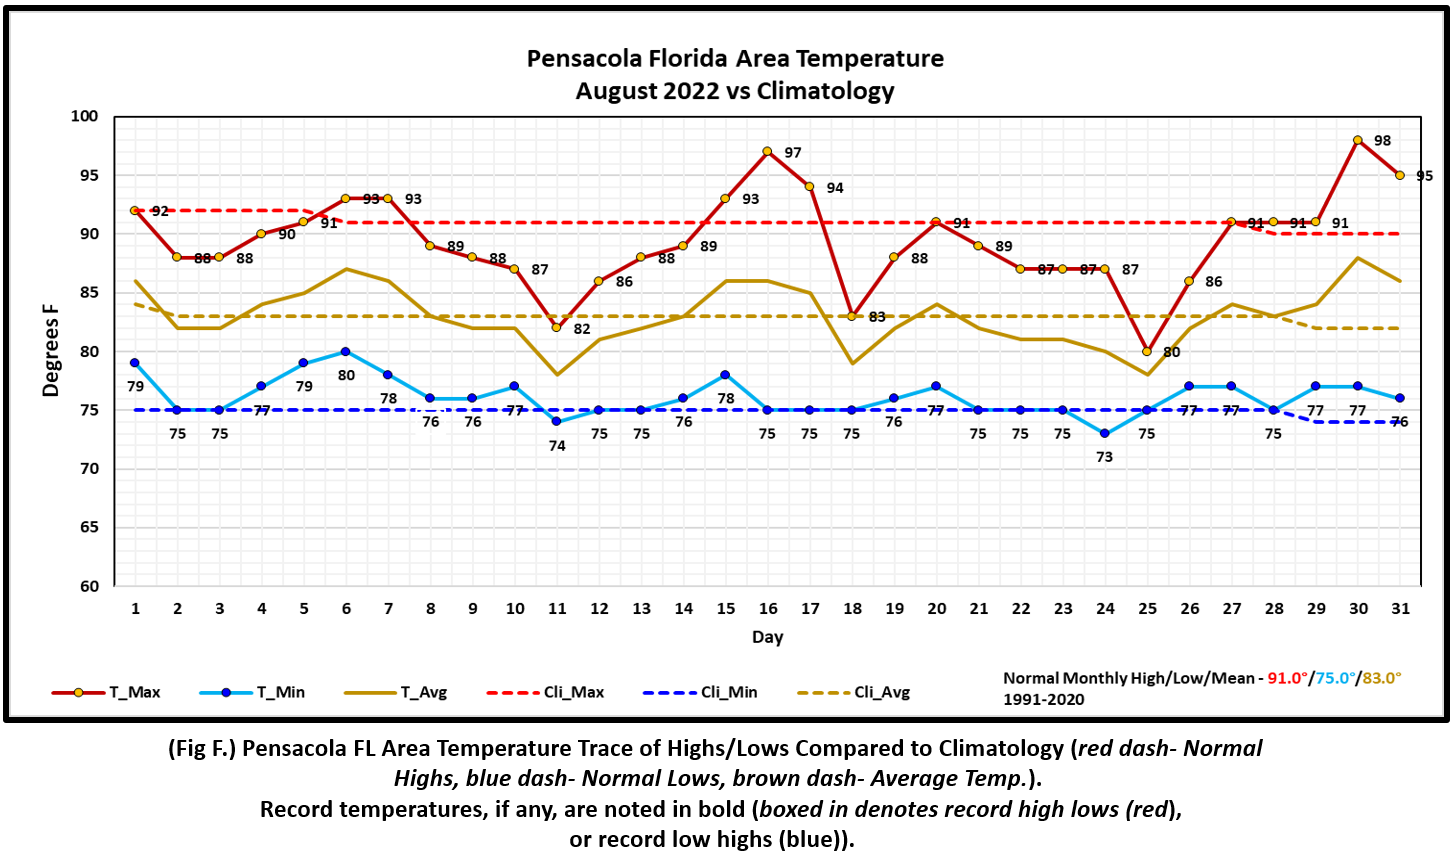
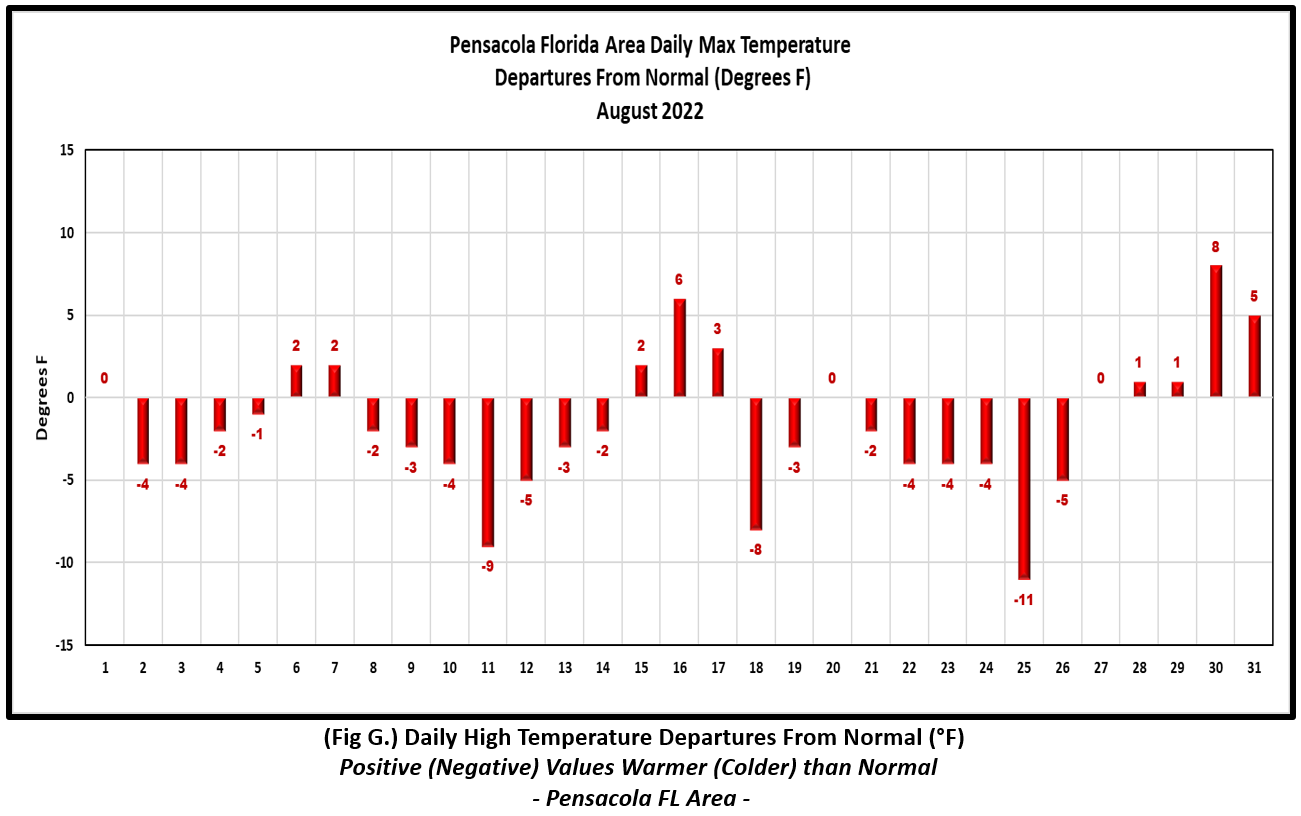
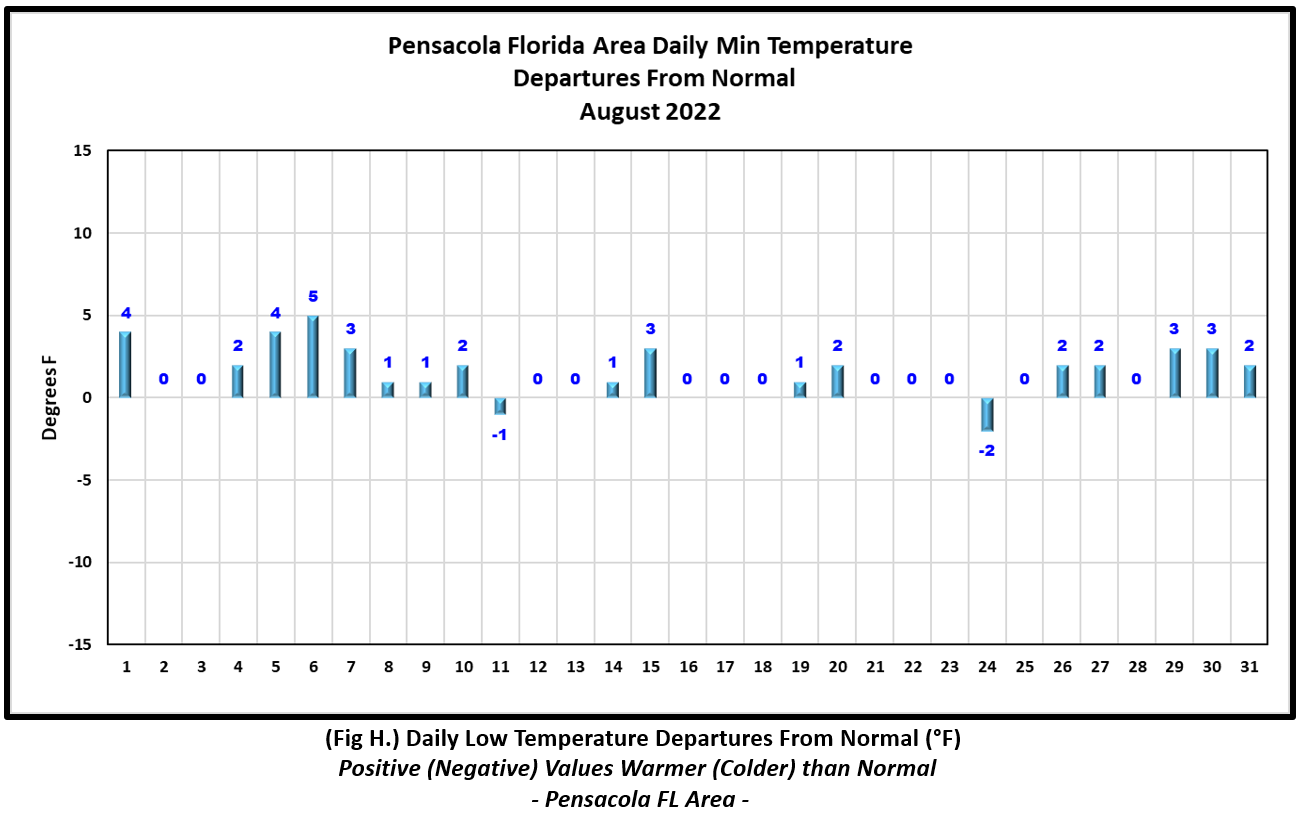
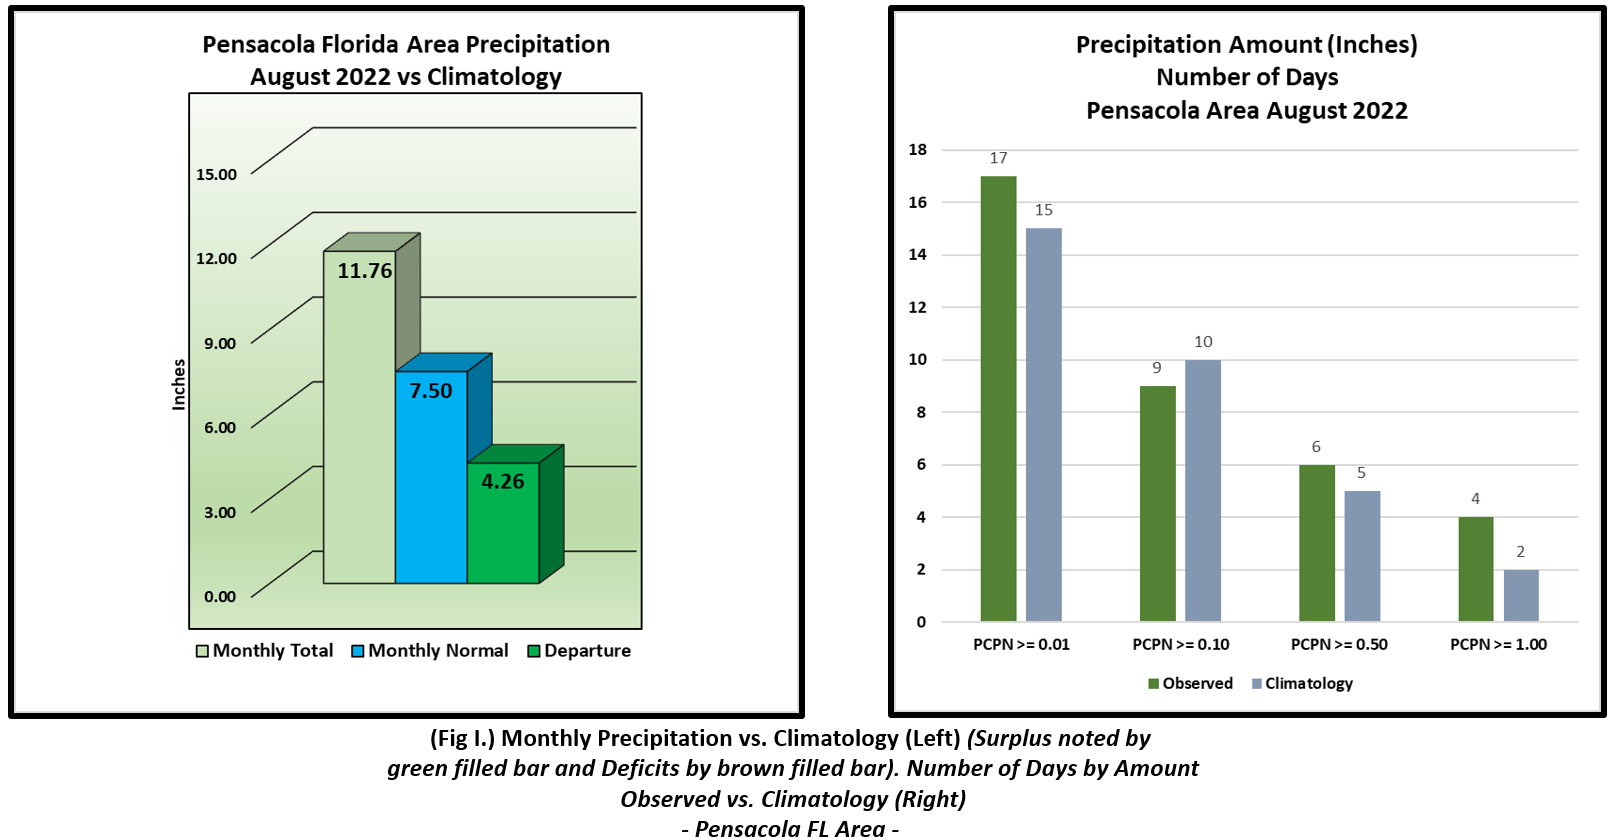
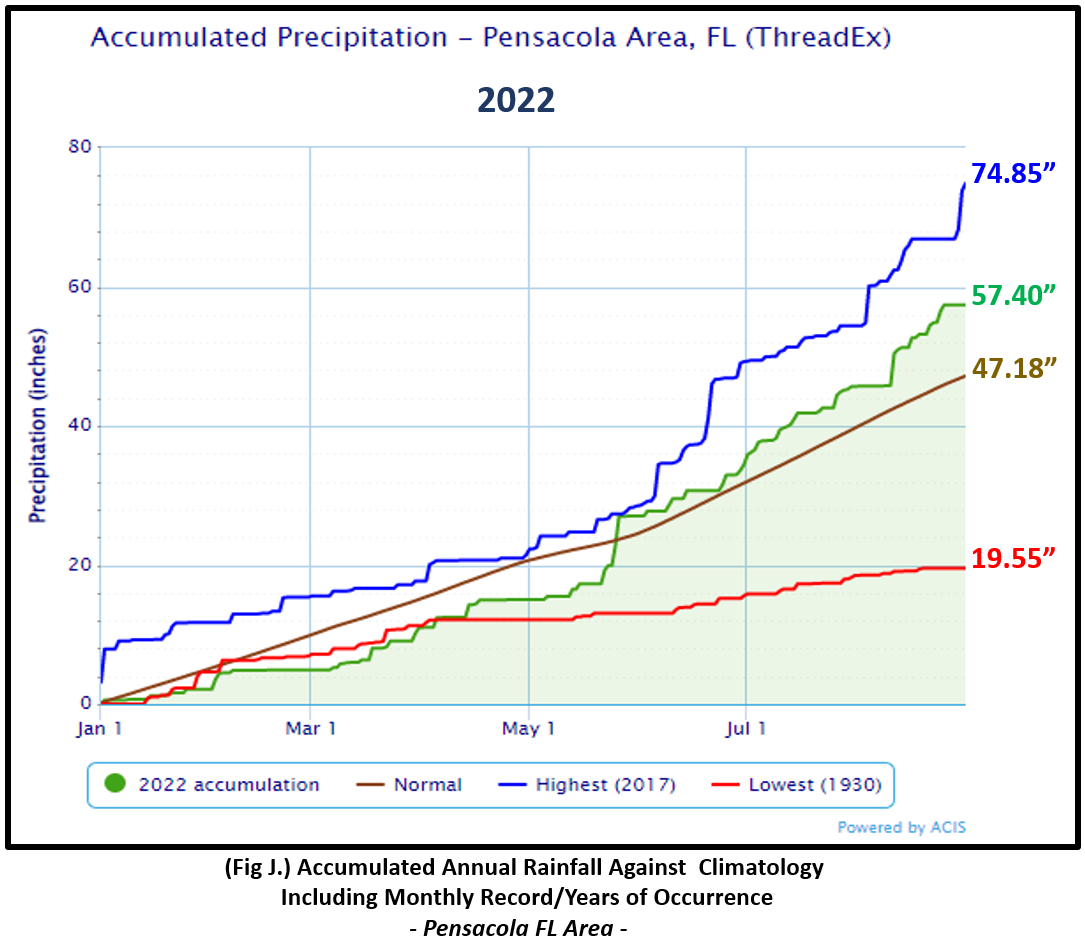
Pensacola Florida Area [Climate Normal Period 1991-2020, Climate Record Period 1879 to Present] - The average monthly high of 89.4° was 1.6° below normal. The average monthly low was 76.1° or 1.1° above normal. The average monthly temperature of 82.8° was 0.2° below normal. The highest temperature for the month, 98° on the 30th was 8° above the normal daily high temperature for this date. The lowest temperature for the month, 73° on the 24th, was 2° below the normal daily low temperature for this date. No record temperatures were reached. (Fig. F) shows a graphical representation of how the Pensacola area temperatures compared to the seasonal normal daily highs and lows, which are shown by the colored dashed lines. (Figs. G and H) shows the daily high/low temperature departures from normal. The rain gauge collected several inches at 11.76" (Fig. I), or 4.26" above the monthly normal. On the 11th, 39% of the monthly rainfall total fell. 4.59" on this date broke into the record books setting a new record one day amount. The previous record on the 11th was 3.73" set way back in 1911. The surplus in annual rainfall, since early summer, continues to increase to slightly over 10" above normal to date. (Fig. J).
August top records for the month during the Period of Record for the Pensacola Area:
Click on the Pensacola Florida area climate graphics below to expand:
|
|
|
|
|
Additional August 2022 Climatology and Topics
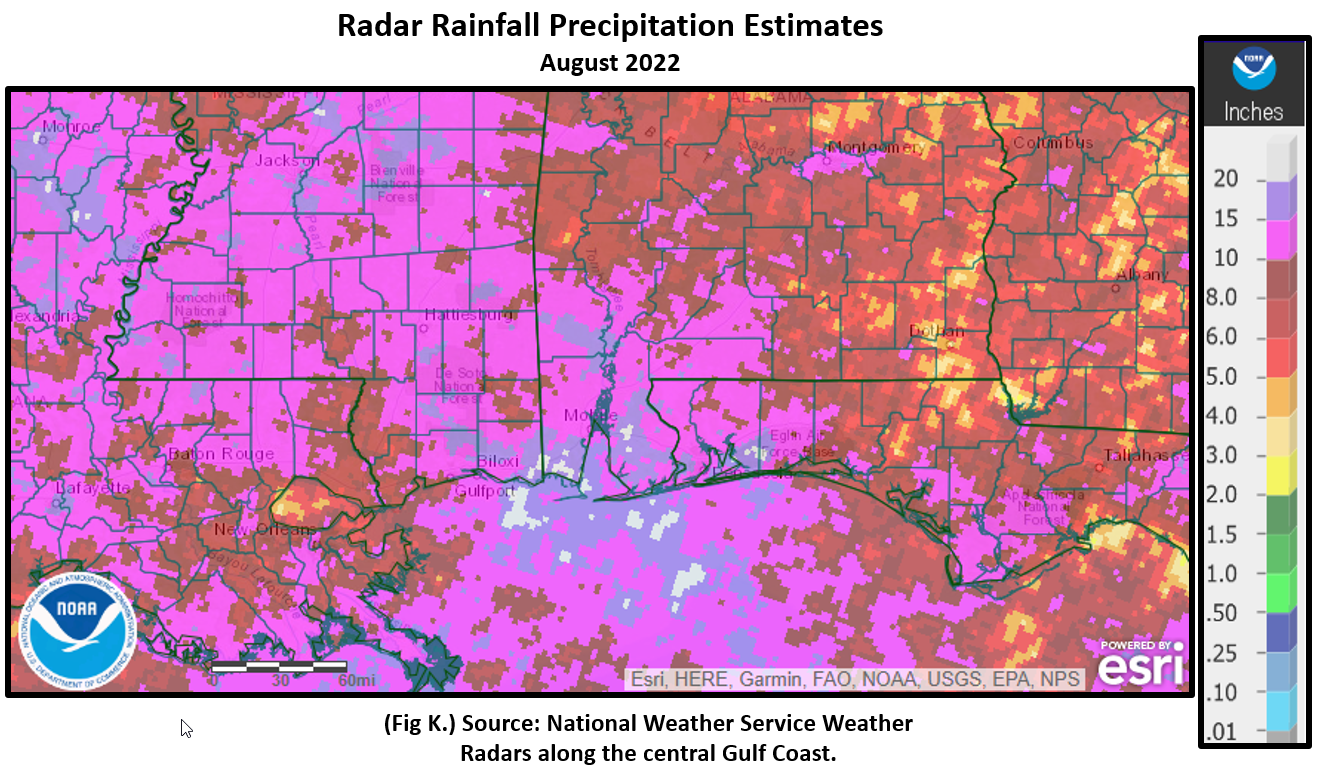
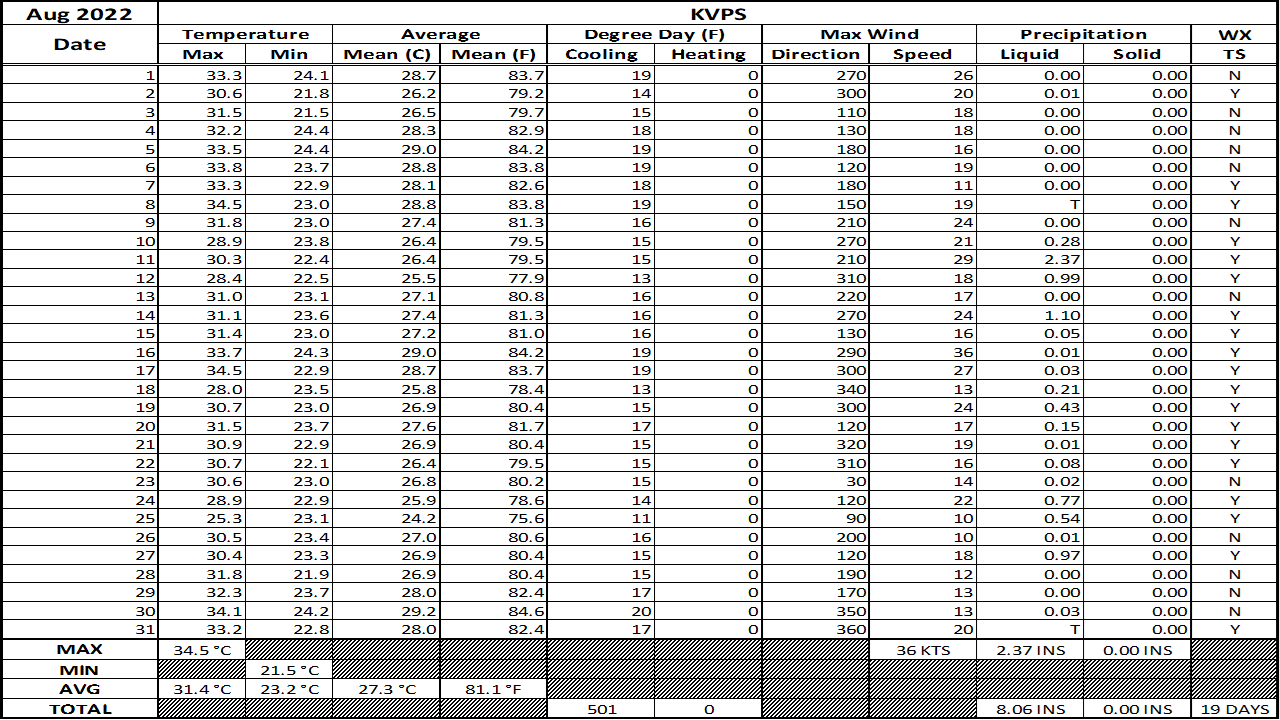
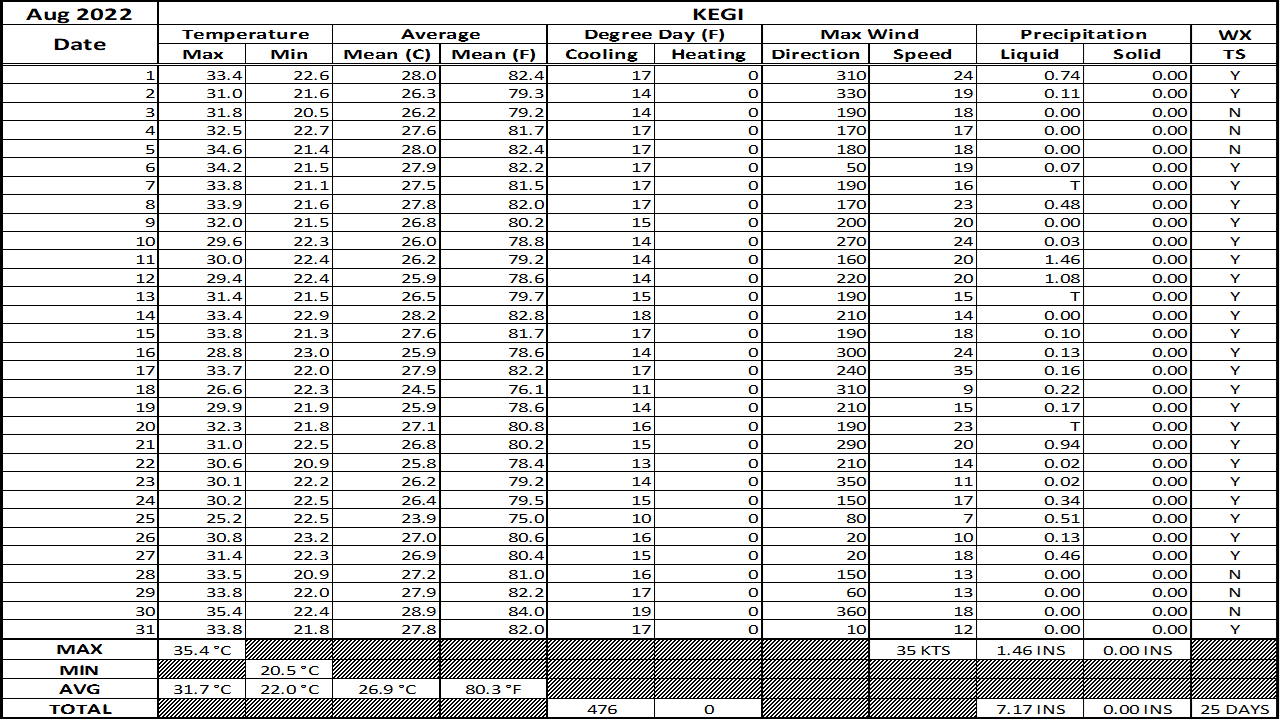
Three new tabs have been provided in the table below which highlights the excessive rain that impacted the central Gulf coast during the month of August. Fig. K shows the monthly total, Fig. L shows the departures from normal and Fig. M, the percent of normal. Interestingly, much of the local area saw between 200 and 400% of normal rains. The August 2022 monthly summary for Eglin Air Force Base (AFB) - KVPS and Duke Field - KEGI has also been received and provided in the table below. The temperatures in the daily tables consists of numbers both in °F/°C. Data courtesy of Mr. David Biggar, Staff Meteorologist, 96th Weather Squadron. Provided by permission.
|

|

|

|
|
|
September 2022 Climatology, Seasonal Climatology and Outlooks:
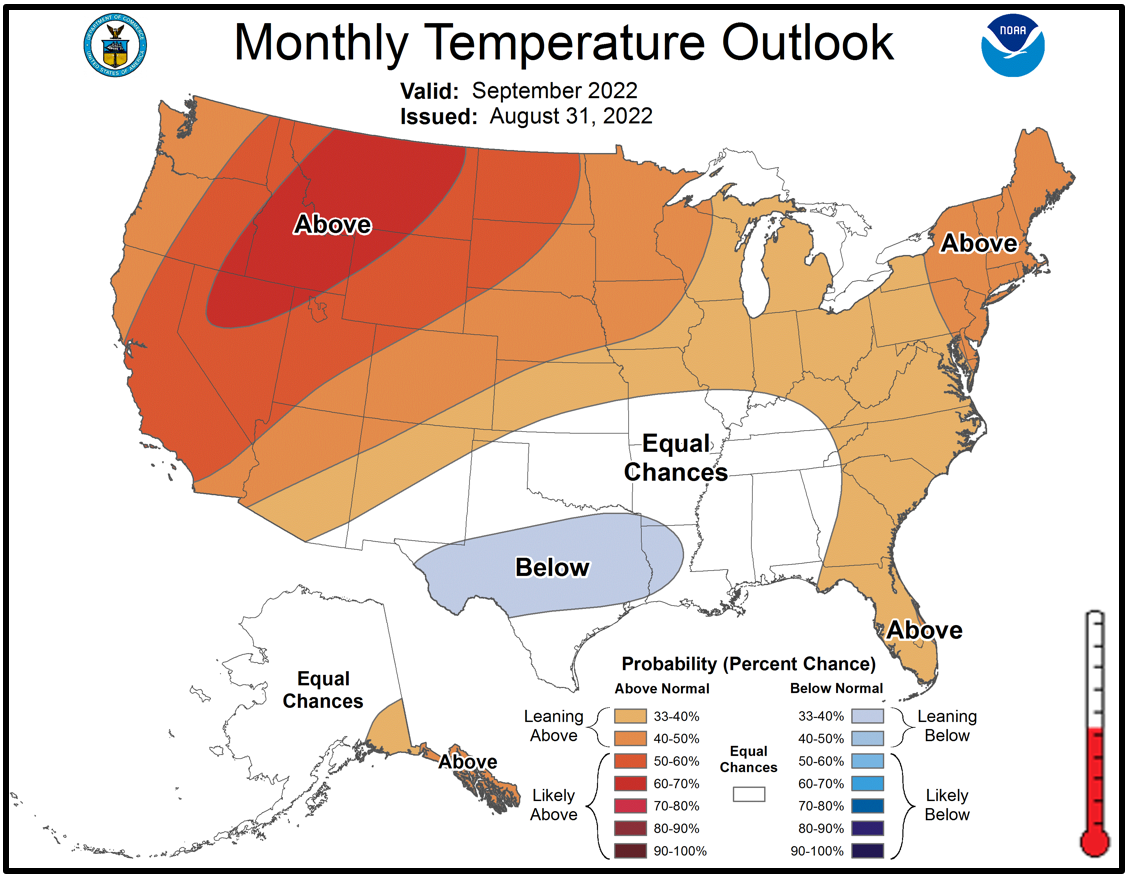
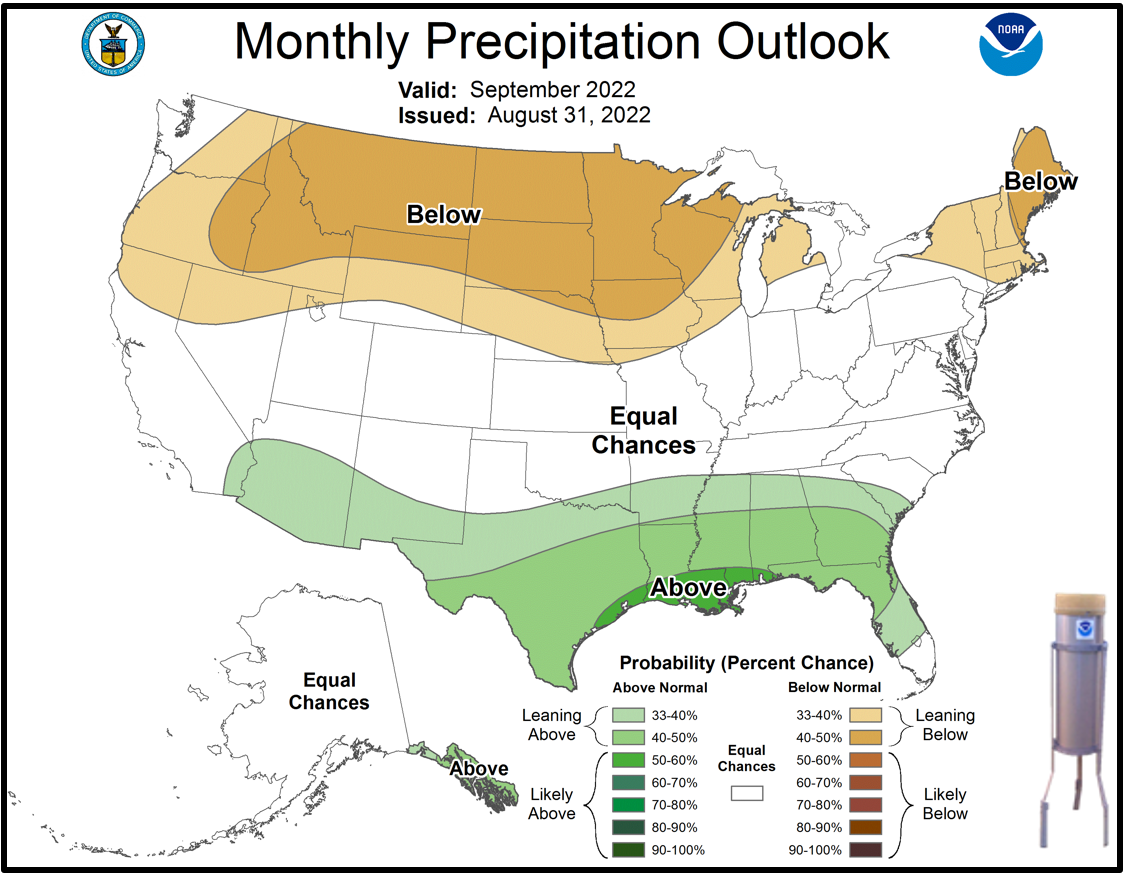
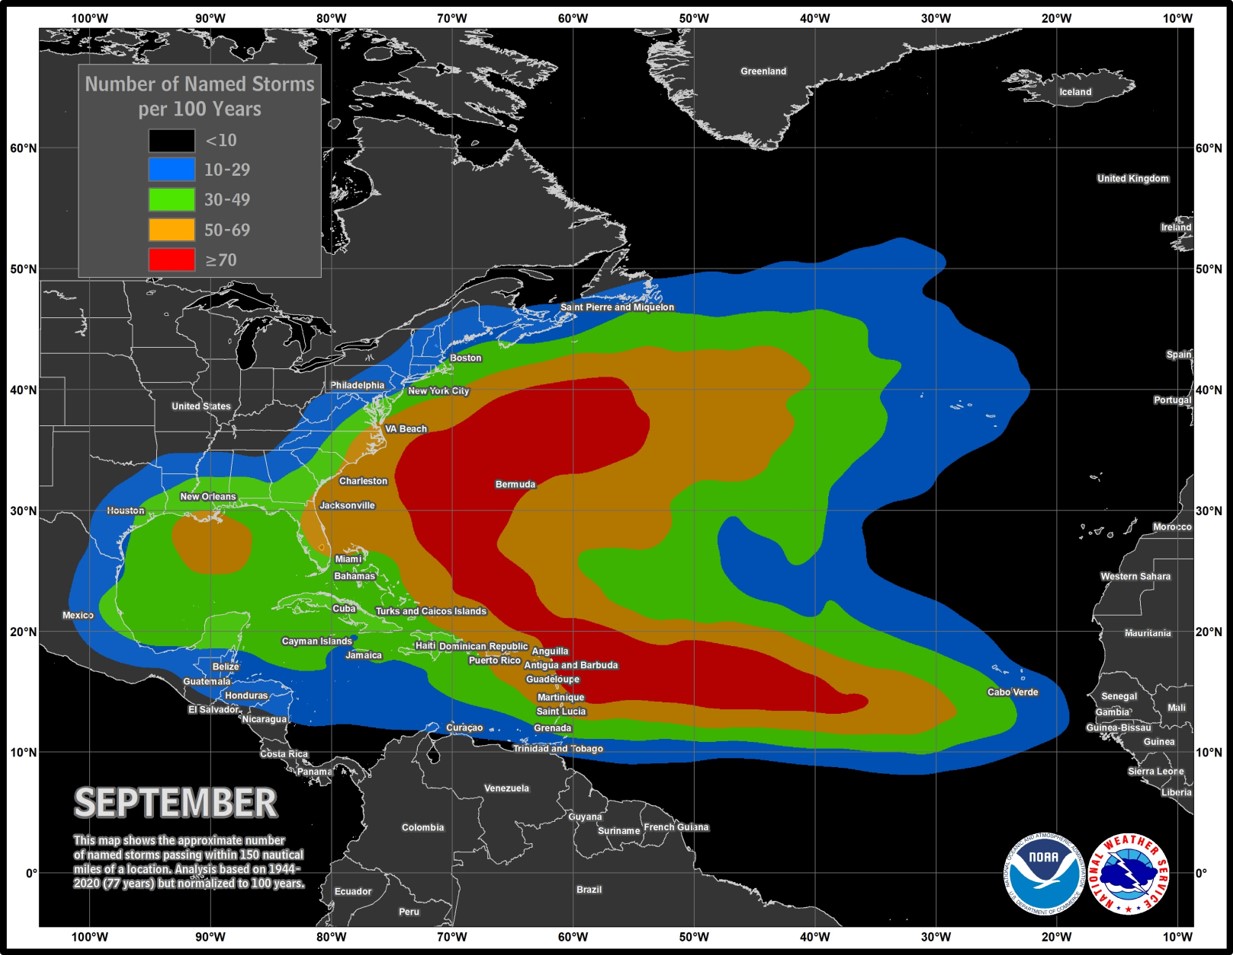
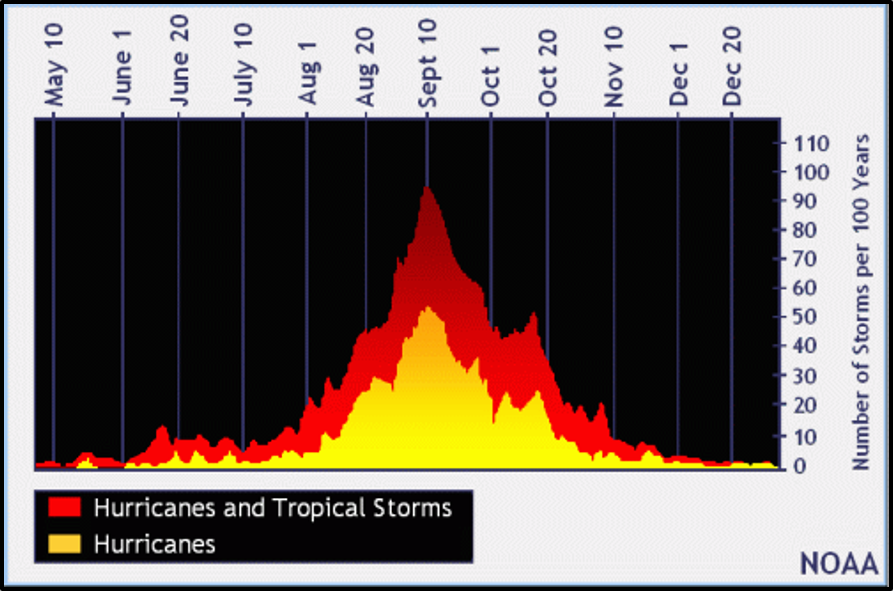
Looking ahead to September, the south central US is favored to see equal chances of above or below normal temperatures. In fact west of the Lower MS River Valley into much of Texas is favored to see below normal temperatures. As far as precipitation, the outlook favors likely above normal rains over the northern Gulf coast while leaning above normal, northward over the Lower MS River Valley. We are now into the peak month of hurricane season. NOAA updated its outlook for tropical activity earlier in August. See the updated outlook here. It's highly encouraged to review your hurricane preparedness. Click on the Preparedness Tab on the NWS Mobile Tropical Webpage.
Click on the snap shots below to expand:
 September Normals September Normals |
|
Outlook |

|
|
|

|
Additional Climate Links:
The links below are intended to provide additional climate information, education and outlooks. The National Weather Service Mobile Alabama's Climate and Past Weather page provides climate data at your fingertips for many observation points in the local forecast area by accessing the NOWData tab as well as many other climate resources. The Climate Prediction Center Link provides short and longer range climatic outlooks and education about the larger scale global circulations that impact temperatures and weather. With the large agriculture and farming presence along the central Gulf coast, the Drought Monitor link provides updates on drought trends and impacts. Another very helpful resource is the Community Collaborative Rain Hail and Snow (CoCoRaHS) network, which is a large group of volunteers working together to measure and map precipitation (rain, hail and snow). The aim of CoCoRaHS is to provide the highest quality data for natural resource, education and research applications. You can be a part of the CoCoRaHS team by becoming a volunteer rainfall observer. To learn more click on the CoCoRaHS link below.
National Weather Service Mobile AL Climate and Past Weather
Climate Prediction Center (CPC)
CoCoRaHS Network Water Year Summaries
![]()