August 2020 Climate Summaries
Mobile Alabama and Pensacola Florida Area
National Weather Service Mobile Alabama
September 2, 2020
August 2020 in Review - The first half of the month saw high temperatures mostly a few degrees above normal at both Mobile and Pensacola with a trend to lower highs the end of the month due to a more cloudy and persistent wet pattern. Highs and lows averaged very close to seasonal normals. There were two records and both occurred at Pensacola; a new record high low temperature and a new record one day rainfall both occurred at the end of the month. There was quite a variance in precipitation where Pensacola's rain gauge amount, just over thirteen inches, was nearly three times the amount collected compared to the Mobile area.
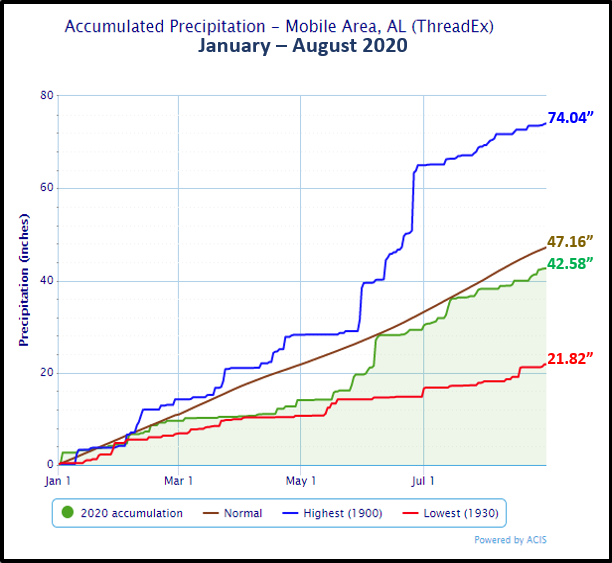
Mobile Alabama Area [Climate Normal Period 1981-2010, Climate Record Period 1872 to Present]- The average monthly high of 90.5° was 0.2° below normal. The average monthly low was 72.5° or 0.1° below normal. The average monthly temperature of 81.5° was 0.1° below normal. The highest temperatures for the month, 94°, occurred on the 7th, 11th, and 18th. The lowest temperature of 69° occurred on the 7th and the 21st. No record temperatures were met. (Fig. A) shows a graphical representation of how the Mobile area temperatures compared to the seasonal normal monthly highs and lows, which are shown by the colored dashed lines. Total rainfall for August (Fig. B) measured 4.37" or 2.59" below normal. A precipitation trace for the Mobile area since January 1st is provided in the graphics below showing how it compares to normal year to date totals. The annual rainfall deficit has risen since last month. Annual rainfall, at 42.58", is now 4.58" below normal.
August top records for the month during the Period of Record for the Mobile Area:
Click on the Mobile Alabama area climate graphics below to expand:

|

|
|
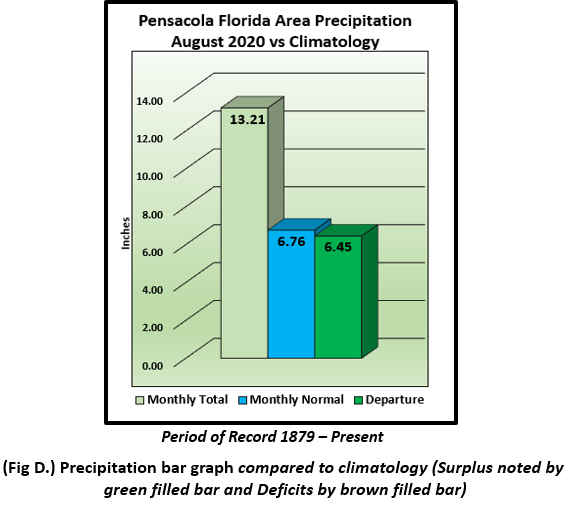
Pensacola Florida Area [Climate Normal Period 1981-2010, Climate Record Period 1879 to Present] - The average monthly high of 90.3° was 0.9° above normal. The average monthly low of 76.1° was 1.9° above normal. The average monthly temperature of 83.2° was 1.4° above normal. The highest temperature for the month was 95°, occurring on the 16th. The lowest temperature for the month was 72°, occurred on the 21st. A new record high low temperature of 81° occurred on the 26th and broke the previous record of 80° on this date set in 2017. (Fig. C) shows a graphical representation of how the Pensacola area temperatures compared to the seasonal normal monthly highs and lows, which are shown by the colored dashed lines. Total rainfall for August (Fig. D), measured a whopping 13.21". This was over a half foot above normal at 6.45". A new record one day rainfall of 2.22" occurred on the 24th and broke the previous record on this date set in 1961 by just 6 hundredths of an inch. A precipitation trace for the Pensacola area is provided in the graphics below showing how it compares to normal year to date totals. At least for now, excessive rainfall from August has erased the annual deficit. The Pensacola area annual rainfall stands at an even 46.00", now above normal by 1.23".
August top records for the month during the Period of Record for the Pensacola Area:
Click on the Pensacola Florida area climate graphics below to expand:

|
|

|
September Climatology and Outlooks:
The latest monthly outlook favors equal chances of above or below normal temperatures for much of the coastal plain. To the east over the southeast US, southward over the Florida Peninsula, above normal temperatures are favored. The coastal plain is bisected by a favored more wet pattern to the east over the southeast US to equal chances of above/below normal precipitation over the extreme southern portions of the Lower Mississippi River Valley. We continue on through the climatological peak of the Atlantic Basin Hurricane Season. An extremely active hurricane season continues. NOAA released its updated 2020 Atlantic Basin Hurricane Forecast early last month and urges preparedness. Below, additional graphics have been added highlighting tropical climatology favored storm points of origin and distribution of occurrence.
Click on the snap shots below to expand:

|

Outlook |

Outlook |

|

|

|
Climate Prediction Center's Interactive Long Range Outlooks
Additional Climate Links:
The links below are intended to provide additional climate information, education and outlooks. The National Weather Service Mobile Alabama's Climate and Past Weather page provides climate data at your fingertips for many observation points in the local forecast area by accessing the NOWData tab as well as many other climate resources. The Climate Prediction Center Link provides short and longer range climatic outlooks and education about the larger scale global circulations that impact temperatures and weather. With the large agriculture and farming presence along the central Gulf coast, the Drought Monitor link provides updates on drought trends and impacts. Another very helpful resource is the Community Collaborative Rain Hail and Snow (CoCoRaHS) network, which is a large group of volunteers working together to measure and map precipitation (rain, hail and snow). The aim of CoCoRaHS is to provide the highest quality data for natural resource, education and research applications. You can be a part of the CoCoRaHS team by becoming a volunteer rainfall observer. To learn more click on the CoCoRaHS link below.
National Weather Service Mobile AL Climate and Past Weather
Climate Prediction Center (CPC)
CoCoRaHS Network Water Year Summaries


