April 2021 Climate Summaries
Mobile Alabama and Pensacola Florida Area
National Weather Service Mobile Alabama
May 6, 2021
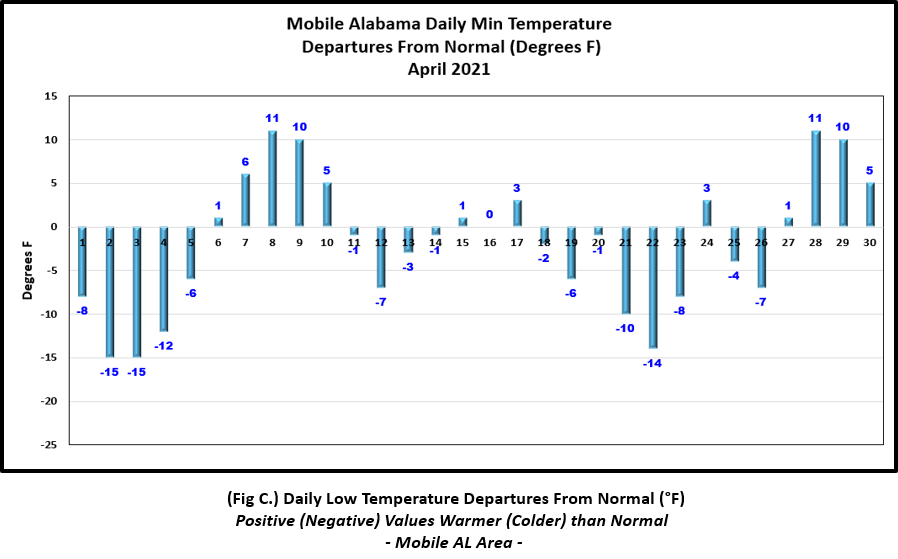
April 2021 in Review - Mobile started the month off cool with highs well below normal before recovering to above normal, followed by another lengthy period when daily highs from the 14th - 23rd averaged 6.7° below normal. Other notable cold spells were from the 1st - 5th when lows averaged 11.2° below normal and from the 18th - 26th, 5.4° below normal. One record low high temperature was reached on the 17th. On the flip side, as far as precipitation is concerned, the rain gauge collected a substantial amount of rainfall of just over one foot, nearly two times more than the climatological normal for the month of April. Two record setting rainfall days contributed to half the monthly rainfall combined.
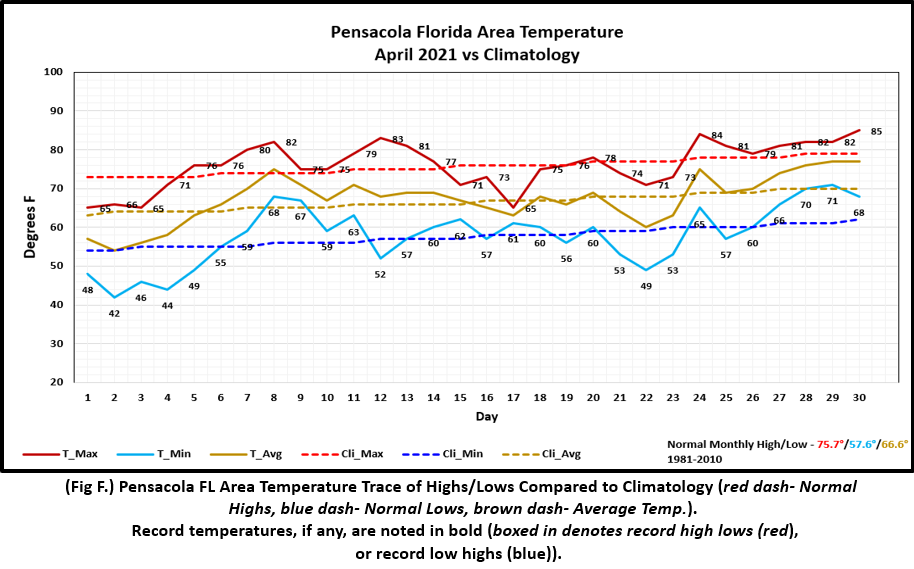
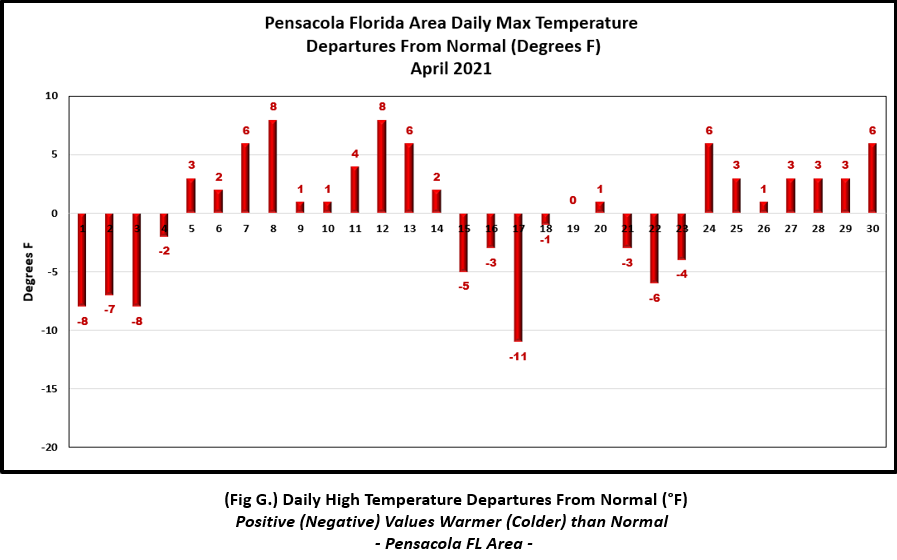
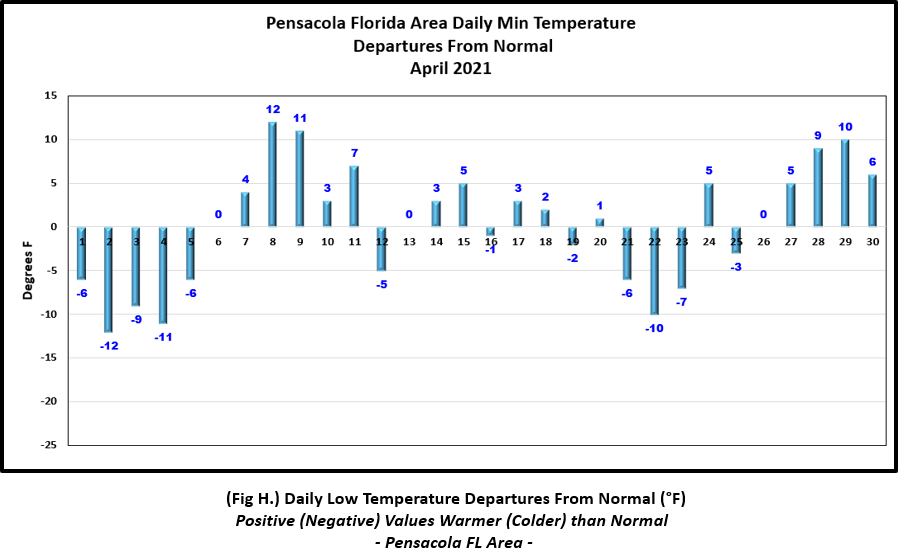
For the Pensacola area, daily highs were noticeably different when compared with Mobile. Daily highs from the 5th - 14th averaged 4.1° above normal after a cool start to the month. Opening up the latter half of April, the daily high averaged 3.4° below normal from the 15th - 25th before closing out the month above normal. Notable cold spells were from the 1st - 5th when daily lows averaged 8.8° below normal. No record temperatures were set. The rain gauge at Pensacola collected several inches of rain above the climatological normal for the month of April.
Mobile Alabama Area [Climate Normal Period 1981-2010, Climate Record Period 1872 to Present]- The average monthly high of 74.8° was 2.7° below normal. The average monthly low was 53.7° or 1.7° below normal. The average monthly temperature of 64.3° was 2.2° below normal. The highest temperature for the month, 84° on the 29th was 3° above the normal daily high temperature for this date. The lowest temperature for the month, 37° on the 2nd and 3rd was 15° below the normal daily low temperatures on both dates. One record high low was reached. 65° on the 17th tied the previous record on this date set back in 1923. (Fig. A) shows a graphical representation of how the Mobile area temperatures compared to the seasonal normal daily highs and lows, which are shown by the colored dashed lines. Bar graphs reflecting the daily high/low temperature departures from normal are provided in the table below (Figs. B and C). A noteworthy mention was the precipitation department. After a lengthy period of monthly rainfall deficits, April 2021 came out on the plus side in a huge way. The rain gauge collected just over a foot of rainfall (Fig. D), measuring 12.71", or 7.92" above normal. Contributing to half the excessive monthly rain was the occurrence of two record setting days of daily precipitation. 3.48" on the 10th broke the previous record amount of 2.71" set on this date in 1955. Two weeks later, 2.88" falling on the 24th, surpassed the previous record amount of 2.68" set on this date in 1937. Annual rainfall (Fig. E) now shows just north of 2.0" above normal to date.
April top records for the month during the Period of Record for the Mobile Area:
Click on the Mobile Alabama area climate graphics below to expand:

|

|
|

|

|
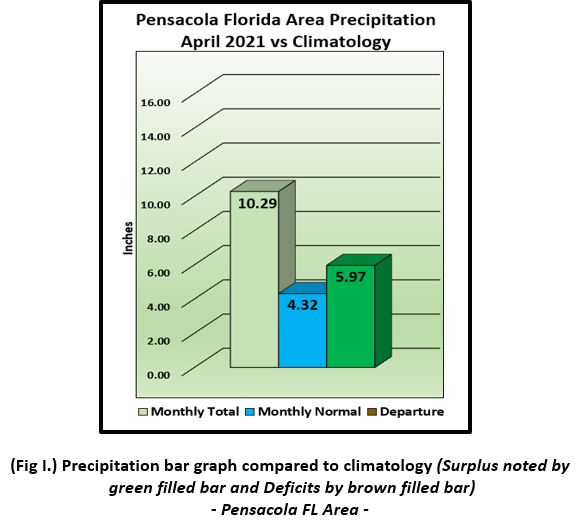
Pensacola Florida Area [Climate Normal Period 1981-2010, Climate Record Period 1879 to Present] - Average temperatures were just a half degree or less off the monthly normal. The average monthly high of 76.0° was 0.3° above normal. The average monthly low was 57.9° or 0.3° above normal. The average monthly temperature of 67.0° was 0.4° above normal. The highest temperature for the month, 85° on the 30th was 6° above the normal daily high temperature for this date. The lowest temperature for the month, 42° on the 2nd was 12° below the normal daily low temperature for this date. No record temperatures were reached. (Fig. F) shows a graphical representation of how the Pensacola area temperatures compared to the seasonal normal daily highs and lows, which are shown by the colored dashed lines. (Figs. G and H) shows the daily high/low temperature departures from normal. (Fig. I) shows Pensacola received 10.29" of rain, or 5.97" above normal. This amount lifts the annual rainfall to positive territory (Fig. J), rising to 1.65" above normal to date. Quite a change since last seen in March as well.
April top records for the month during the Period of Record for the Pensacola Area:
Click on the Pensacola Florida area climate graphics below to expand:
|
|
|
|

|
Additional April 2021 Climatology and Topics
The latest April 2021 monthly summary for Eglin Air Force Base (AFB) - KVPS and Duke Field - KEGI has been received and provided in the table below. The temperatures in the daily tables are consists of numbers both in °F/°C. Data courtesy of Mr. David Biggar, Staff Meteorologist, 96th Weather Squadron. Provided by permission.

|

|

|
May 2021 Climatology, Seasonal Climatology and Outlooks:
Important: NOAA will be updating the climatology dataset to a "New Normal" this month. The new 30-year dataset will span from 1991 to 2020. For more information on the roll-out, refer to the following link from the National Centers for Environmental Information (NCEI 30 Year Normals 1991-2020).
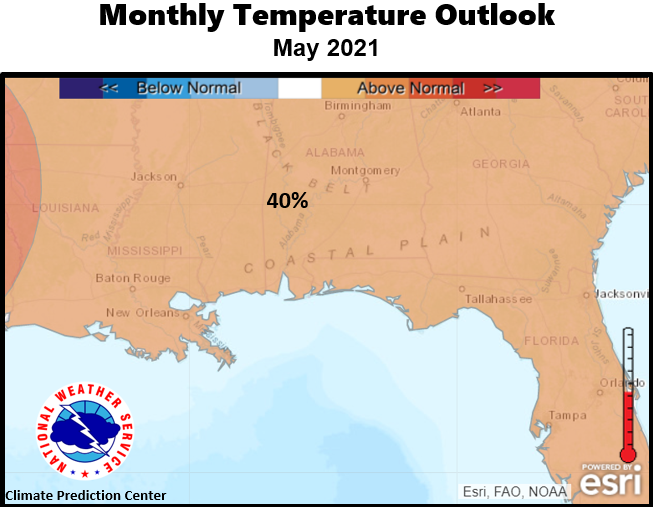
The latest outlook for May favors about a 40% probability of seeing above normal temperatures over the southeast US and coastal plain. A wet pattern is outlooked with a 33 to 40% probability of above normal precipitation. The recent heavy rains keeps the local area out of drought. Even so, a link to the latest national drought information and outlooks are included in the table below. Information on severe weather climatology is also posted as a link.
Click on the snap shots below to expand:

|
|

Outlook |
|

|
Additional Climate Links:
The links below are intended to provide additional climate information, education and outlooks. The National Weather Service Mobile Alabama's Climate and Past Weather page provides climate data at your fingertips for many observation points in the local forecast area by accessing the NOWData tab as well as many other climate resources. The Climate Prediction Center Link provides short and longer range climatic outlooks and education about the larger scale global circulations that impact temperatures and weather. With the large agriculture and farming presence along the central Gulf coast, the Drought Monitor link provides updates on drought trends and impacts. Another very helpful resource is the Community Collaborative Rain Hail and Snow (CoCoRaHS) network, which is a large group of volunteers working together to measure and map precipitation (rain, hail and snow). The aim of CoCoRaHS is to provide the highest quality data for natural resource, education and research applications. You can be a part of the CoCoRaHS team by becoming a volunteer rainfall observer. To learn more click on the CoCoRaHS link below.
National Weather Service Mobile AL Climate and Past Weather
Climate Prediction Center (CPC)
CoCoRaHS Network Water Year Summaries
![]()