Central Gulf Coast Tornado Outbreak
of
13 October 2001
- A Synoptic Discussion -
prepared by:
Jeffrey M. Medlin
Science and Operations Officer
National Weather Service Mobile, AL
Introduction
| During the morning and afternoon hours of 13 October 2001, a tornado outbreak occurred over a relatively small portion of the central Gulf Coast (9 tornadoes per ~ 3200 square miles) region and relatively close to the coast (< 50 km). To lend significance to the event, eight tornadoes occurred within Baldwin County Alabama alone. This number of tornadoes (five F0s, one F1, one F2 and an F3) accounts for 12.6% of all reported tornadoes (71) for Baldwin County during the period of record 1950-2001. To see a photograph of the F3 Foley, AL tornado <click here>.
A post-event radar analysis revealed 52 shallow mesocyclones (rotation depths generally < 1.5 km) that were detected under the NWS Mobile, AL WSR-88D radar coverage area (out to 240 km) between ~1100-2100 UTC. The latter figure does not account for the mesocyclones that developed prior to and after this time range nor the mesocyclones that evolved beyond ~120 km whose low-level rotation eluded radar detection. For an hourly glance at the radar evolution of the tornado-producing mesocyclones see the table below. This event remains focused on storm-scale evolutions leading up to and just after the peak time of tornado occurrence (~19 UTC). WSR-88D - 0.5 deg Base Reflectivity Evolution
The event was initially driven by a deeply-reflected mid- and upper-tropospheric longwave trough which ejected from the southern Rockies on 13 October 2001/0000 UTC . The trough developed a negative-tilt orientation during the ensuing 24 h period and was located over western Louisiana by 14 October 2001/0000 UTC. To see a map that contains a partial account of the total number of severe weather reports that occurred in association with thunderstorms developing ahead of the trough <click here>. According to records kept by Penn State University (source Penn State Eyewall Homepage), the trough was highly energetic and passed very far south given the time of year. Note the deviation (measured in standard deviations) of several parameters (temperature, height, winds and moisture) from their mean background fields ( climatological departures (measured as standard deviation ). |
Global Longwave Pattern
| Found this piece of information on the 13 October 2001 longwave pattern (courtesy Penn State Eyewall Homepage).
Global scale : 1200 UTC 14 October 2001 : MTOTAL = 3.966 from a very high amplitude trough with its base in the Gulf of America. This became the new 4th highest October MTOTAL. Over 5 days ending 14 October, the trough contributed to a widespread severe weather outbreak from Nebraska to Georgia, including a preliminary count of over 175 wind damage reports, 155 hail reports, and 60 tornadoes (source NOAA NWS SPC). This event contributed greatly to what would become the most active October for U.S. tornado occurrence in recorded history. Click here -> to see climatological departures (measured as standard deviation) : Explanation of 'M-Value' : This page presents the results of an analysis performed to objectively rank events based upon how far synoptic-scale fields depart from "normal": N = ( field - X ) / sigma field = The observed field Therefore, N is measured in the number of standard deviations from normal. This departure is calculated for each of four variables: temperature, height, wind, and moisture. Then, the maximum N-value for each variable is found (MTEMP, MHEIGHT,MWIND, and MMOIST respectively). The total departure is then the full-troposphere mean (1000hPa -> 200hPa) of these four departures: MTOTAL = (MTEMP + MHEIGHT + MWIND + MMOIST) / 4 |
Event Synoptic Conditions
| 13 Oct 2001 - 0000Z 15 hours prior |
13 Oct 2001 - 1200Z 3 hours prior |
14 Oct 2001 - 0000Z Event Still Underway |
|
| Upper Troposphere | 300 mb wind and Div | 300 mb wind and Div | 300 mb wind and Div |
| Middle Troposphere | 500 mb Hgt, Wind and Temp | 500 mb Hgt, Wind and Temp | 500 mb Hgt, Wind and Temp |
| Lower Troposphere | 850 mb Hgt, Wind and Td | 850 mb Hgt, Wind and Td | 850 mb Hgt, Wind and Td |
| Surface | MSLP, PBL Winds, 1000-500 mb Thkns and 850 mb Div | MSLP, PBL Winds, 1000-500 mb Thkns and 850 mb Div | MSLP, PBL Winds, 1000-500 mb Thkns and 850 mb Div |
Synoptic Discussion
A deeply-reflected mid- and upper-tropospheric longwave trough ejected from the southern Rockies on 13 October 2001/00 UTC . The trough developed a negative-tilt orientation during the ensuing 24 h period and was located over western Louisiana by 14 October 2001/0000 UTC. Compositing of 12 UTC event specific atmospheric processes over the area of concern revealed the development of a notable downwind upper tropospheric diffluent wind flow pattern, the development of a broad and strengthening low-level jet (40-60 kt, which acted to enhance both the advection and convergence of water vapor which contributed to low-level lapse rate destabilization during the greatest period of tornado production) and the propagation of the right entrance region of an upper level jet streak (75-100 kt) atop a strengthening lower tropospheric frontal zone. Although significant moisture advection developed as the low-level jet strengthened in response to the approaching trough (see low-level jet 15 hours prior, 3 hours prior and while underway ), surface-based instability was already near a maximum (see the 12 UTC 75 degree(F) surface dew-point ridge that lie over much of southwest Alabama, southeast Louisiana and southeast Mississippi ). It is important to note that in this event, both mid- and upper-tropospheric cold air and negative moisture advection apparently played no role in destabilizing the local airmass over the region where the event tornadoes formed. As such, the role of lower tropospheric thermodynamic instability will be discussed extensively below. |
Pre-Storm Environmental Conditions
| Lifting a surface parcel [ Potential Temperature = 297K (or 76F) and mixing ratio = 18.4 g/kg (or 74F) ] the 12 UTC Slidell, LA observed sounding possessed a Convective Available Potential Energy (CAPE) of 1951 J /kg. A meager 9 J/kg of Convective Inhibition (or CINH) existed due to a slight inversion just above 915 mb (the existence of this slight inversion is questionable as upper air sondes suddenly emerging from a moist layer into a dry layer often create artificial inversions. Upon initial inspection of the sounding, it is readily seen that below ~ 540 mb, the lapse rate was greater than moist adiabatic all the way to the surface. Near-saturated conditions existed between the surface and ~915 mb. It is also apparent that little solar insolation would be required to create relatively high values (~3500 J/KG) of surface-based instability given the amount of low-level water vapor present. Ambient winds veered from 150(deg) / 12kt at ground level to 185(deg) / 47 kt at 1500 m. Observed storm-relative helicity (SRH) values were 438 m2 / s2 given a forecast storm motion vector of 221(deg) / 28 kt (or 30R75 discussed later).
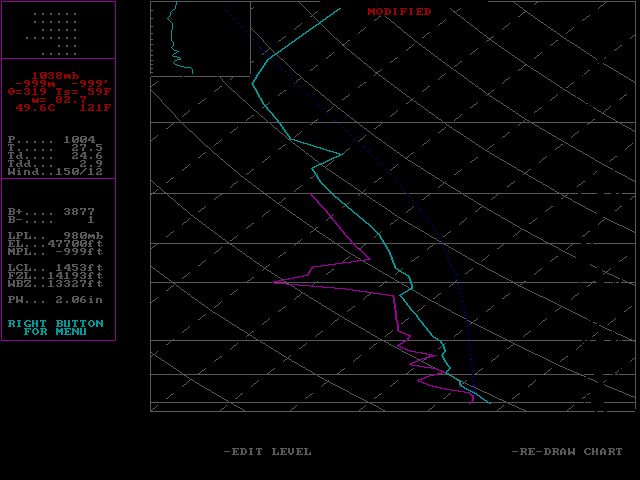
Upon modification of the 12 UTC sounding for the time and location of tornado occurrence (Fairhope, AL (FAI) at 17 UTC), it can be seen that a notable unstable layer existed between the ground and ~850 mb. Although not shown, the region over Baldwin County Alabama had received nearly six full hours of solar insolation and surface temperatures had warmed into the lower 80s. Surface dewpoints had risen very little since 12 UTC and remained in the mid 70s. The 17 UTC FAI sounding was conservatively constructed using a surface parcel described as [ Potential Temperature = 300K (or 81F) and mixing ratio = 19.9 g/kg (or 76F) ]. The latter yielded a maximum potential CAPE value of ~3877 J/KG, which represents nearly a two-fold increase above the 12 UTC Slidell, LA observation. Using six-hour forecast gridded model data, it was determined that little moisture or thermal changes occurred above the mechanically well-mixed boundary layer. The Level of Free Convection (LFC) was computed as 544 m (or ~1702 ft). This observation matched Mobile, AL (KMOB) ceiling height observations just prior to and after 17 UTC. It is known that in some areas of Baldwin County Alabama (based on 10.7 micron longwave Infrared satellite imagery), surface temperatures conceivably reached 85F, locally. Recently, Jonathan Davies (2002, un-published) examined 300 RUC-2 profiles associated with supercells (modified by surface observations). He grouped non-tornadic cases (155) and tornadic (F2-F5) cases (83) separately and examined means (and their spread using box and whisker plots) between the two groups for 0-3km CAPE, LFC Height and CINH. Below is a table that compares the findings of Davies for non-tornado and tornado cases to observations in this event :
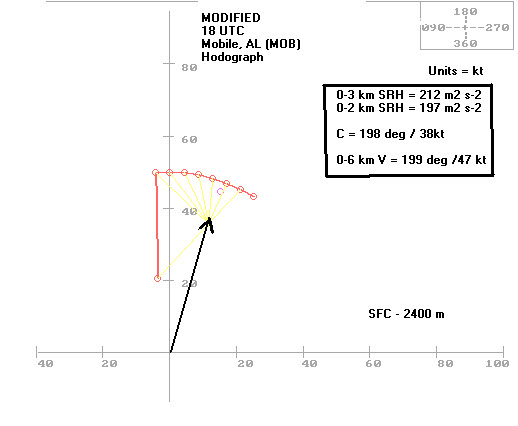
Note that the observed 13 October 2001 values exceed the mean tendency (and their respective extremes) for F2-F5 tornado events to have relatively higher 0-3 km CAPE values, very small CINH values and relatively low LFC height. Hodographs were generated for 12, 15 and 18 UTC using a combination of KMOB WSR-88D VAD (100 ft or ~ 308m) winds and surface observations. The table below yields information on the evolution of the vertical wind shear profile over the area where tornadoes occurred during the six hour period. It is important to note that these data were obtained within 40 km of actual tornado occurrence.
It was previously alluded to that most of the contribution to horizontal vorticity production came from vertical wind shear produced in the 0-1.5 km layer. In the table below, note that the 0-2 km SRH accounts for ~90% of the total 0-3 km SRH. Further, it is inferred from the three-hourly hodographs (also see radar images) that new cell growth is occurring on the south-southeast flanks of mature updrafts (see storm-relative inflow vector directions on three-hourly hodographs). Observed storm motion vectors had a tendency to veer (176 to 198 degrees) and strengthen (21 to 38 kt) between 12-18 UTC. Given the hodograph orientation (as described by connecting individual layer vertical wind shear vectors), it is also seen that higher magnitude northerly storm motion vectors would have limited helical area on the hodograph (physically causing the gust front on the storm south-southeast flank to be less effective at initiating new cell growth). |
Summary and Conclusions
|
The greatest contribution to horizontal vorticity production (and corresponding helical area) was found within the lowest 1.5 km. Hourly storm motion vectors veered from 176-198° and strengthened (11-20 m s-1) between 12-18 UTC. The presence of increased 0-3 km CAPE (~289 J kg-1) at updraft low-levels (0-3 km) along with relatively strong ambient vertical wind shear likely aided the development of additional lifting forces which potentially set this event apart from past similar, but non-tornadic events. |

