|
East Central Florida Operational Lightning Threat Graphics
|
|
Current operational Lightning Threat graphics for East Central Florida are available from NWS Melbourne's graphical Hazardous Weather Outlook.
These Lightning Threat Graphics were developed from a 16 year climatology (1989-2004) of cloud to ground lightning density and frequency data based on seven low-level wind flow regimes during the Florida warm season (May-Sep.). The flash density and flash frequency data were incorporated into climatological lightning 'first guess' lightning threat fields for each defined low level wind regime. National Weather Service meteorologists use these lightning threat fields as a starting point to produce a daily lightning threat map for East Central Florida during the warm season. High resolution local mesoscale models depicting thermodynamic parameters and showing explicit movement of sea breeze boundaries will further enable forecasters to refine the lightning threat.
Click here to see the current operational Lightning Threat Forecast for Today and Tonight.
The climatological Lightning Threat for each wind flow regime is shown below, along with frequency and flash density grids that were incorporated to develop the Lightning Threat. These Lightning Threat graphics are purely based on the climatologies for each regime but can provide useful information on the amount and spatial distribution of cloud to ground lightning strikes.
|

|
|
|
|
|

|
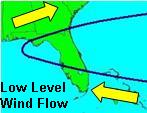
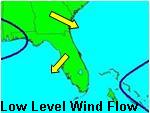
Regime: Ridge North of Florida
This flow regime is characterized by easterly to east-southeast flow in the 1000-700mb layer across East Central Florida. The threat for lightning activity is maximized along the Florida west coast in the mid to late afternoon and early evening.
|
|
|
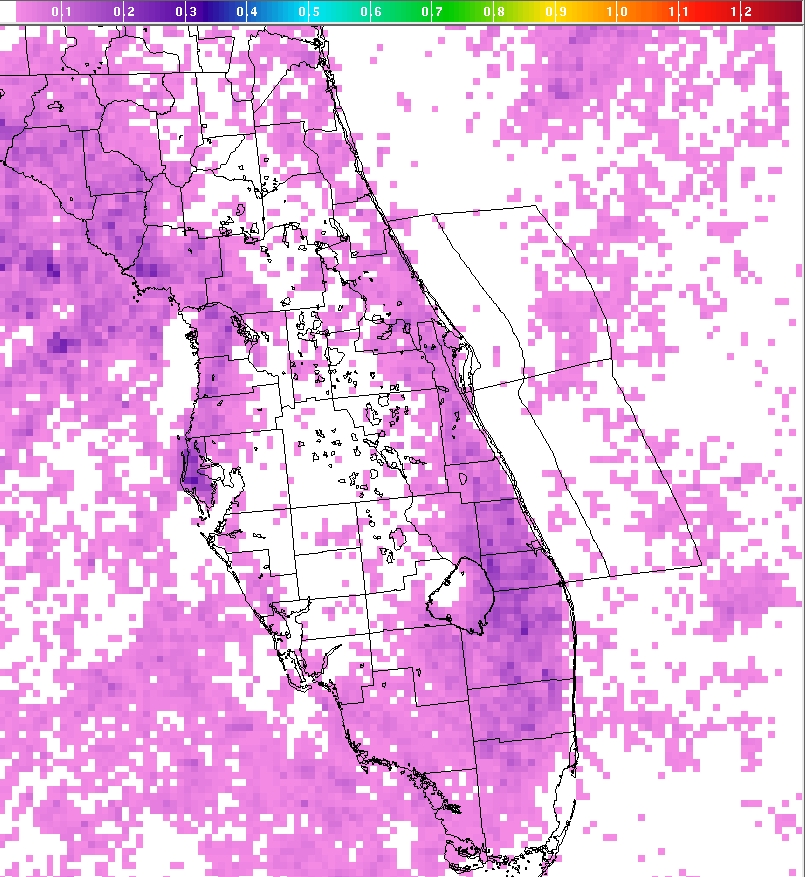
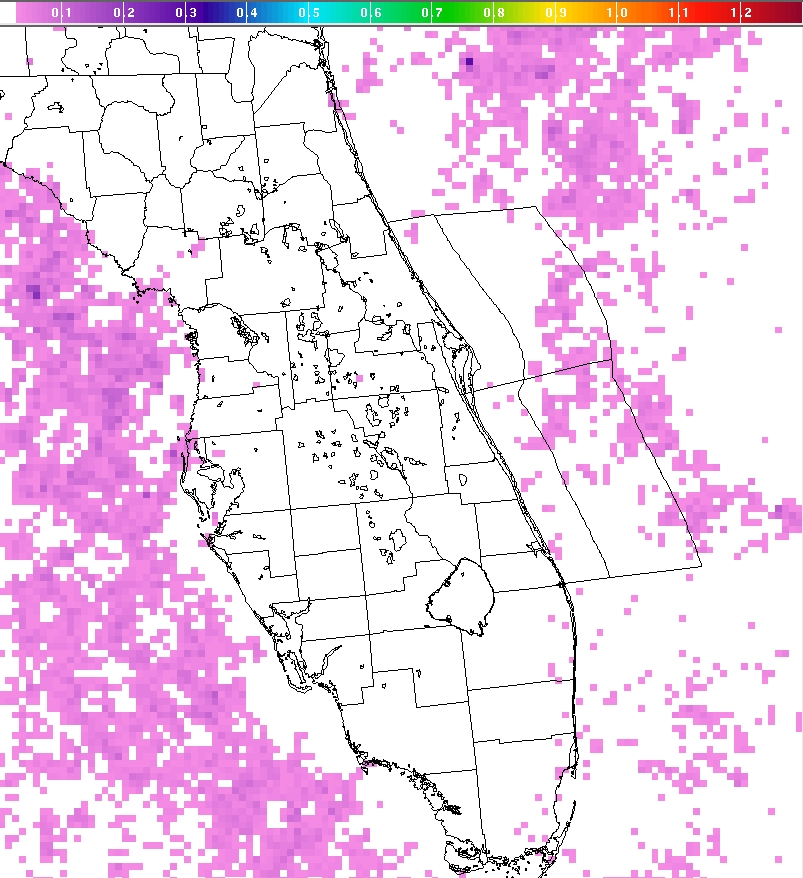
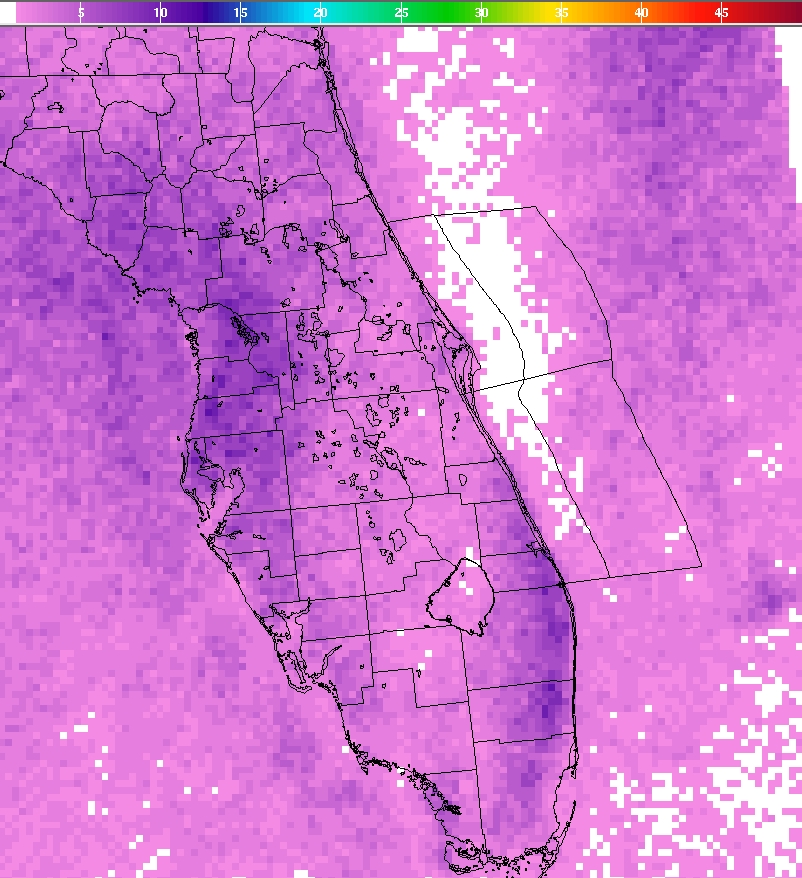
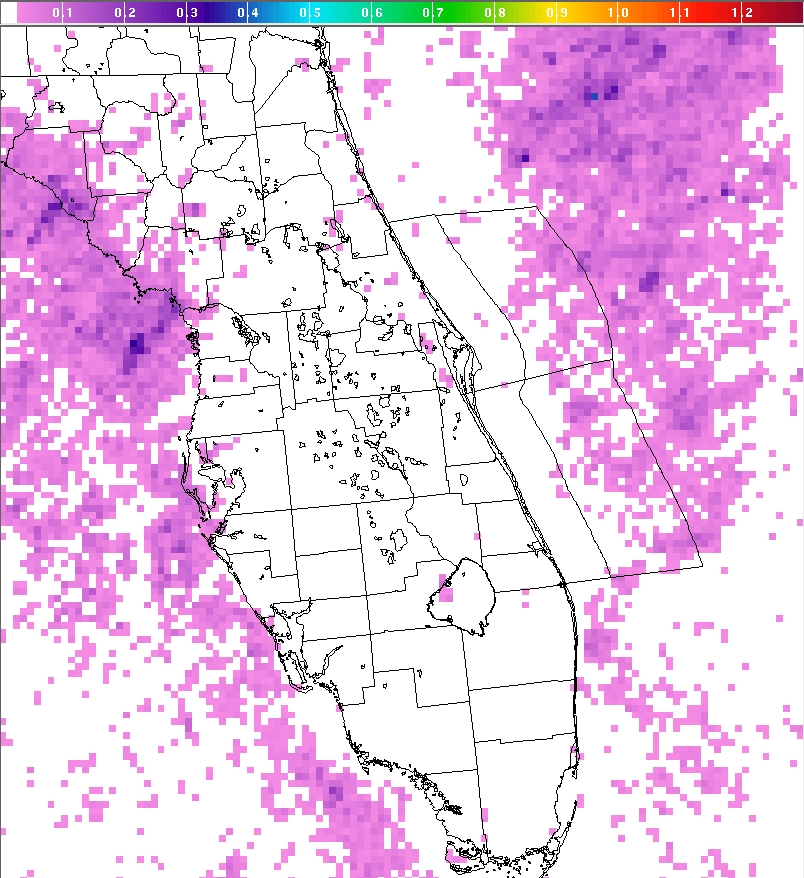
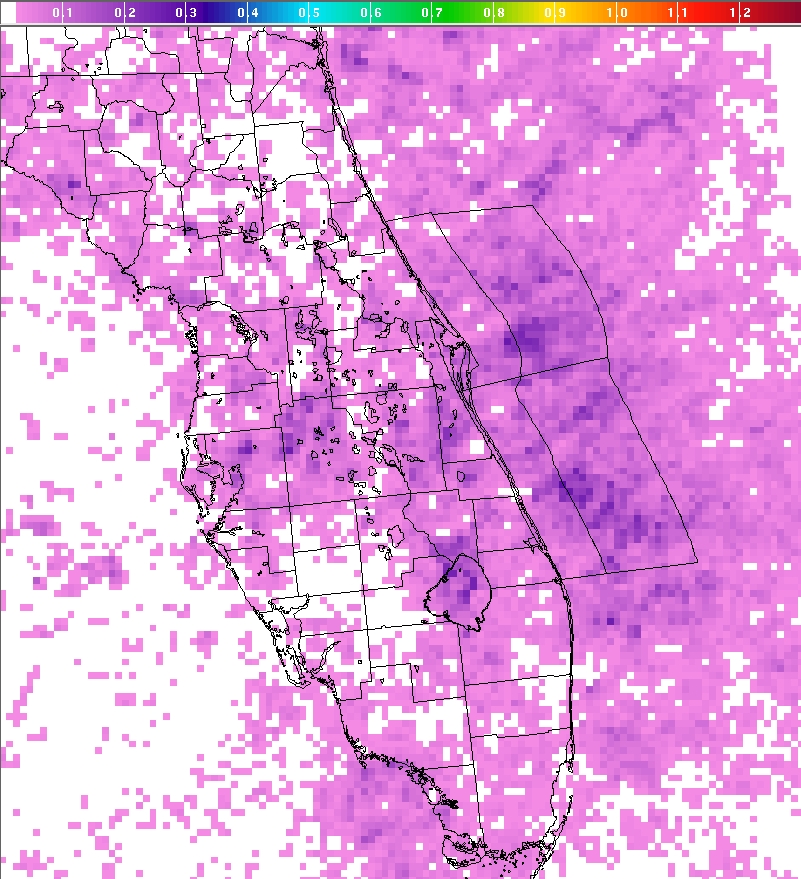
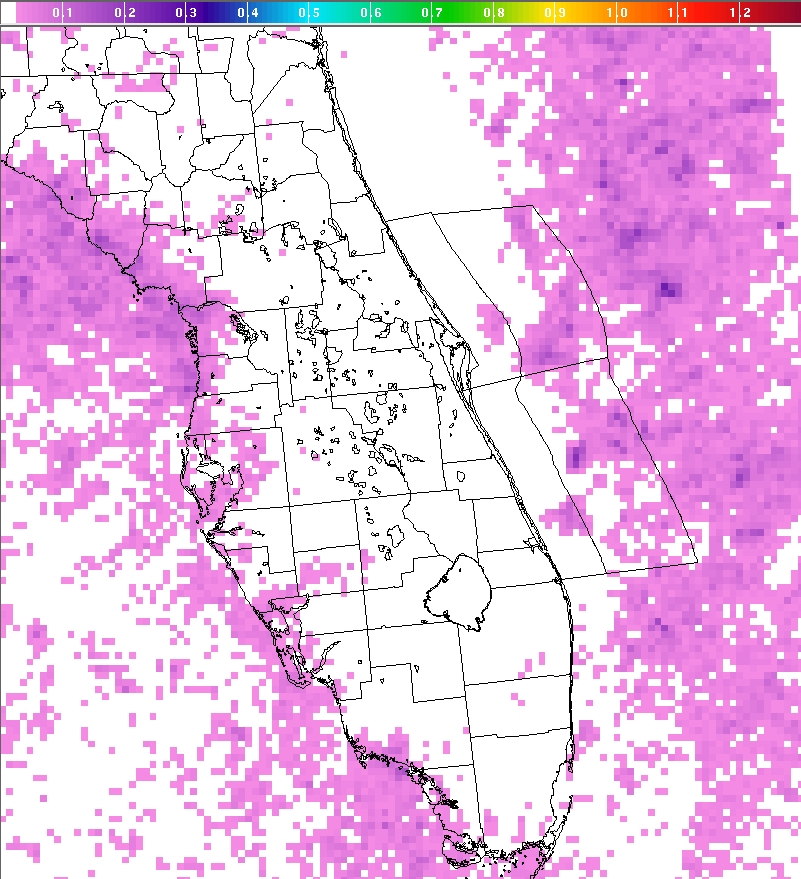
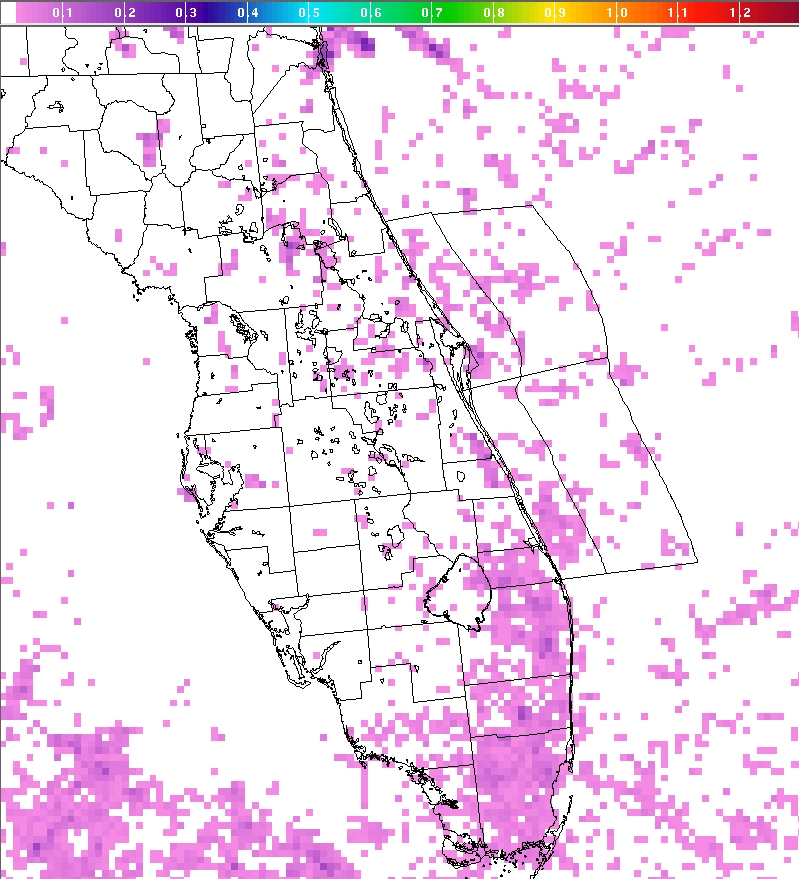
The Climatological Lightning Threat from 2 pm to 8 pm is shown based on lightning probability and strike density. The images to the left of the lightning threat show climatological lightning probability (top row) and climatological strike density per flow regime day (bottom row) in 6 hour intervals. The images from left to right are valid: 8am to 2pm, 2pm to 8pm, 8pm to 2am, and 2am to 8am. |
|
|
|
|
|
Regime: Ridge between Tampa and Jacksonville
This flow regime is characterized by east to southeast low level flow across the southern peninsula with lighter flow across northern peninsula near the ridge axis between Tampa and Jacksonville.
|
|
|
The Climatological Lightning Threat from 2 pm to 8 pm is shown based on lightning probability and strike density. The images to the left of the lightning threat show climatological lightning probability (top row) and climatological strike density per flow regime day (bottom row) in 6 hour intervals. The images from left to right are valid: 8am to 2pm, 2pm to 8pm, 8pm to 2am, and 2am to 8am. |
|
|
|
|
|

|
Regime: Ridge between Tampa and Miami
This flow regime is characterized by low level southwest flow across much of East Central Florida. Lightning Threat is maximized across much of East Central Florida in the afternoon and evening.
|
|
|
The Climatological Lightning Threat from 2 pm to 8 pm is shown based on lightning probability and strike density. The images to the left of the lightning threat show climatological lightning probability (top row) and climatological strike density per flow regime day (bottom row) in 6 hour intervals. The images from left to right are valid: 8am to 2pm, 2pm to 8pm, 8pm to 2am, and 2am to 8am. |
|
|
|
|

|
Regime: Ridge South of Florida
This flow regime is characterized by westerly flow across the Florida peninsula. Lightning Threat is typically maximized in the late afternoon and early evening across the coastal counties along the east coast.
|
|
|
The Climatological Lightning Threat from 2 pm to 8 pm is shown based on lightning probability and strike density. The images to the left of the lightning threat show climatological lightning probability (top row) and climatological strike density per flow regime day (bottom row) in 6 hour intervals. The images from left to right are valid: 8am to 2pm, 2pm to 8pm, 8pm to 2am, and 2am to 8am. |
|
|
|
|

|
Regime: Peninsula Northwest Flow
This flow regime is characterized by afternoon lightning activity concentrated across the eastern side of the Florida peninsula.
|

|
The Climatological Lightning Threat from 2 pm to 8 pm is shown based on lightning probability and strike density. The images to the left of the lightning threat show climatological lightning probability (top row) and climatological strike density per flow regime day (bottom row) in 6 hour intervals. The images from left to right are valid: 8am to 2pm, 2pm to 8pm, 8pm to 2am, and 2am to 8am.
|
|
|
|
|
|

|
Regime: Peninsula Northeast Flow
This flow regime is noted for the least amount of lightning activity over the Florida Peninsula. During the late afternoon and evening hours the threat for lightning is typically limited to Southwest Florida.
|
|
|
The Climatological Lightning Threat from 2 pm to 8 pm is shown based on lightning probability and strike density. The images to the left of the lightning threat show climatological lightning probability (top row) and climatological strike density per flow regime day (bottom row) in 6 hour intervals. The images from left to right are valid: 8am to 2pm, 2pm to 8pm, 8pm to 2am, and 2am to 8am. |
|
|
|
|
|
|
Regime: Ridge over Florida Panhandle
This flow regime is characterized a weak ridge across the Florida panhandle with lightning activity mainly concentrated across the west coast and northern and central interior sections associated with the east coast sea breeze.
|
|
|
The Climatological Lightning Threat from 2 pm to 8 pm is shown based on lightning probability and strike density. The images to the left of the lightning threat show climatological lightning probability (top row) and climatological strike density per flow regime day (bottom row) in 6 hour intervals. The images from left to right are valid: 8am to 2pm, 2pm to 8pm, 8pm to 2am, and 2am to 8am. |
|
|
|
Lightning Page created by: Matt Volkmer, matthew.volkmer@noaa.gov
Lightning questions?: Melissa Watson, melissa.watson@noaa.gov
|