| Florida ENSO Education Info |
El Nino Southern Oscillation (ENSO) and Florida Dry Season "Storminess"
Bart Hagemeyer
NWS Melbourne, Florida
"Storminess" in the Florida dry season can simply be described as the frequency of passage of extratropical cyclones or low pressure systems. Hagemeyer (2000) contains details on the development of an index of storminess for the Florida dry season. What follows is a simple qualitative discussion of the concept of storminess and the development of the index to measure dry season storminess for the purpose of experimental forecasting from the ENSO signal.

The image above illustrates an extremely "stormy" period as measured by centers of vertical motion associated with a series of alternating high pressure (red) and low pressure centers (blue) existing at 00 UTC on February 2nd 1998, during an extreme El Nino event. Five low pressure centers, or extratropical cyclones, extend from the western Pacific Ocean to the Gulf of America to Spain. As discussed in the ENSO/Florida Climate background page, this very active, southern storm track can occur during extreme El Nino events. In this case, a person in Florida would experience the passage of a relatively strong low pressure center every three days or so, an extreme level of storminess.

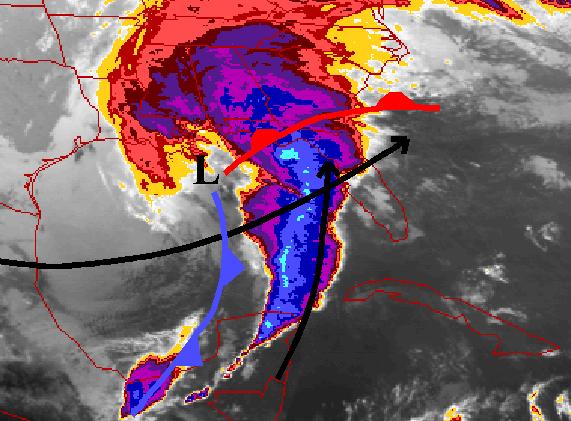
The image above is a conceptual synoptic model of a strong extratropical cyclone moving through the Gulf of America and producing severe weather in Florida. The satellite image of the infamous March 1993 "Superstorm" below illustrates what is perhaps the most extreme example of this type of event. Strong extratropical cyclones can produce excessive rainfall, severe thunderstorm winds,tornadoes, damaging straight line gradient winds, dangerous marine conditions, coastal flooding and beach erosion, and even, in very rare circumstances, deadly storm surge (as in the case of the "Superstorm").
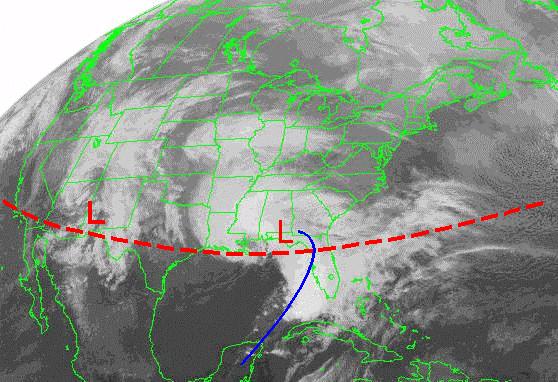
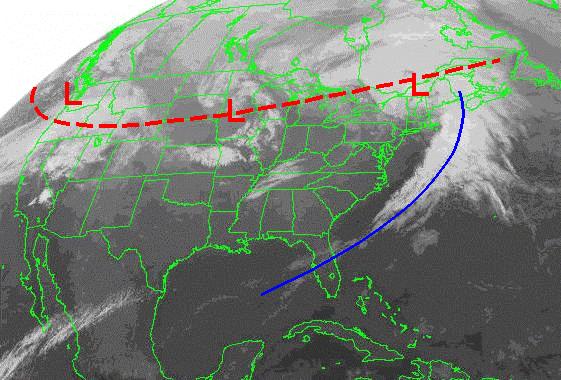
The satellite photo below shows a particularly active period in February 1998 during strong El Nino conditions, when the mean storm track was across the Gulf of America. These "southern" cyclones are much more likely to produce heavy rain, severe weather, and hazardous marine conditions in Florida. In contrast, the satellite photo for February 1999 during strong La Nina conditions illustrates the typically northern storm track with individual cyclones moving across the northern tier of the United States. In these cases the cold front passages across Florida lack "punch" and are often "dry", bringing a brief period of cloudiness and showers at best, followed by low relative humidity and windy conditions. In this La Nina example, the cold front trailing from the cyclone over New England brought only a period of cloudiness to Florida and ushered in cooler and drier air. Under this scenario drought and wildfire are much more likely to be a problem during Florida’s dry season.
Strong El Nino Storm Track
Strong La Nina Storm Track
Predictability and Accuracy for Decision Makers
Modeling and Defining Storminess
For Florida, the mean storm track, controlled largely by the jet stream and the strength and frequency of passage of extratropical cyclones are factors determining storminess. As mentioned in the ENSO background section, it is now accepted that strong El Nino’s and La Nina’s have a significant impact on the mean storm track.
To measure storminess one could simply count the passage of extratropical (ET) cyclones, but one must also define a strength threshold for counting storms based on expected impact. The figure below illustrates the conceptual model for a "storm" passage over Florida. The singular characteristic of the passage of an ET cyclone is a minima in mean sea level pressure (MSLP) in the Florida grid.
In this figure mean daily MSLP is plotted against time. Typically as an ET cyclone approaches and strengthens, low-level moisture spreads northward over Florida in the warm sector ahead of the cyclone as a low level jet and an enhanced area of upward vertical motion (blue time line over day 2 and 3) develops. This often leads to the development of a prefrontal squall line (see "Superstorm" satellite photo above). Heavy rainfall and hazardous weather generally occur for the several days it takes the typical ET cyclone to pass fully through the Florida grid. In the wake of the ET cyclone the jet stream and 500 mb heights reach their most extreme levels (blue time line day 4-6).
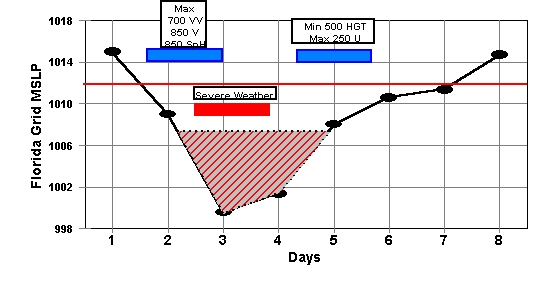
An ET cyclone is the sum of many parts and such measures as 850 mb wind and specific humidity, 700 mb vertical velocity, or 500 mb height and 250 mb wind speed could be used to represent storminess, but MSLP is the best variable to define storminess and the one with the most relevance to potential users of the information.
The figure below is an analysis of MSLP for 00 UTC 3 February 1998 and illustrates a strong ET cyclone moving over the Florida Grid (green rectangle). The passage of this cyclone would be characterized as one storm in a season. It is important to realize that the minimum MSLP assigned to a particular storm is not the lowest pressure in the center of the storm, but the lowest pressure averaged over the Florida grid. This measure of storminess is more conservative than a method where the minimum MSLP attained by each cyclone was documented as representative of the cyclone. The method used here is considered more reliable for use in multiple linear regression statistical techniques relating to the Florida region as it is a more objective and easily obtainable measure.

The next step was to define a strength threshold. The image below is a frequency distribution of all 7,421 of the dry season daily observations of MSLP for the Florida grid from 1958 to 1999. Intuitively, one would expect that the lower the MSLP of an ET cyclone passing over the Florida grid, the greater the destructive potential - and this is generally what is found. A study of Storm Data since 1980 shows that 80% of significant hazardous weather - F2 Tornadoes or any deaths during the Florida dry season have occurred with daily MSLP less than 1012 mbs (averaged over the Florida grid). Additionally it was found that virtually anytime the grid average MSLP was 1010 mbs or lower, significant hazardous weather occurred. These 1012 and 1010 mb thresholds were chosen to represent a "storm" and a "significant storm" in the Florida grid respectively.

- a Dynamic measure of Inter- and Intra-Seasonal Variability
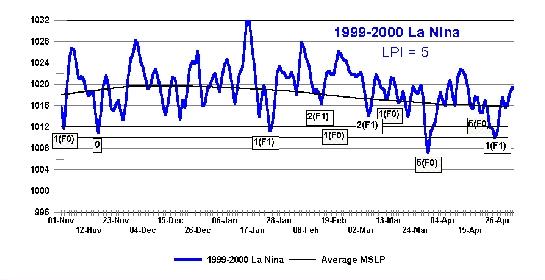
In the image below the mean daily MSLP from November 1 1997 to April 30th 1998 is plotted, and then every minima below 1012 is counted as one storm and every minima below 1010 mbs is counted as a significant storm in the Florida grid. This was done for every dry season from 1958 through the 1999-2000 dry season. In the case of the 97-98 dry season under extreme El Nino conditions, an extreme level of seasonal storminess is readily apparent with 17 1012 mb storms and 14 1010 mb storms, respectively.

In contrast, the calculated storminess for the 1999-2000 dry season during strong La Nina conditions indicates 5 1012 mb storms and only two 1010 mb storms.
Multiple linear regression with ENSO was done on Florida dry season storminess at the 1012 and 1010 mb thresholds, on the dry season jet stream anomaly, and mean dry season MSLP. All showed skill, but the 1012 mb storminess was found to be the best overall measure of a dry season.To assist potential users in evaluating the experimental dry season forecasts, charts of seasonal storminess predictions plotted against actual storminess are presented on the left hand side of the table below. These charts are useful for getting a feel for season- to-season variability, and a general sense of the accuracy of seasonal predictions, but they are difficult to use quantitatively. A better method of looking at the storminess predictions is to use Taylor-Russell Diagrams as explained in:
Pielke, R. A. Jr., et al, 2000: Prediction - Science, Decision Making, and the Future of Nature. Island Press. 405 pages. ISBN 1-55963-776-5.
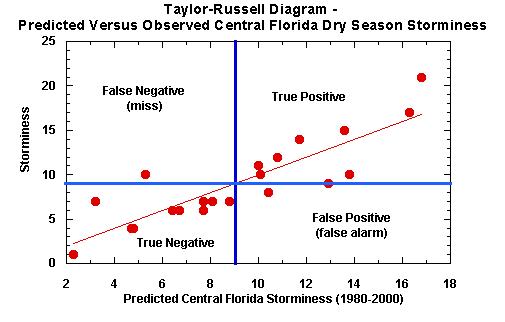
Taylor-Russell Diagrams: The scatterplot charts in the right-hand column of the table below show predicted dry season storminess (x-axis) versus observed dry season storminess (y-axis) for the Florida region from the 1960-2000 and 1980-2000 equations. These charts are designed to depict the uncertainty in the experimental predictions and assist in the decision making process. The horizontal line across the chart represents a boundary between situations requiring action, which are above the line, and situations requiring no action, which are below the line. This line is called the criterion. If the actual event exceeds the criterion, then some sort of preventative or protection action is required. The vertical line on the chart is the decision cutoff. Because decision makers cannot wait for an event to occur to take action, decisions must be made based on a prediction. It has been recognized that this type of chart can apply to almost any policy problem where decisions must be made in the face of uncertainty.
The two lines on the Taylor-Russell diagrams divide the scatterplot into four regions. The regions are labeled according to standard decision research terminology:
-True Positive: Appropriate action is taken. For example, people are warned of severe weather, and it actually occurs.
- False Positive: Inappropriate action is taken. This is often called false alarm. For example, people are warned of severe weather, but none occurs.
- False Negative: Action should have been taken but wasn't. For example, people were not warned of severe weather, but severe weather occurs.
-True Negative: No action was taken, and that was appropriate. For example, no warning was issued, and the storm did not become severe.
On these Taylor-Russell diagrams the criterion and decision cutoffs have been set at normal seasonal storminess and a line representing the theoretical perfect forecast equation has been added. Thus these diagrams reflect the uncertainty of above or below normal dry season storminess from the experimental forecasts. Individual users could set these thresholds to whatever criteria was important to their particular issue.
| Comparison of Predicted and Observed Storminess | Taylor-Russell Diagrams |
|
Florida Region 1960-2000 |
|
|
Central Florida 1960-2000 |
Central Florida 1960-2000 |
| Florida Region 1980-2000 | Florida Region 1980-2000 |
|
Selected References
Florida region seasonal forecast development: Bart Hagemeyer.
last updated 08/10/10
Hagemeyer, B. C., 2000:Development of a Low Pressure Index as a Proxy for Dry Season Severe Weather in Florida and its Relationship with ENSO. Preprints, 20th Conference on Severe Local Storms, Amer. Meteor. Soc., Orlando, FL, 439-442.
Hagemeyer, B. C., 2001: Communicating experimental Florida dry season forecasts and regionalized climatic information to users via the Internet. Presented to National Weather Association 26th Annual Meeting. Spokane, WA and NOAA 26th Annual Climate Diagnostics and Prediction Workshop. San Diego, CA (10/01).
Hagemeyer, B. C., and R. A. Almeida, 2002: Experimental Forecasting of Dry Season Storminess over Florida and the Southeast United States from the ENSO Signal using Multiple Linear Regression Techniques. Preprints, 16th Conference on Probability and Statistics in the Atmospheric Sciences and 13th Symposium on Global Change and Climate Variations, Amer. Meteor. Soc., Orlando, FL, J3.10.
Hagemeyer, B.C. and R.A. Almeida, 2003: Experimental forecasting of dry season storminess over Florida from the ENSO signal: latest results and advancements, Preprints, 14th Symposium on Global Change and Climate Variations, Amer. Meteor. Soc., Long Beach, CA.
Hagemeyer, B.C., 2003: Experiments in Downscaled Seasonal Forecasting – A Review of the Impact of the 2002-03 El Niño on Florida Dry Season Storminess and Experimental Forecast Performance. Presented to the National Weather Association 28th Annual Meeting; Jacksonville, FL, (10/03).
Hagemeyer, B.C. and R.A. Almeida, 2004: Extreme Interseasonal and Intraseasonal Variability of Florida Dry Season Storminess and Rainfall and the Role of the MJO, PNA, and NAO, Preprints, 15th Symposium on Global Change and Climate Variations, Amer. Meteor. Soc., Seattle, WA, CD-ROM P7.1.
Hagemeyer, B.C. and R.A. Almeida, 2005: Towards greater understanding of inter-seasonal and multi-decadal variability and extremes of extratropical storminess in Florida, Preprints, 16th Conference on Climate Variability and Change, Amer. Meteor. Soc., San Diego, CA, CD-ROM P5.19.
Hagemeyer, B.C., 2006: ENSO, PNA and NAO Scenarios for extreme storminess, rainfall and temperature variability during the Florida dry season, Preprints, 18th Conference on Climate Variability and Change, Amer. Meteor. Soc., Atlanta, GA, CD -ROM P2.4.
Hagemeyer, B.C., 2007: The relationship between ENSO, PNA, and AO/NAO and extreme storminess, rainfall, and temperature variability during the Florida dry season: thoughts on predictability and attribution, Preprints, 19th Conference on Climate Variability and Change, Amer. Meteor. Soc., San Antonio, TX, CD-ROM JP2.16.