Melbourne, FL
Weather Forecast Office
Updated Twice Daily:
11:00 AM (EDT) | 10:00 PM (EST)
4:00 PM (EDT) | 3:00 PM (EST)
Data displayed is considered preliminary. Contact sr-mlb.webmaster@noaa.gov with questions.
|
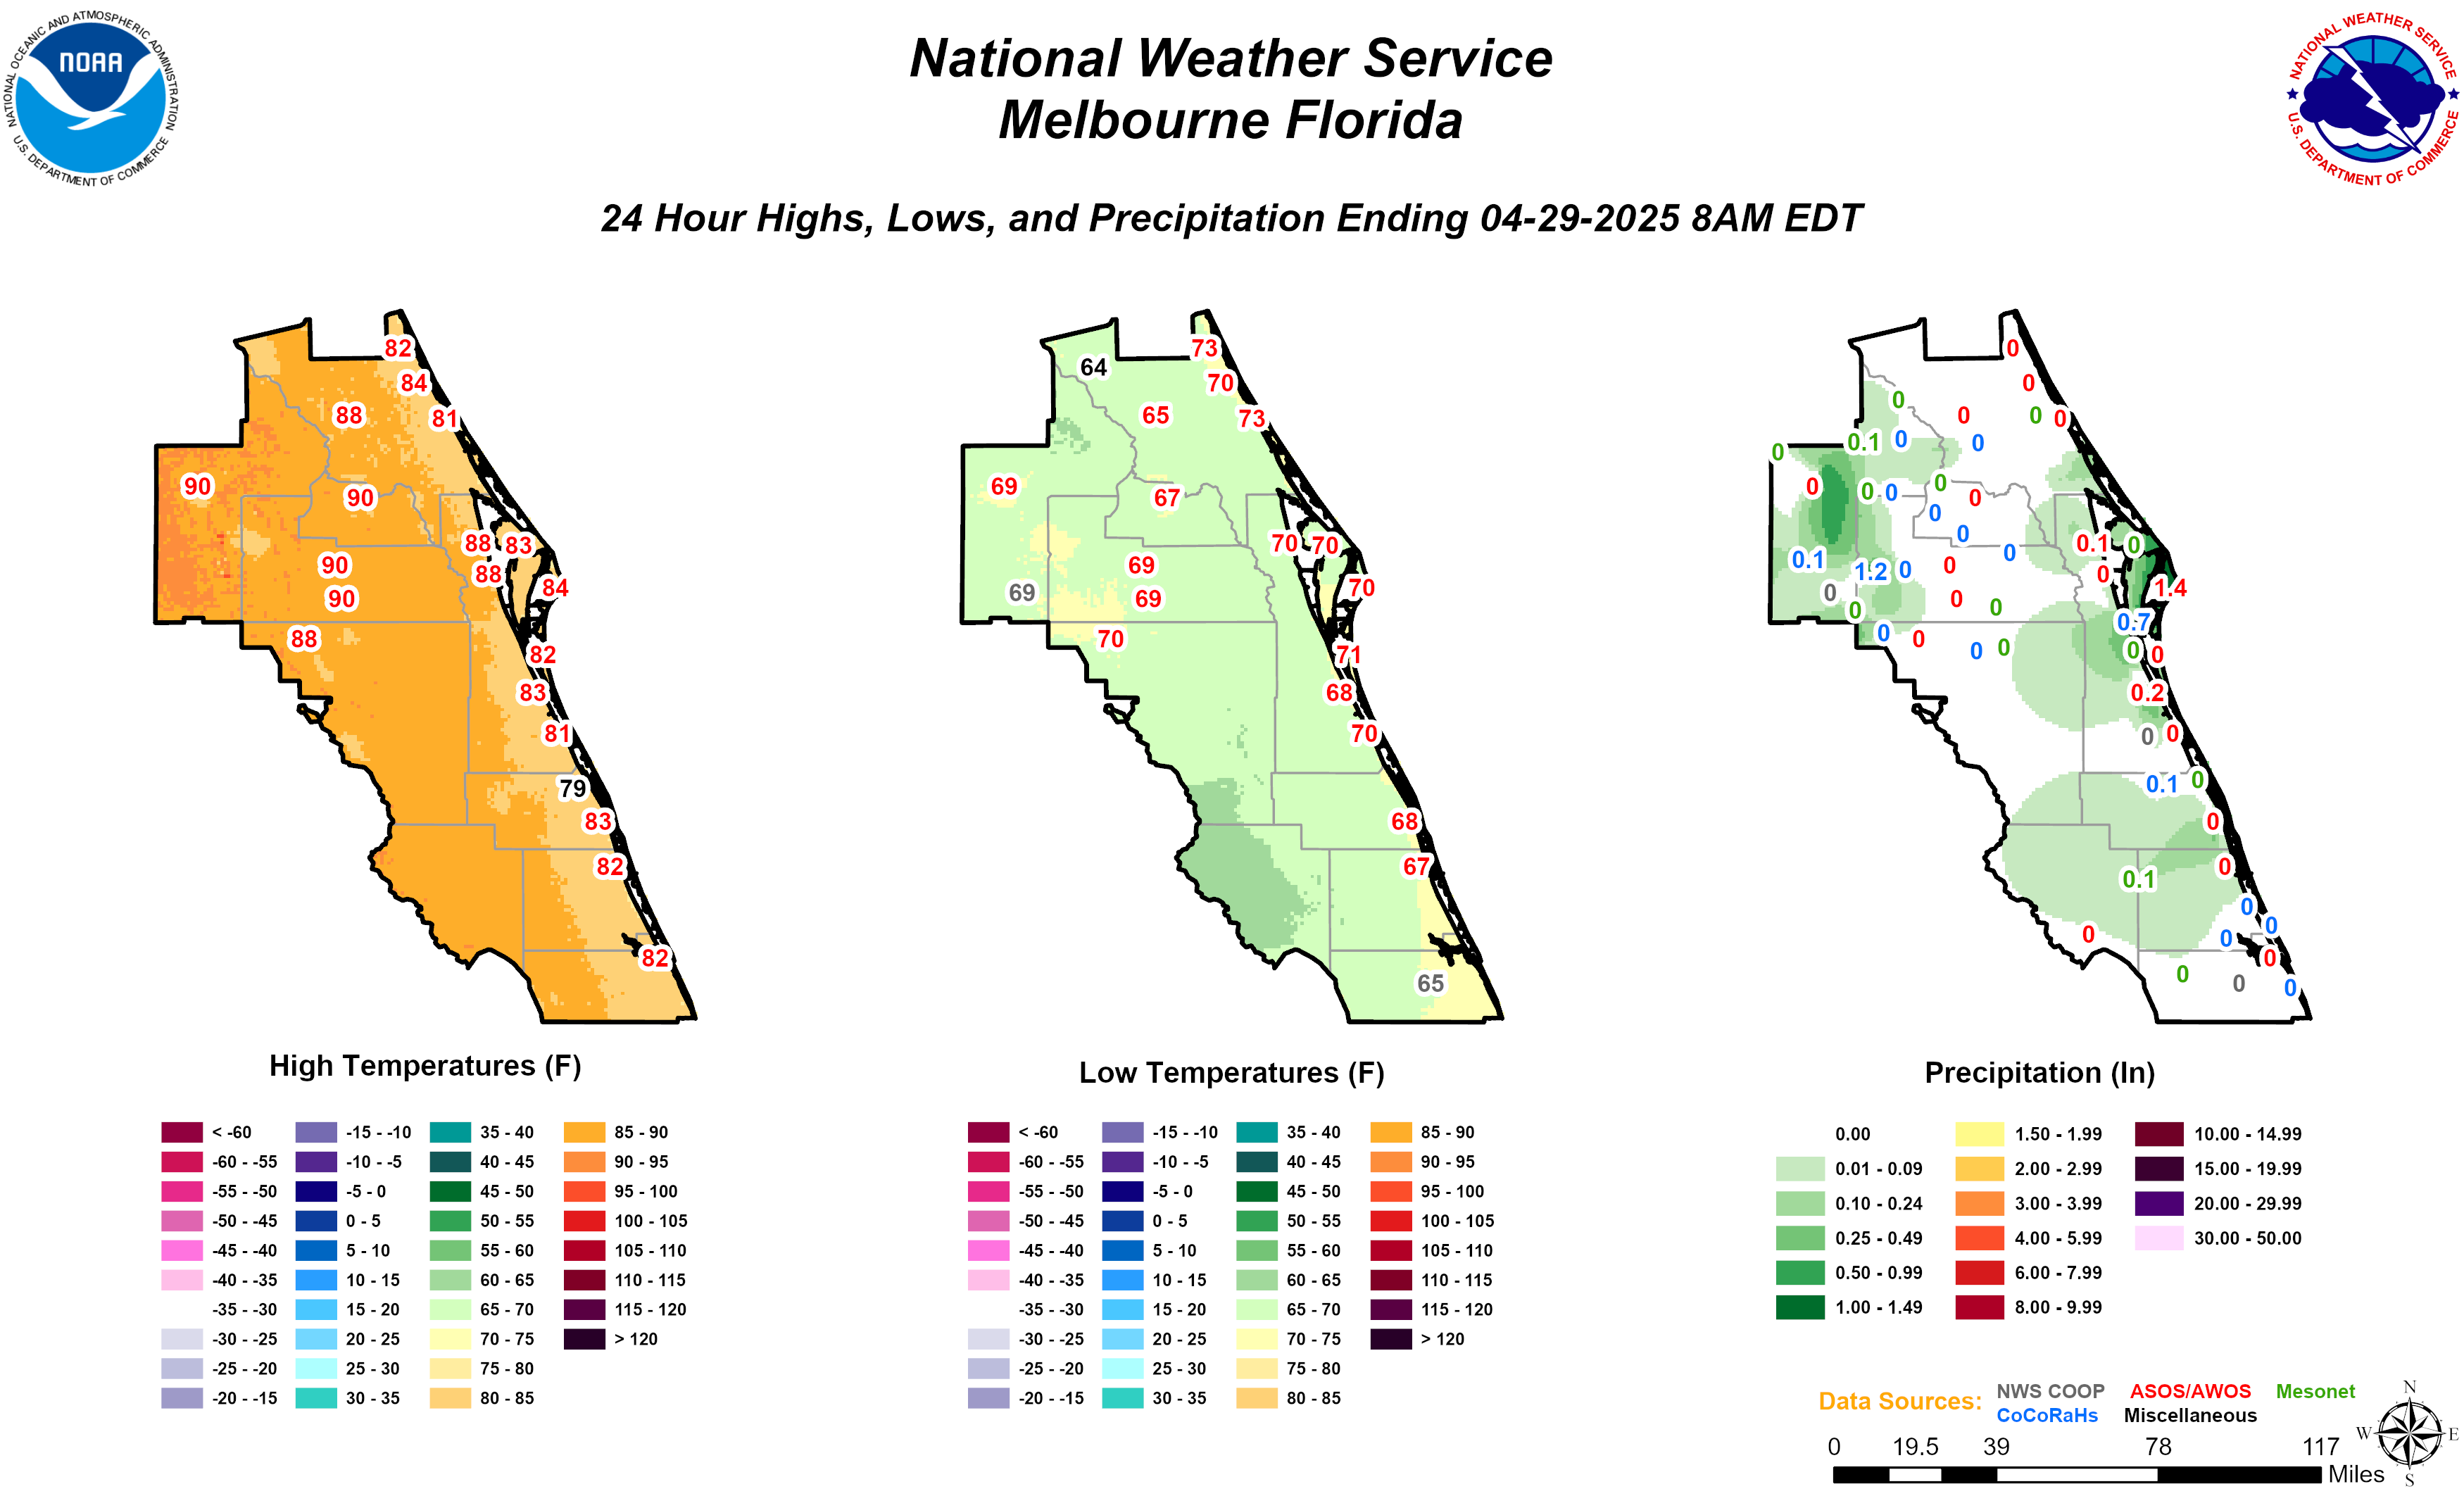
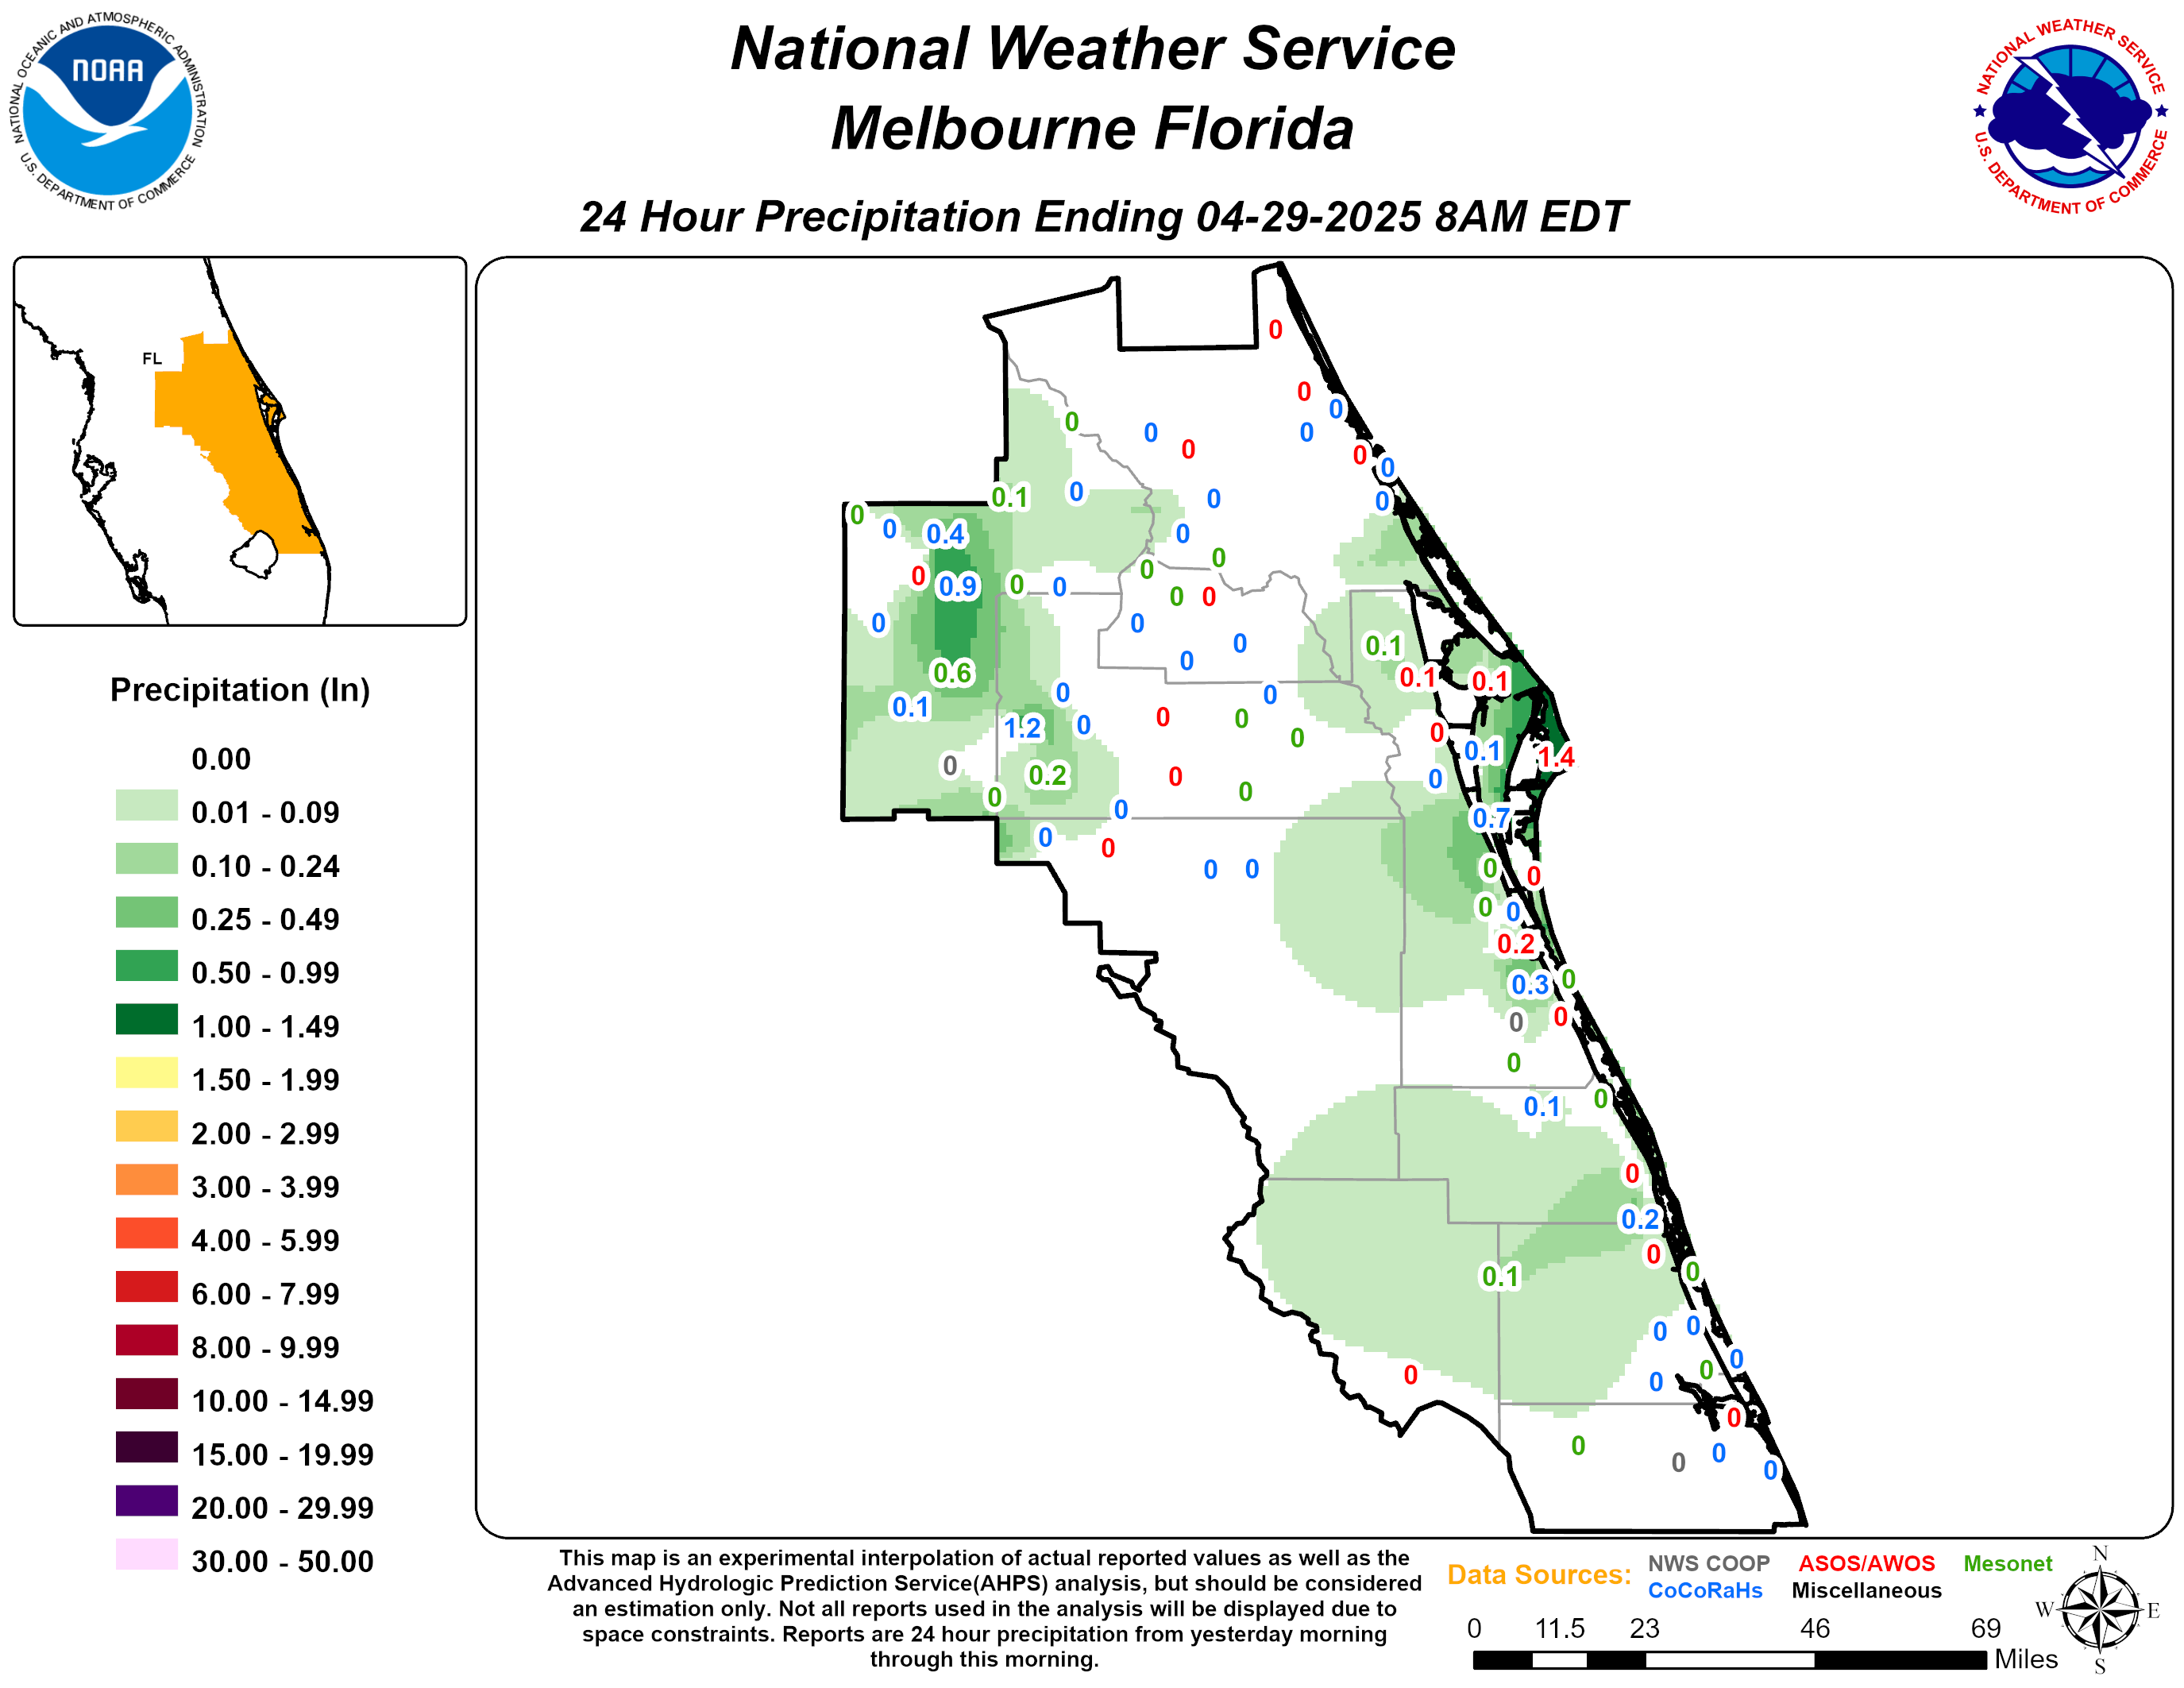
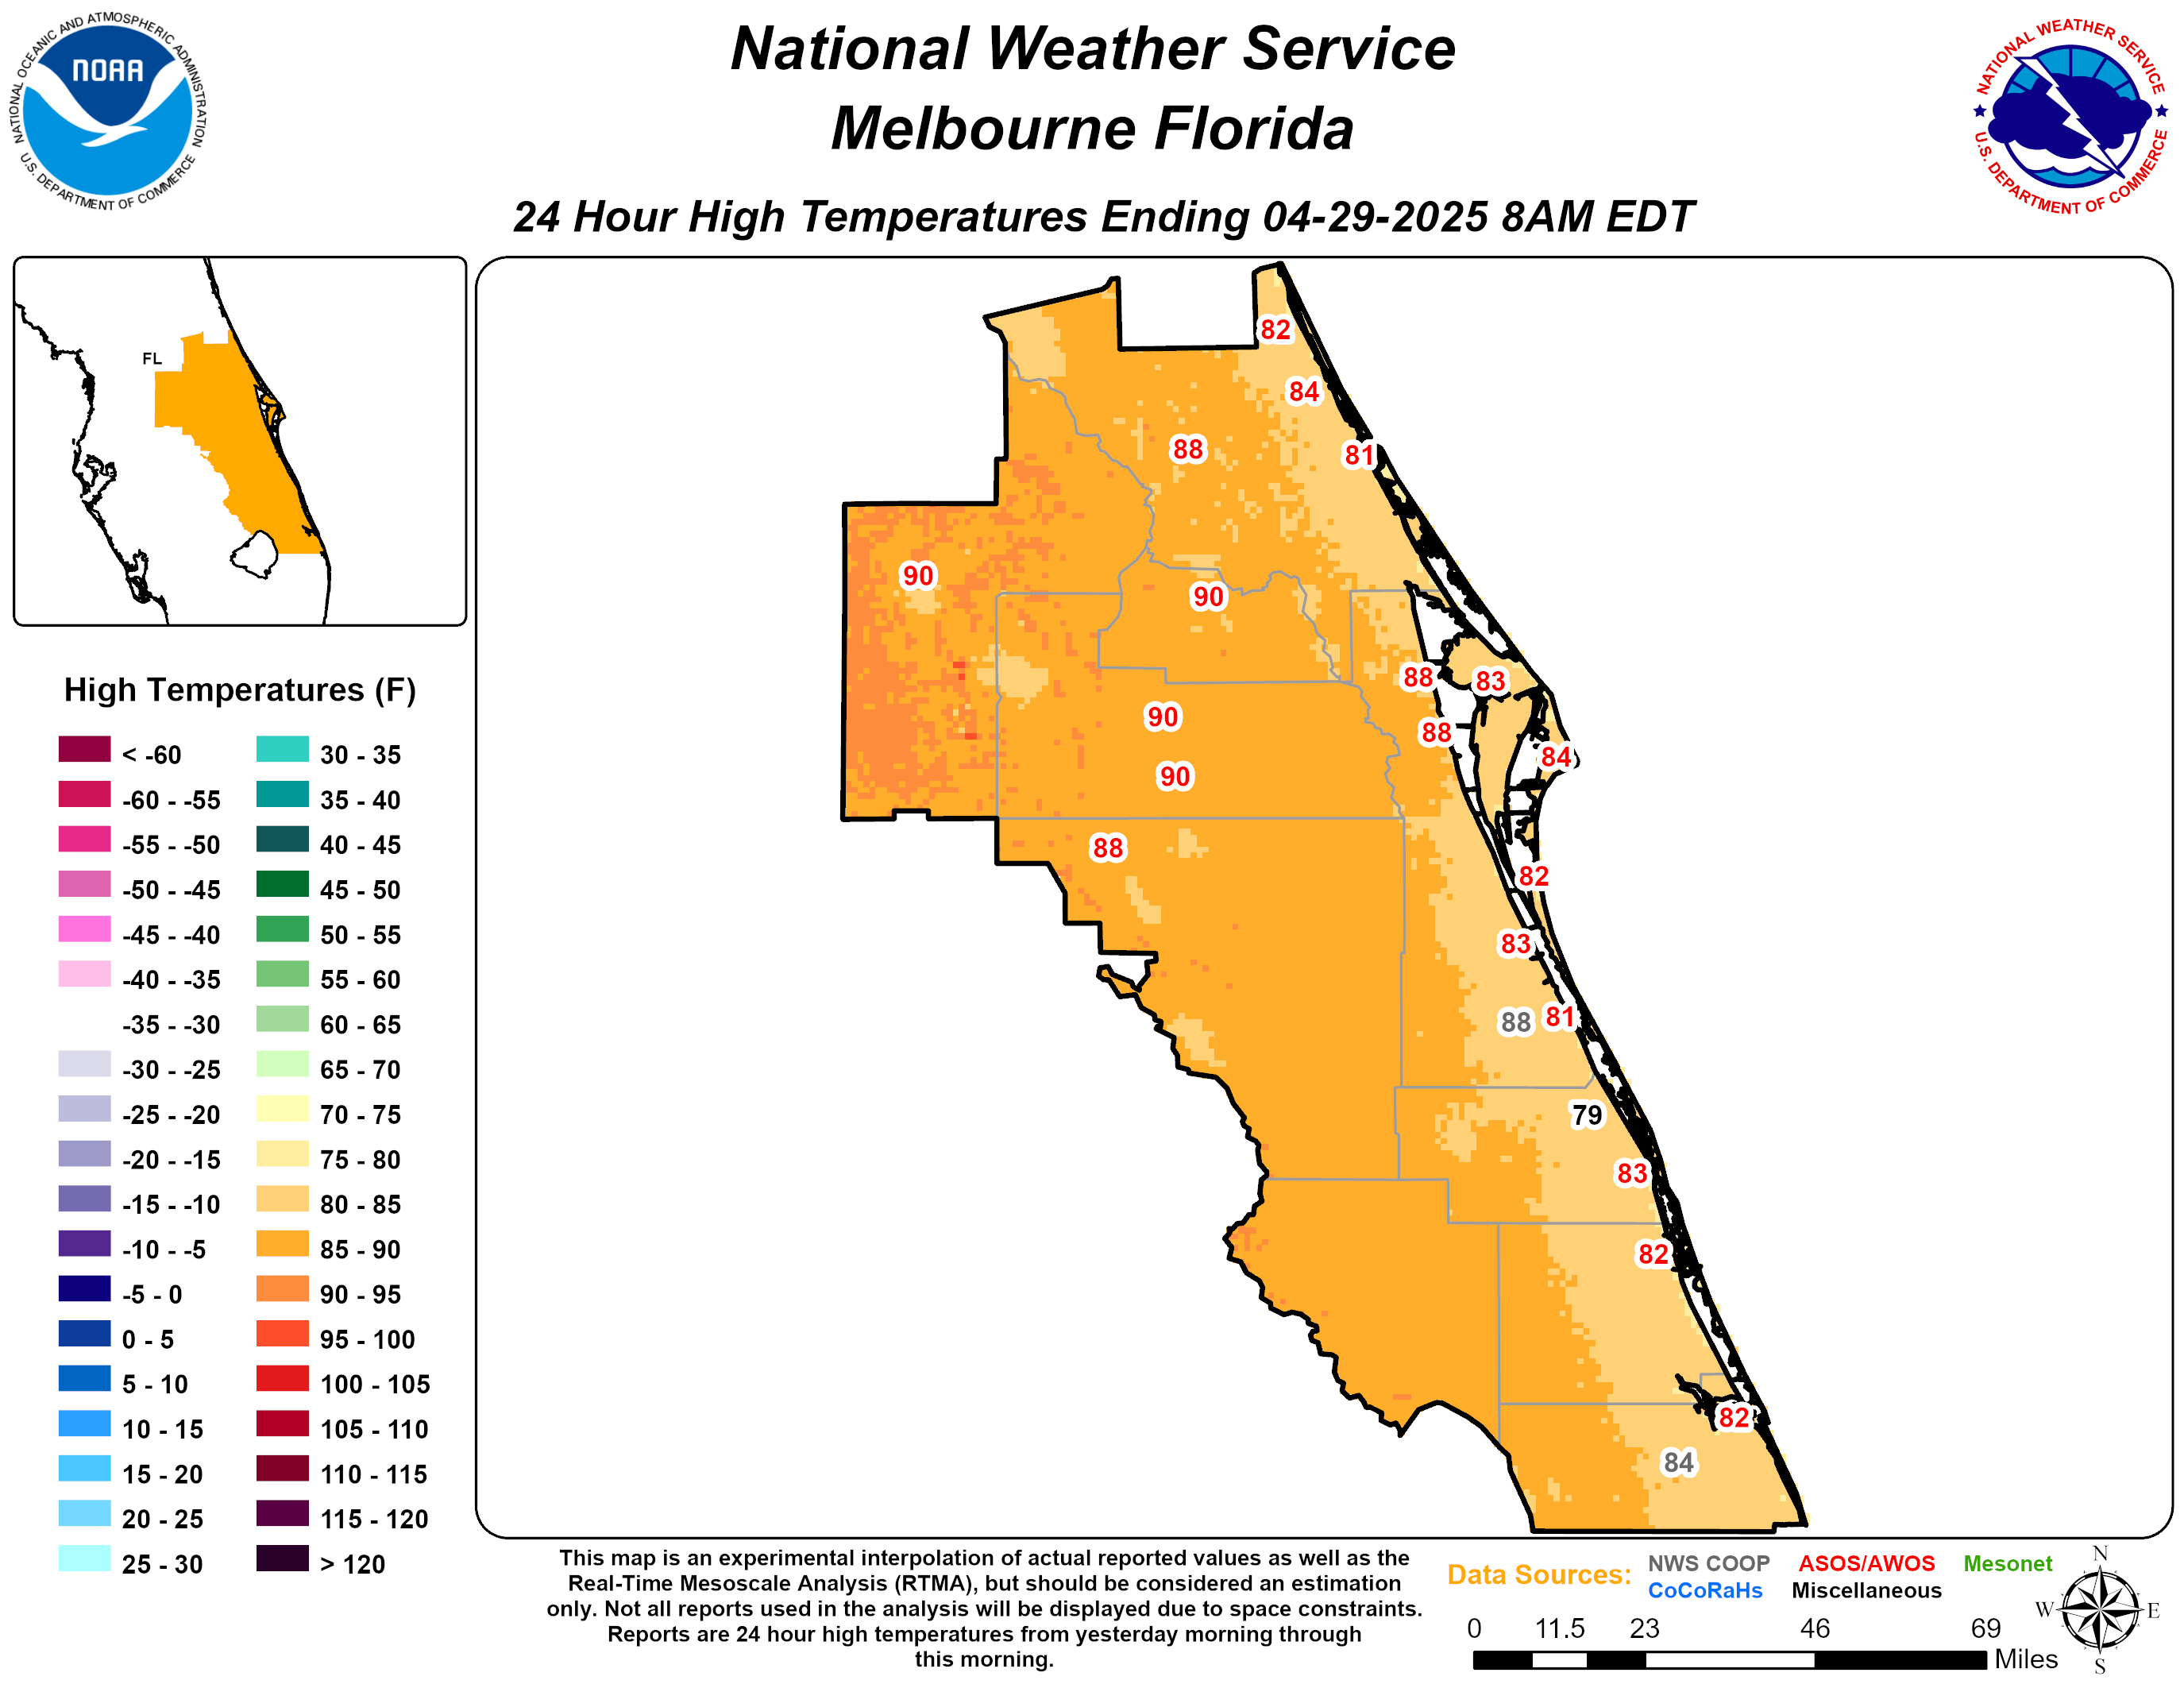
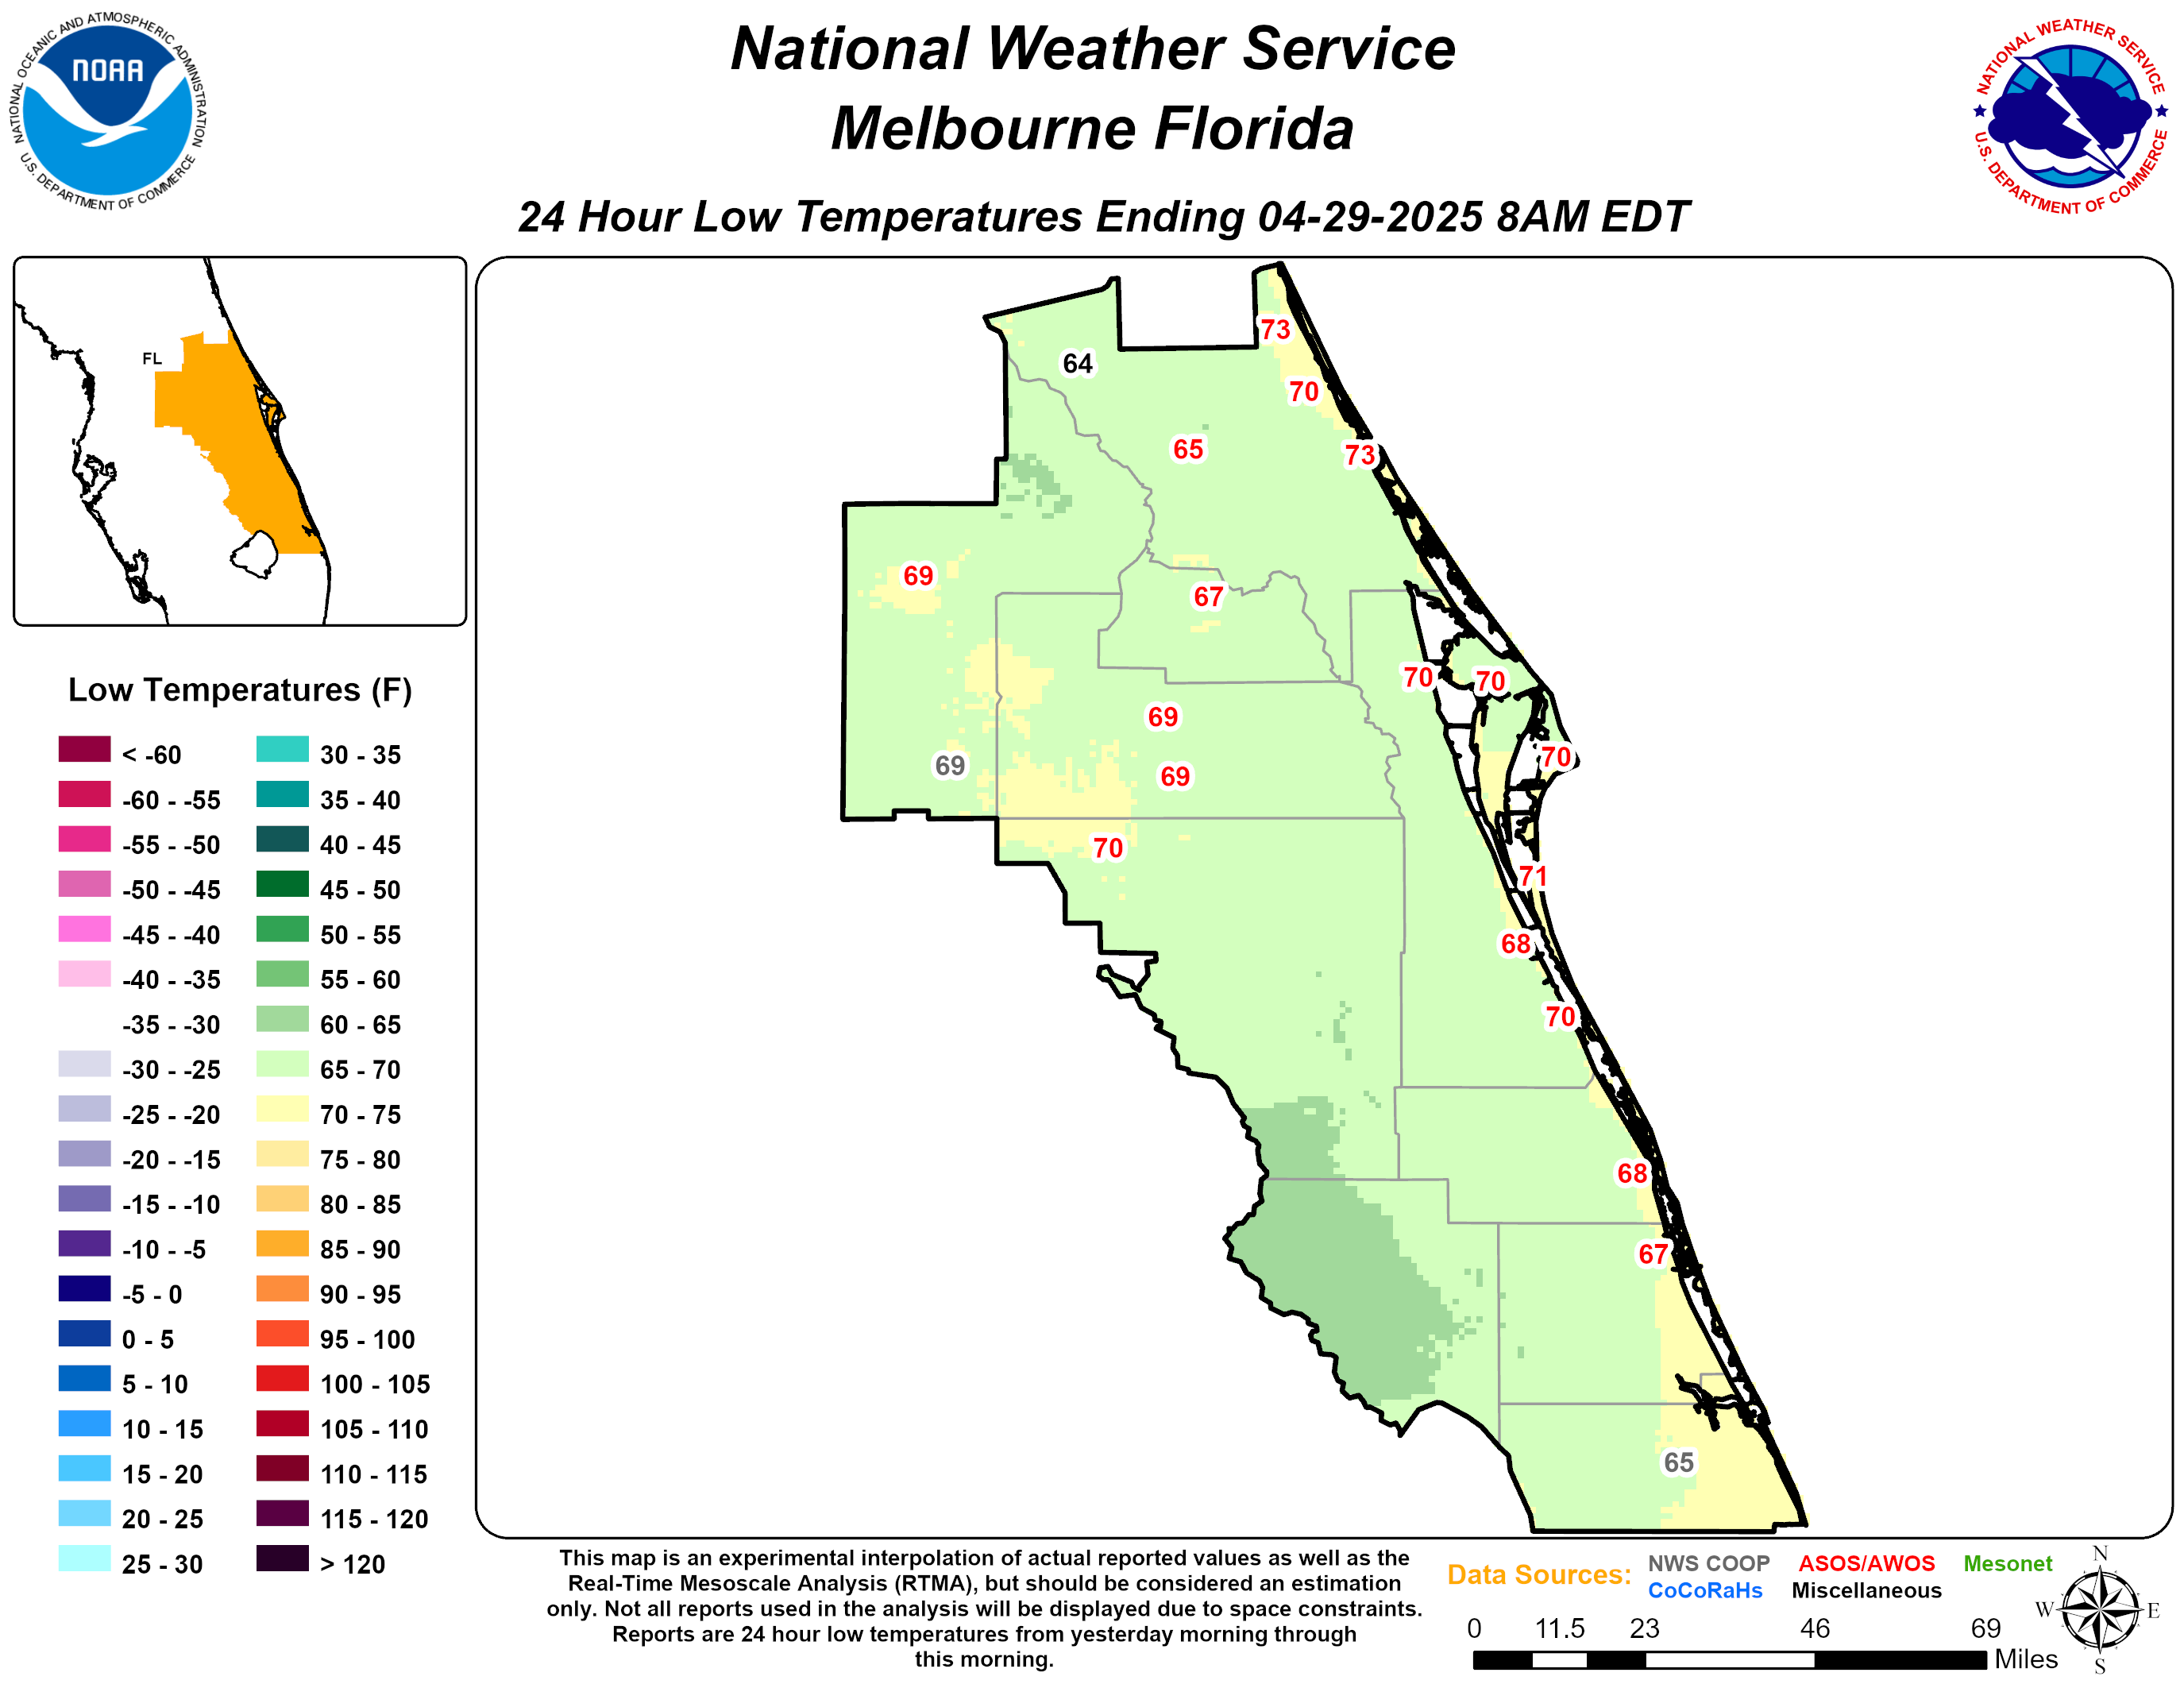
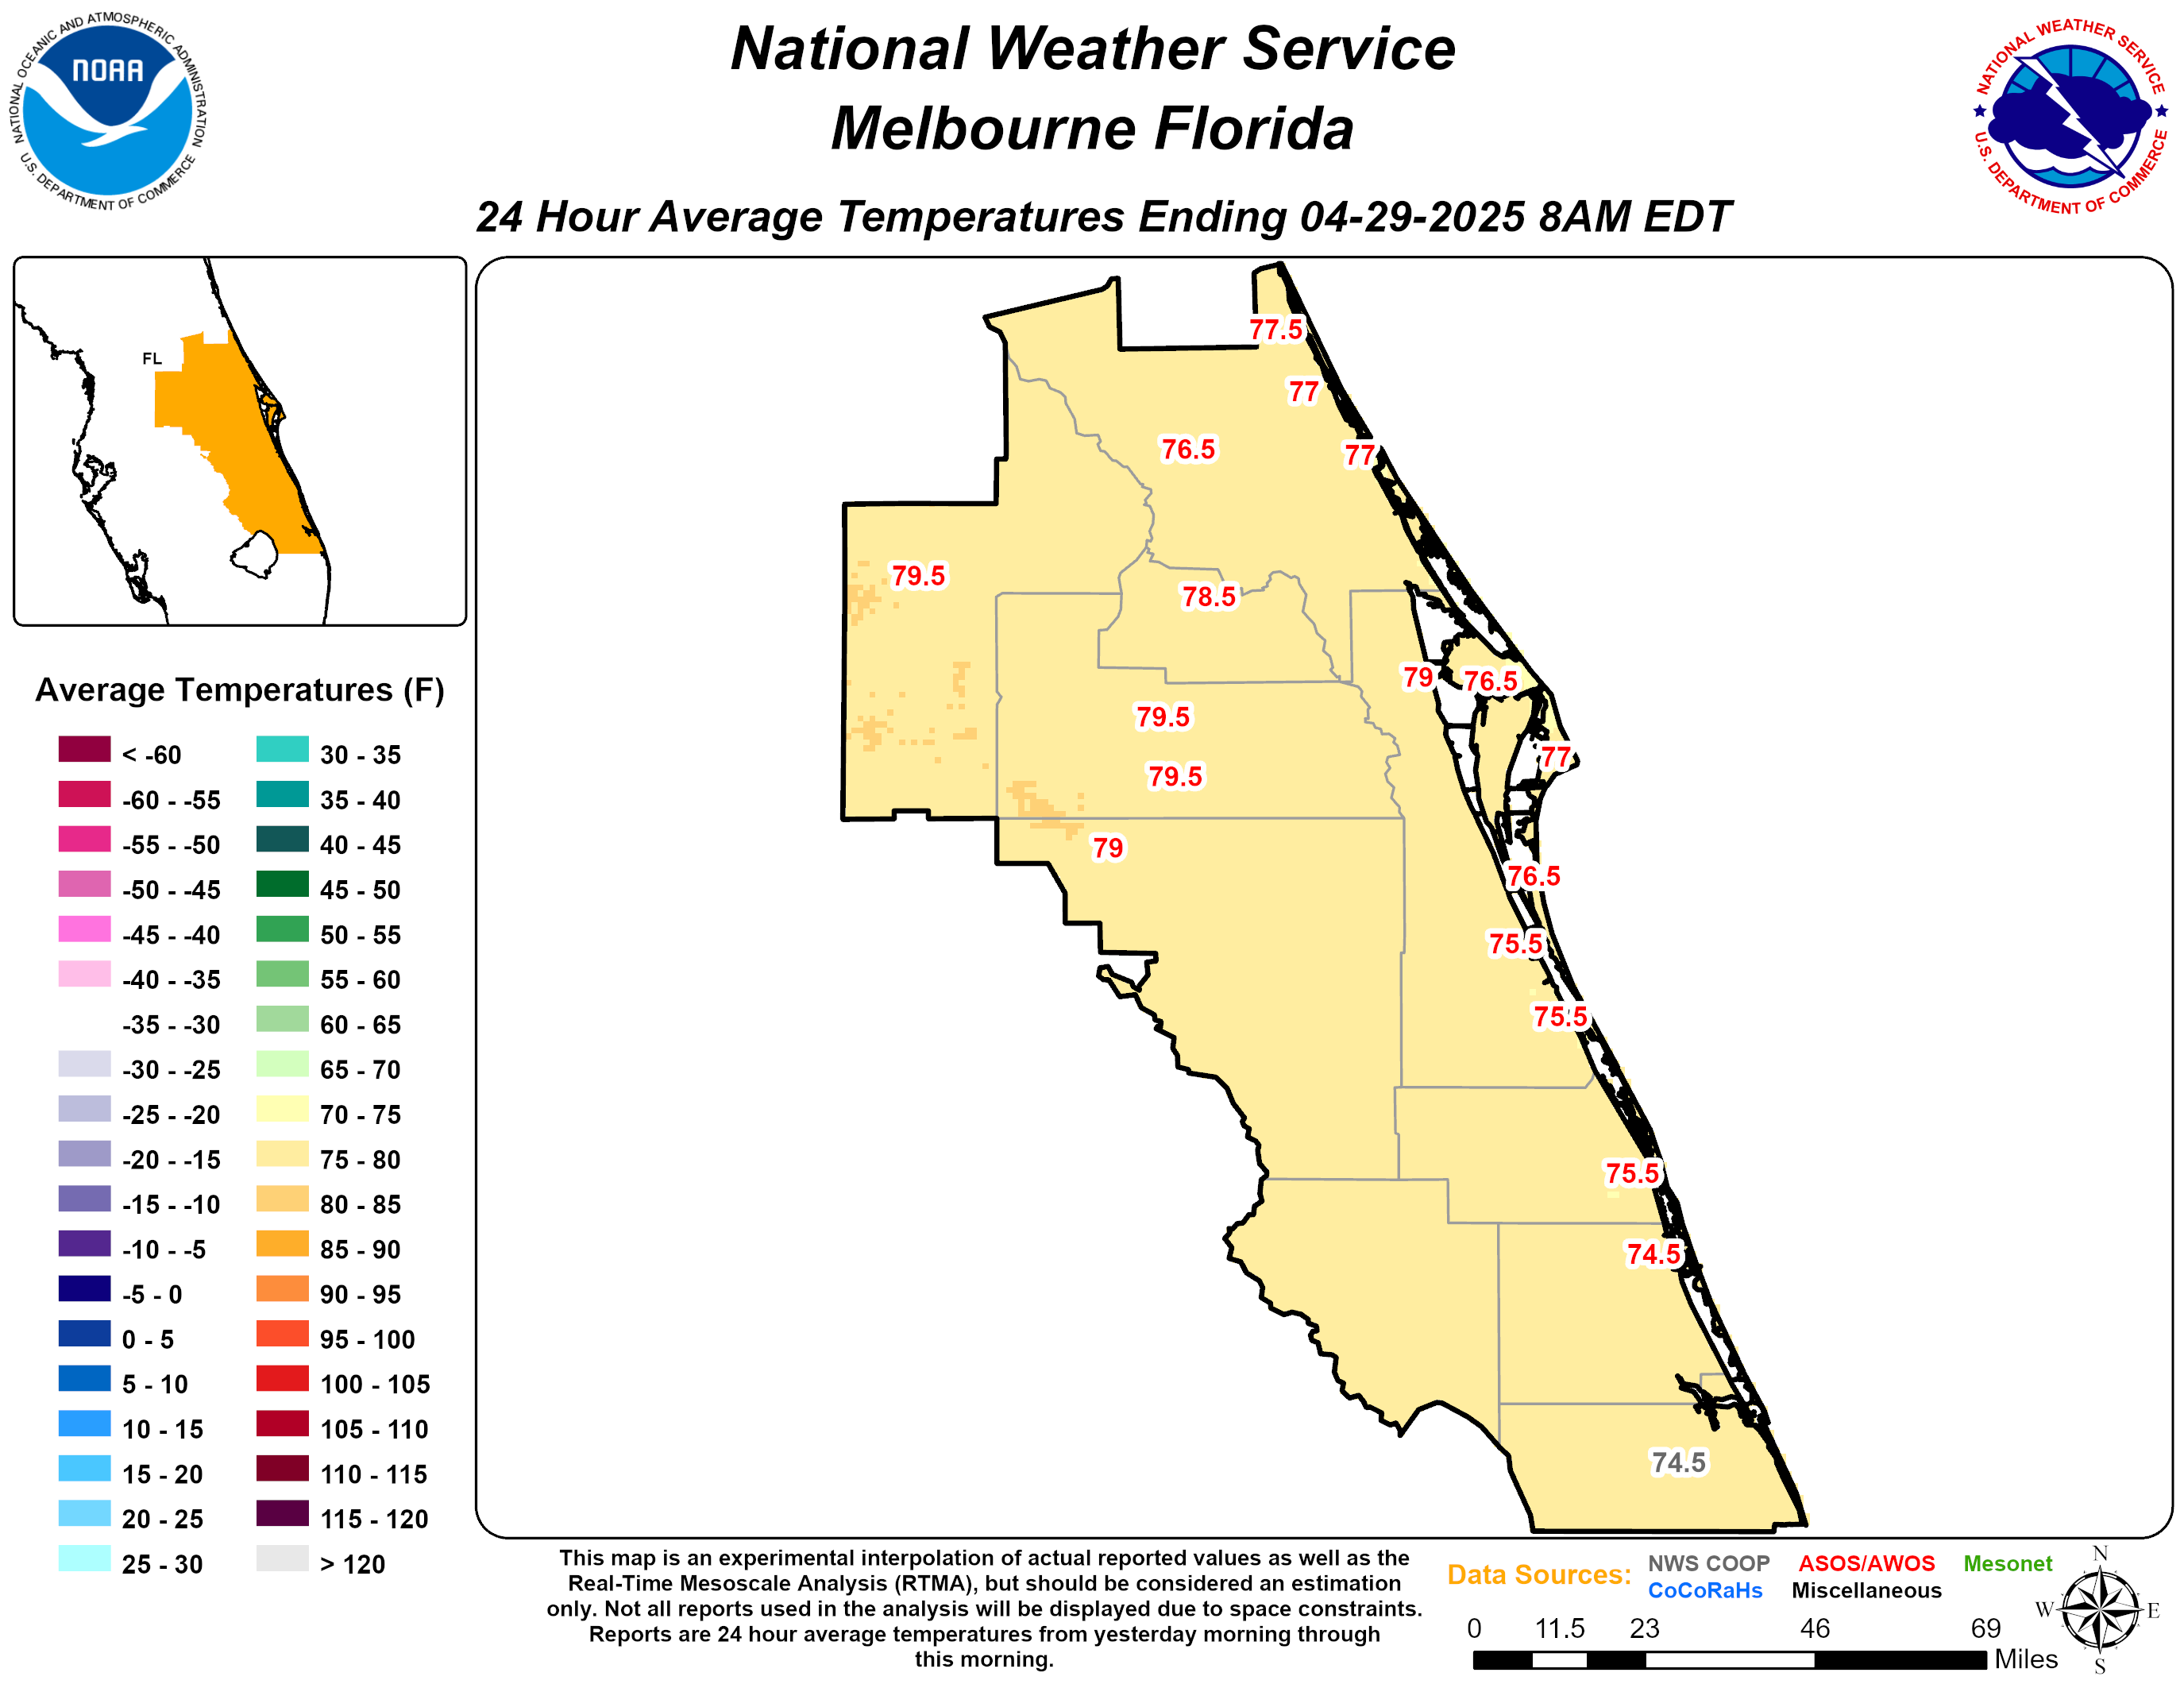
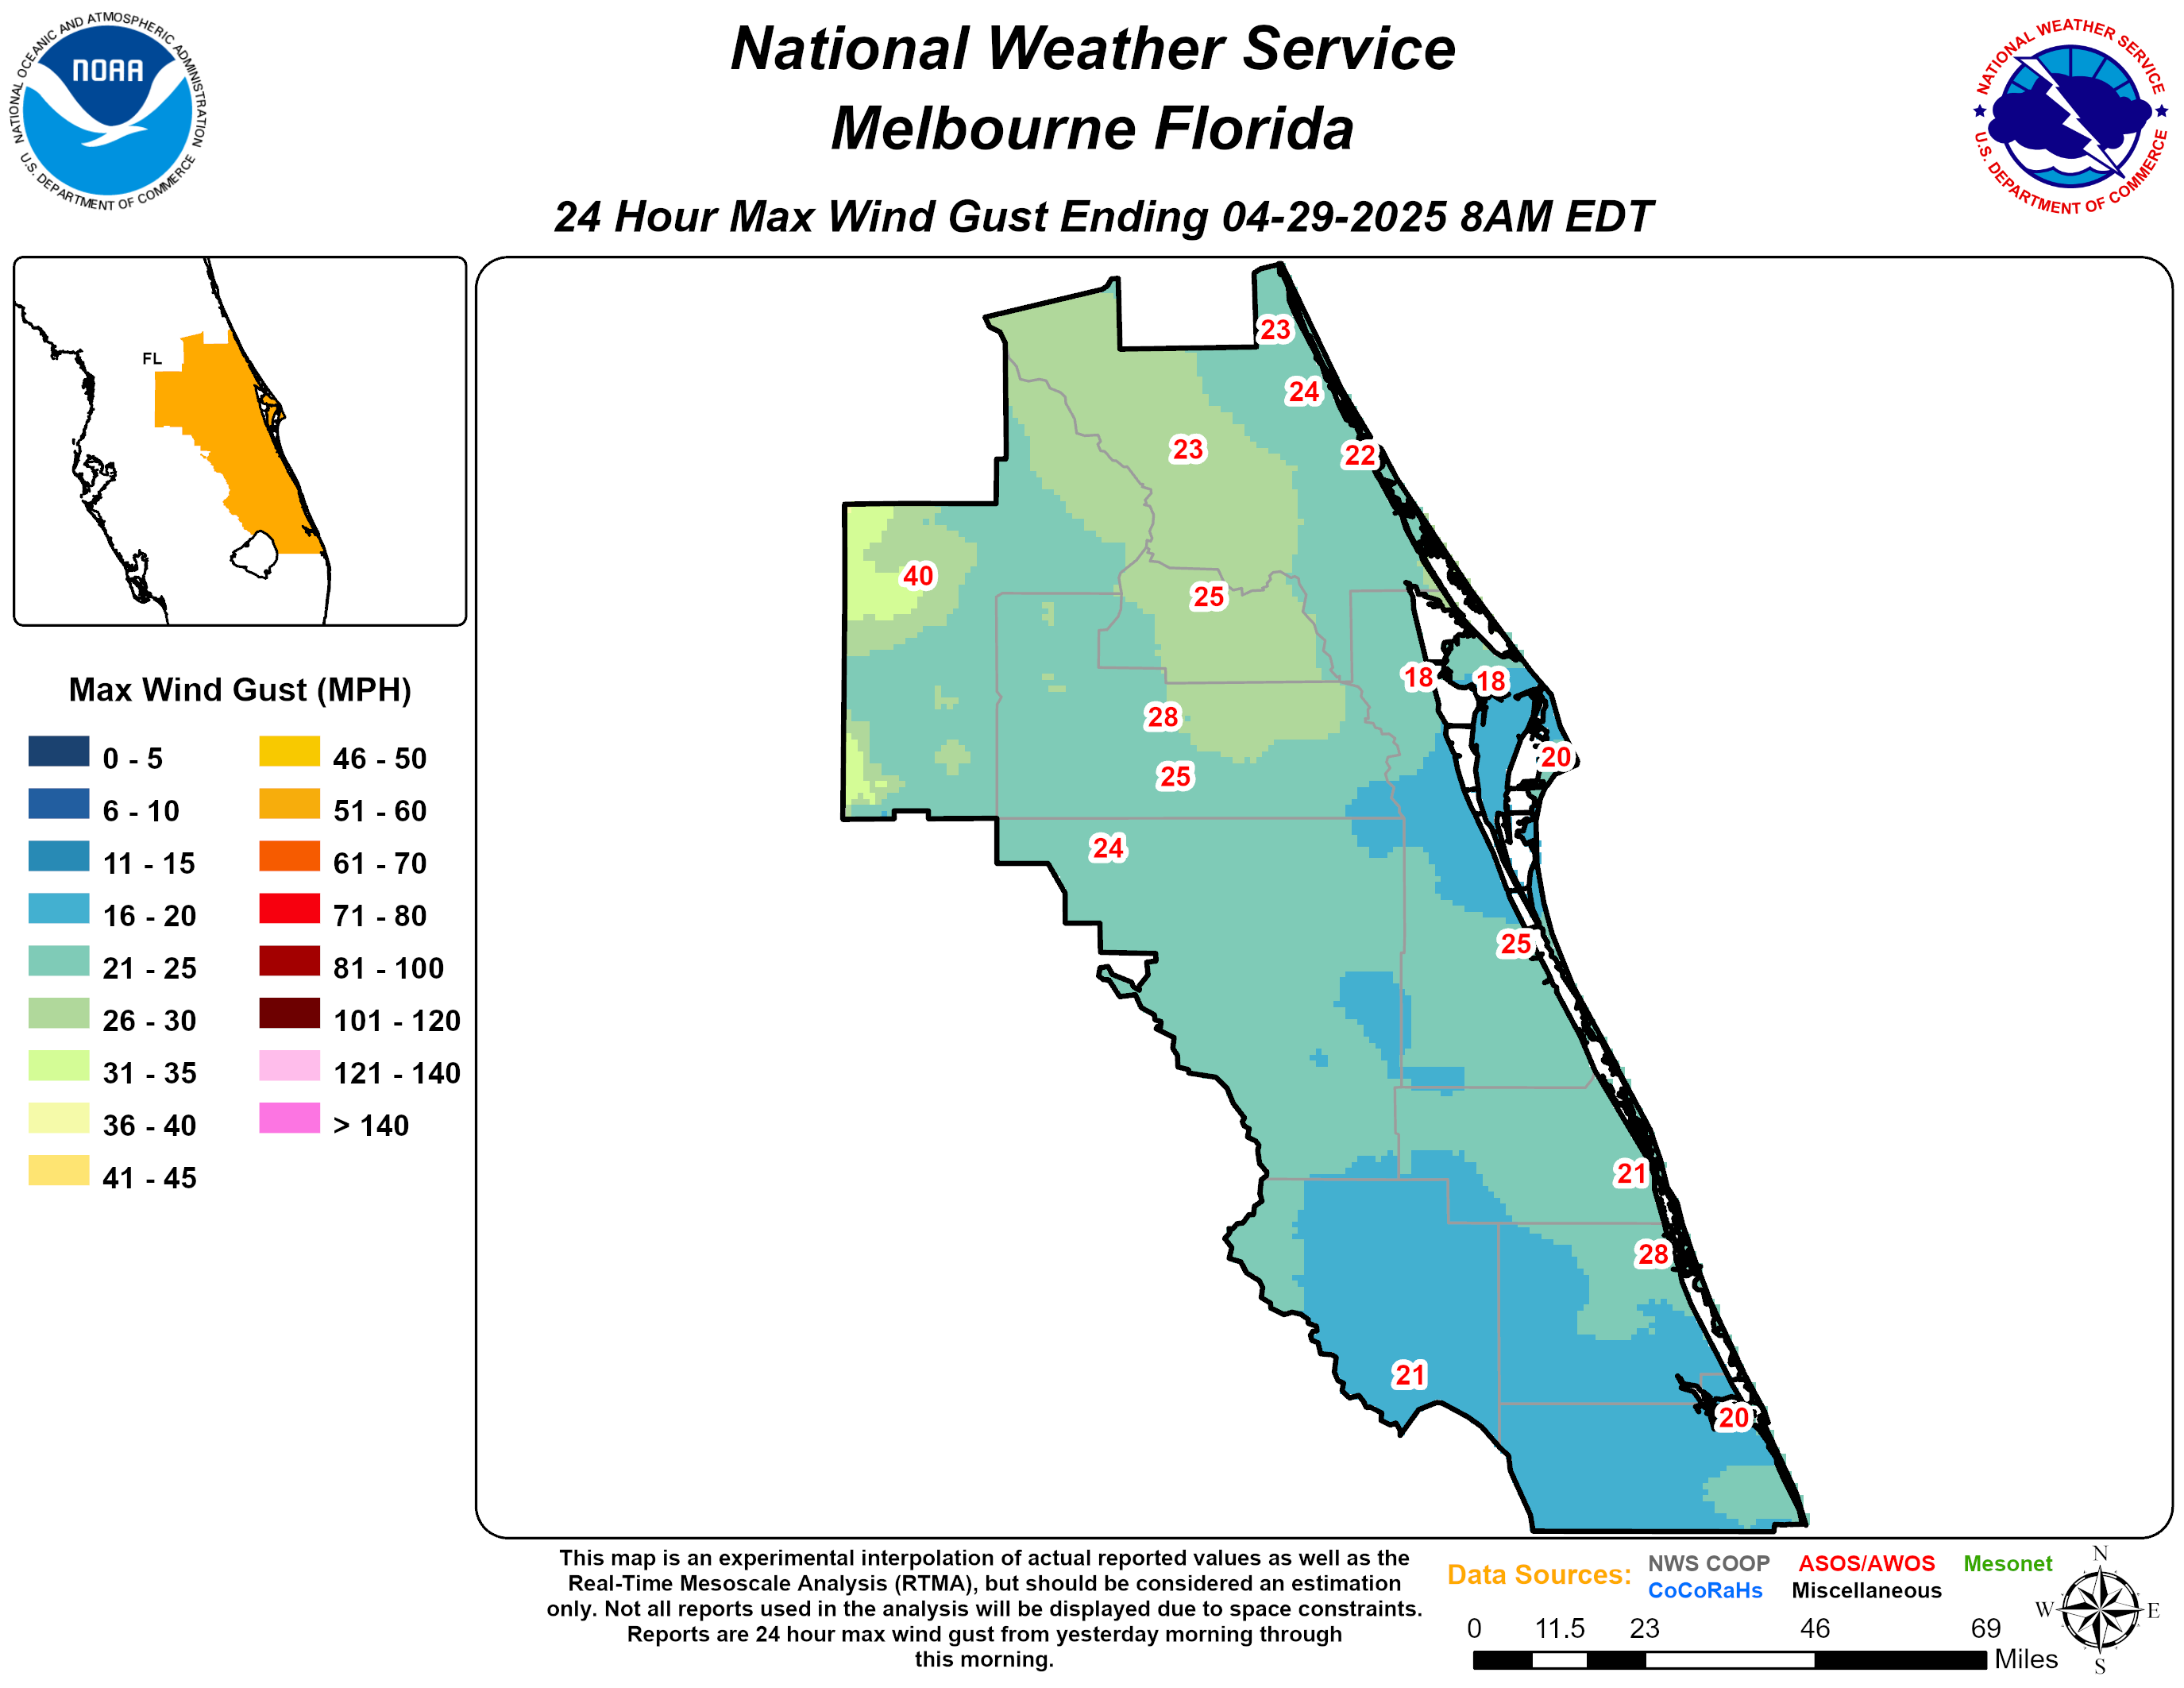
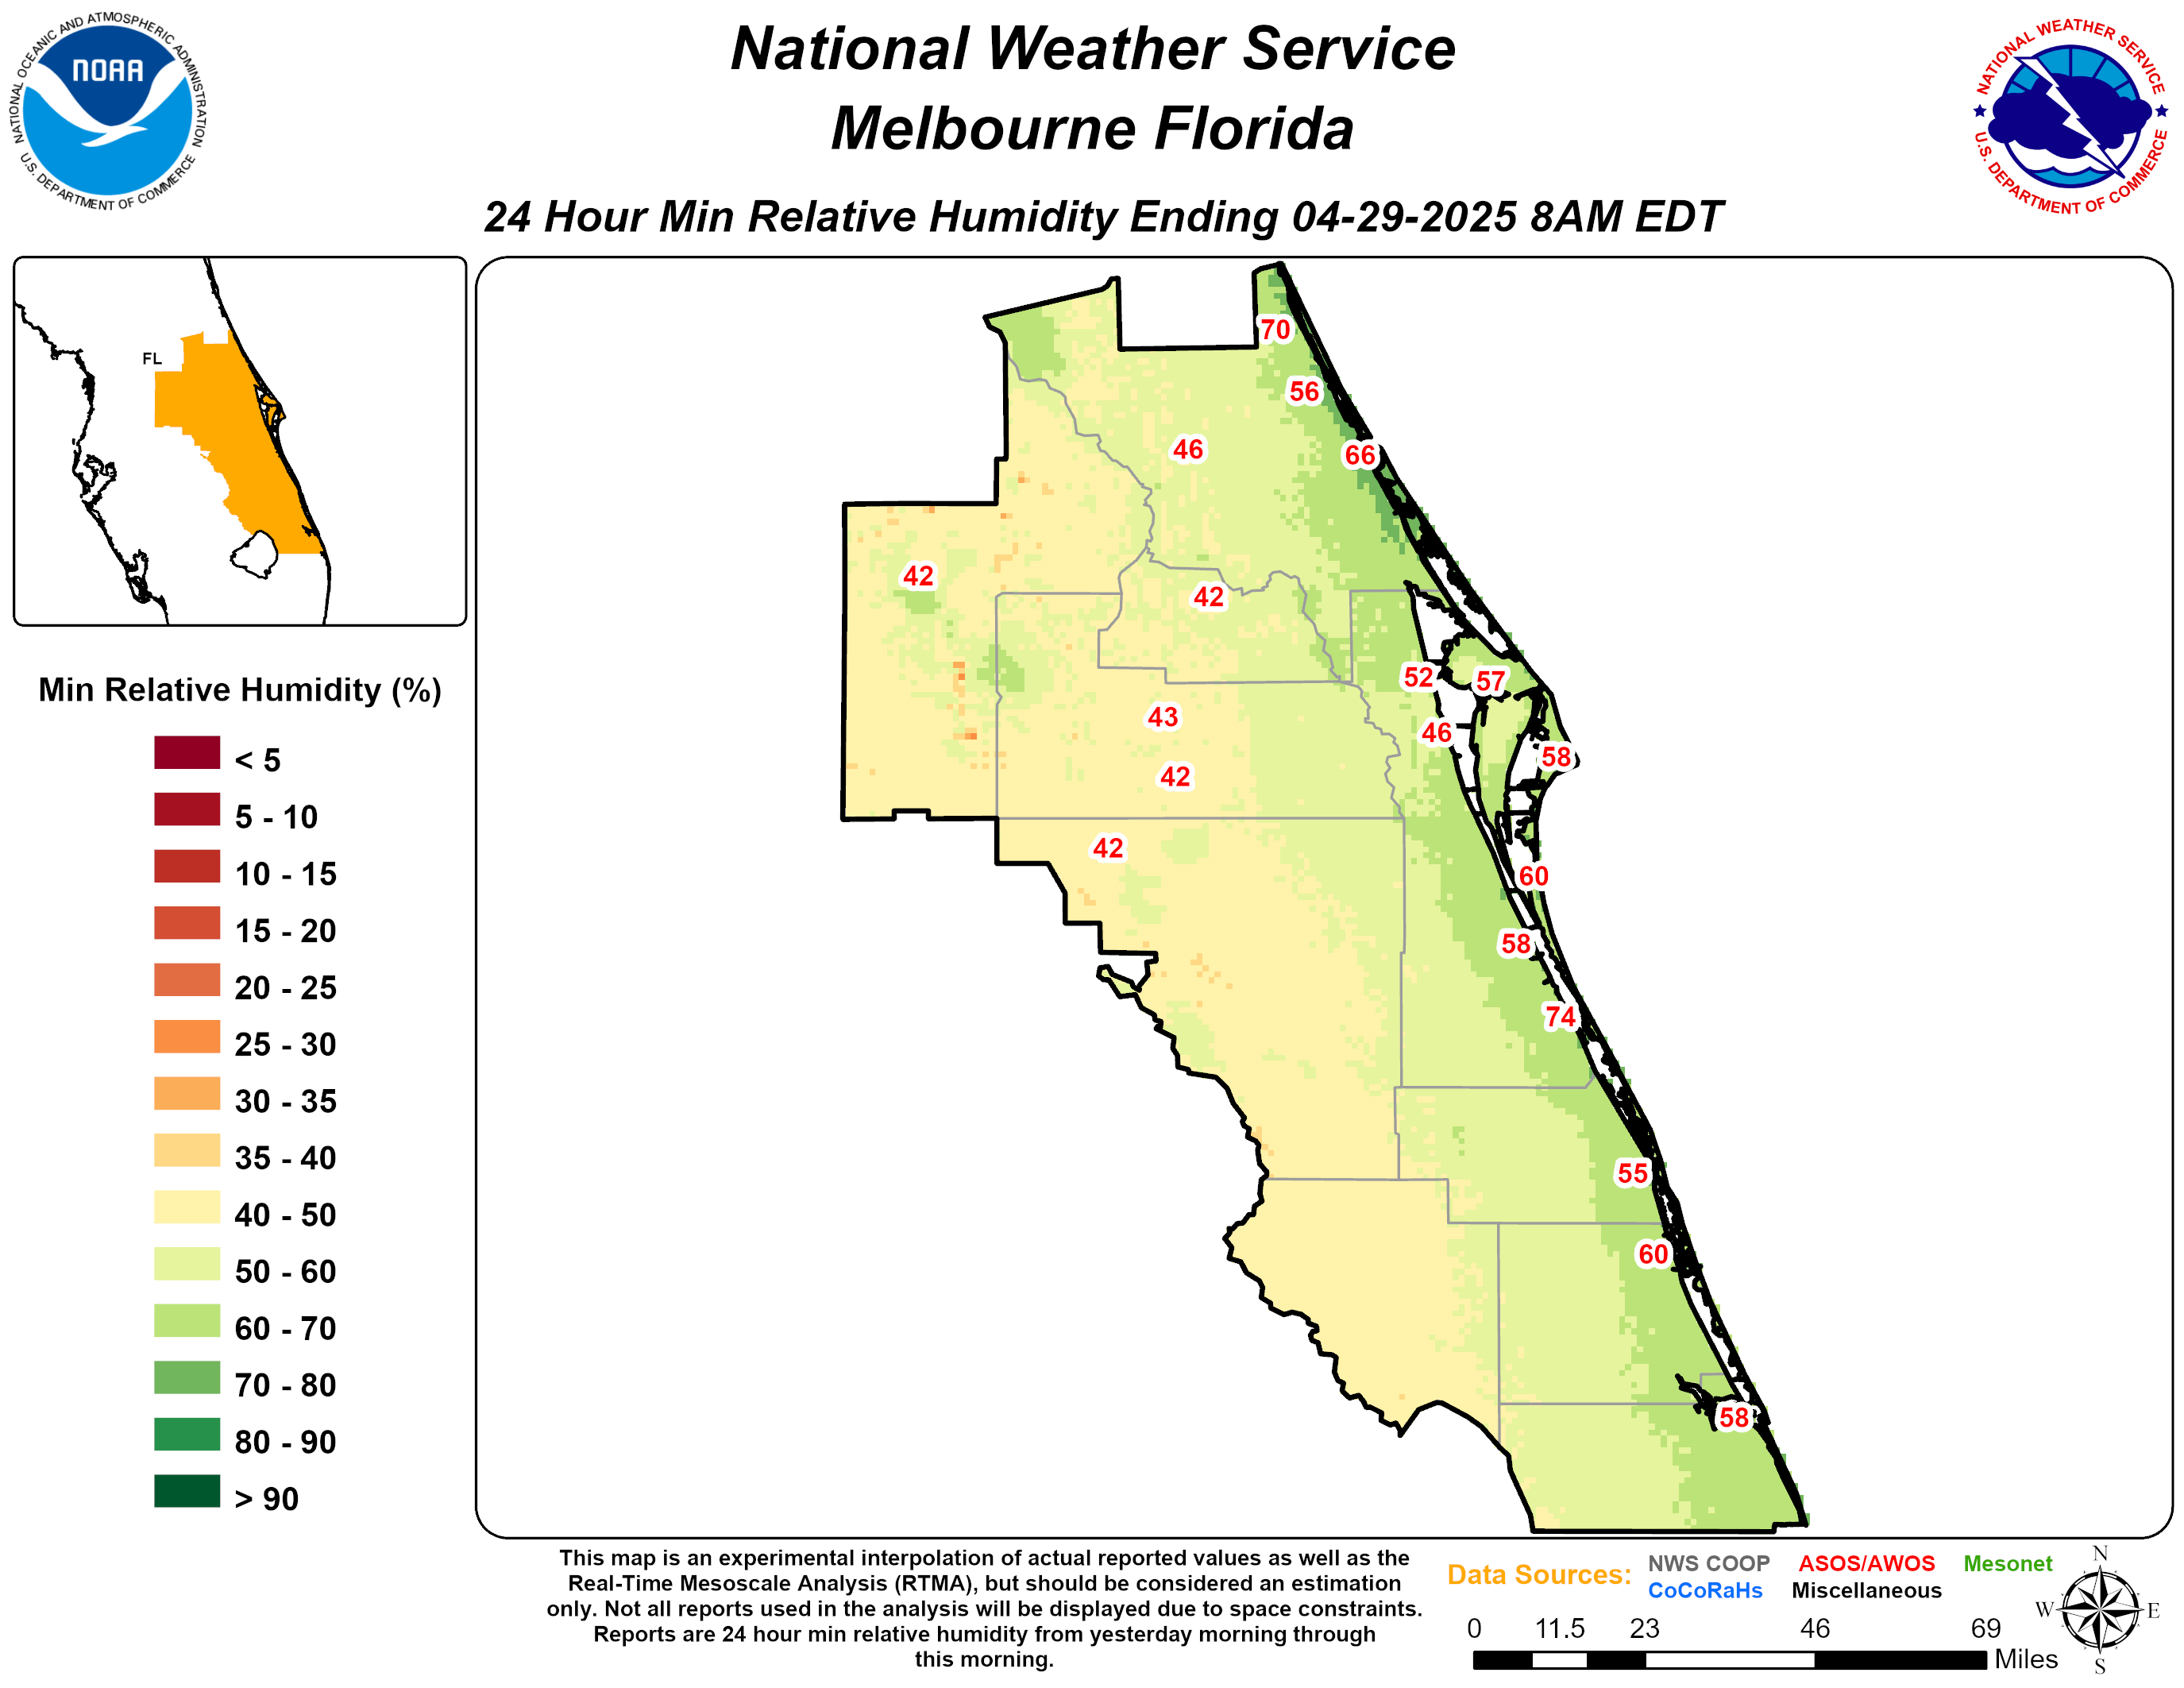
Past 24 Hour Observed Weather across east central Florida |
||
|---|---|---|
|
|
||
 |
 |
 |
 |
 |
 |
Map archives available beginning January 2, 2023*
(Archived maps are generally available for the last 365 Days)
Click image for a larger version
Map archives available beginning January 2, 2023*
(Archived maps are generally available for the last 365 Days)
Click image for a larger version
Map archives available beginning January 2, 2023*
(Archived maps are generally available for the last 365 Days)
Click image for a larger version
*Map production began on January 2, 2023. Maps may be available prior to this date but the record may not be complete or representative.
Credits:
Webpage design credit to NWS MRX and NWS GSP.
Configured for NWS Melbourne by brendan.schaper@noaa.gov, leonard.miller@noaa.gov
CURRENT HAZARDS
Cold Weather Support
Florida Hazards (CAP Text)
Hazardous Weather Outlook (Graphical)
Hazardous Weather Outlook (Text)
Outlooks
Storm Reports (Graphical)
Storm Reports (Text)
FORECASTS
Area Forecast Discussion
Aviation Weather
Fire Weather
Graphical
Marine Weather
Probabilistic
Text Products
Tropical Weather
Winter
CURRENT WEATHER
Local Analysis
Observations
Precip Analysis
Satellite Images
Rivers/Lakes
RADAR IMAGERY
Melbourne Standard
Melbourne Enhanced
Regional - Southeast
Area Radars
US Dept of Commerce
National Oceanic and Atmospheric Administration
National Weather Service
Melbourne, FL
421 Croton Road
Melbourne, FL 32935
321-255-0212
Comments? Questions? Please Contact Us.