May 6, 2005 Nor'easter
Event Overview
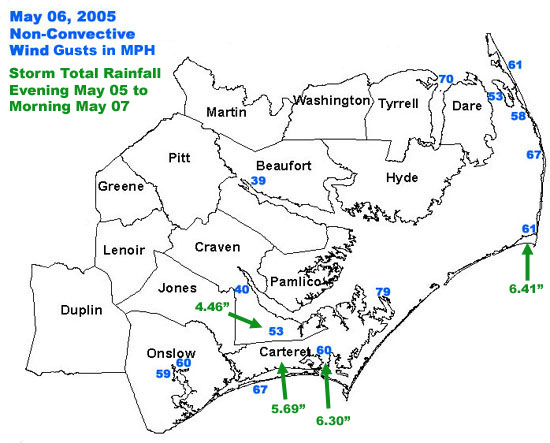
On May 6, 2005, an unseasonable, impressive Nor' Easter buffeted the North Carolina coast with hurricane force wind gusts, torrential rain and high surf. Winds gusted up to 79 mph at Cedar Island in Carteret County, with numerous reports of 50 to 70 mph wind gusts all along the central and northeast North Carolina coast. Downeast Carteret county experienced the brunt of the coastal flooding and winds as 45-55 mph sustained northeast winds, gusting to near 80 mph at times, inundated the area with water from the Pamlico Sound. Areas such as Adams Creek, Clubfoot Creek and Slocum Creek experienced moderate flooding with water levels reaching 4-6 feet above normal. Buoy 41025 (Diamond) reported up to 20 foot wave heights during the peak of the storm. Rainfall amounts between 4 and 7 inches were common in most coastal counties, causing localized flooding in low-lying areas. This event was remarkable in that the sustained winds/gusts, rainfall totals and extent of coastal flooding were comparable to that of a strong tropical storm. Indeed, visible satellite imagery even showed an eye-like feature at the center of the surface low as it passed to the southeast of Cape Hatteras.
High Wind Reports - Wind Gusts / Rainfall Totals from May 6, 2005.

Synoptic Overview
On the evening of Thursday, May 5, 2005, a surface low formed over Florida as a 500 mb trough began to dig into the southeast states. The surface low subsequently began to move northeast along the southeast coast as the 500 mb trough closed off over North Carolina. During the morning hours of Friday, May 6, 2005, it was apparent that the system was deepening much quicker than any model had forecast as surface pressures began to plummet ahead of the low and winds along the North Carolina coast began to increase significantly. The low continued to rapidly deepen as it crossed south of Cape Hatteras. Surface pressures in the low center were not directly sampled because of the low's offshore location. At 2000Z (4:00 pm), the closest buoy to the low center, buoy 41025 (Diamond), reported a surface pressure of 999.5 millibars with NNE winds at 40 knots, gusting to 58 knots. Visibile satellite imagery fixed the low center (with an eye-like feature) 50 miles due SSE of 41025 at this time. With winds 40G58KT 50 miles from the low center at buoy 41025, it is reasonable to assume surface pressures at the low center were much lower, probably somewhere near 995 millibars. It is also interesting to note that at this time [2000Z], the pressure difference between Cape Lookout and Buoy 41025, a distance of approximately 75 miles, was near 10 millibars!
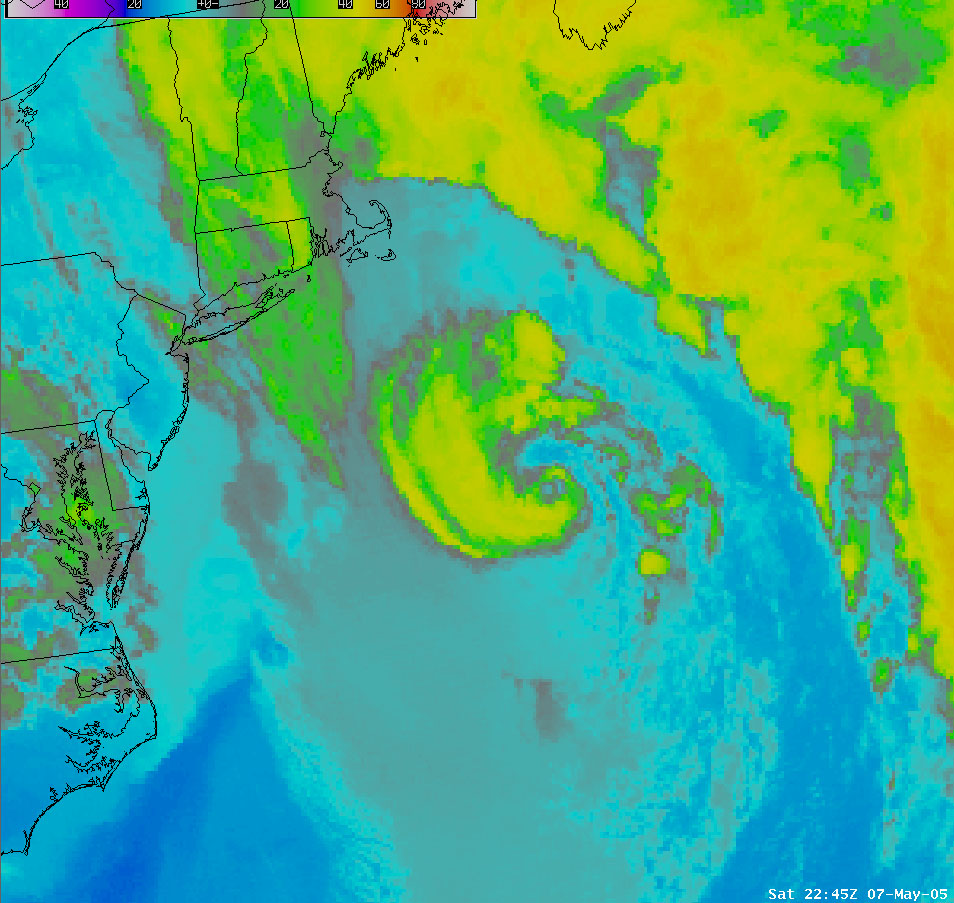
As the system continued to move northeast out into the Atlantic on Saturday, May 7, convection began wrapping around the center of circulation and a distinct eye feature persisted. The system developed strong convection at the center of circulation (as shown in the IR Satellite image from Sat. May 7) at a latitude and longitude that cooresponded almost exactly with the northern edge of the Gulf Stream, an area with strong SST gradients. From a cyclone dynamics perspective, with extratropical systems dominated by strong upper-level dynamics and dry baroclinic energy conversion at one end of the spectrum and tropical cyclones dominated by diabatic processes (latent heat release) on the other end, this system (at least for a time on Saturday) seemed to possess characteristics from both ends of the spectrum. There is much debate within the meteorological community on what exactly constitutes a subtropical or hybrid system. A more thorough analysis of model data in this case is needed to determine what was happening to the cyclone on Saturday afternoon. Inverting the lower diabatic potential vorticity maximum to see how much it was contributing to the overall circulation of the system would help quantify how much of a role latent heat release was playing as the system evolved on Saturday. However, even without a thorough analysis of model data, the IR satellite representation of the system on Saturday and its location at the northern edge of the Gulf Stream point to the conclusion that this system did indeed fall somewhere in-between the extratropical and tropical ends of the spectrum. A most unusual storm, especially for May.
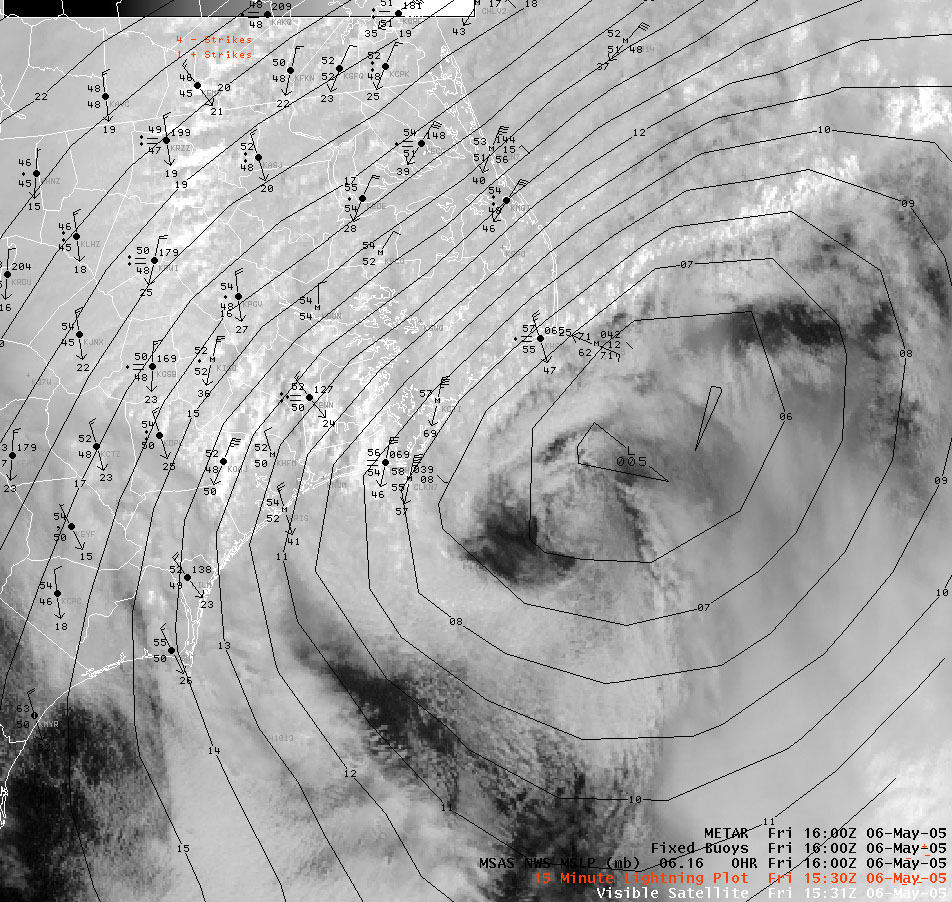
Visible Satellite - 05/06/05 1600Z Visible satellite image with surface obs, buoys, and MSAS MSLP overlaid. Note: MSLP analysis is too high. Also Note: Cedar Island gusting to 69 knots, Cape Lookout gusting to 57 knots, Beaufort gusting to 46 knots, Cape Hatteras gusting to 47 knots and Ellis Airport (OAJ) gusting to 50 knots.
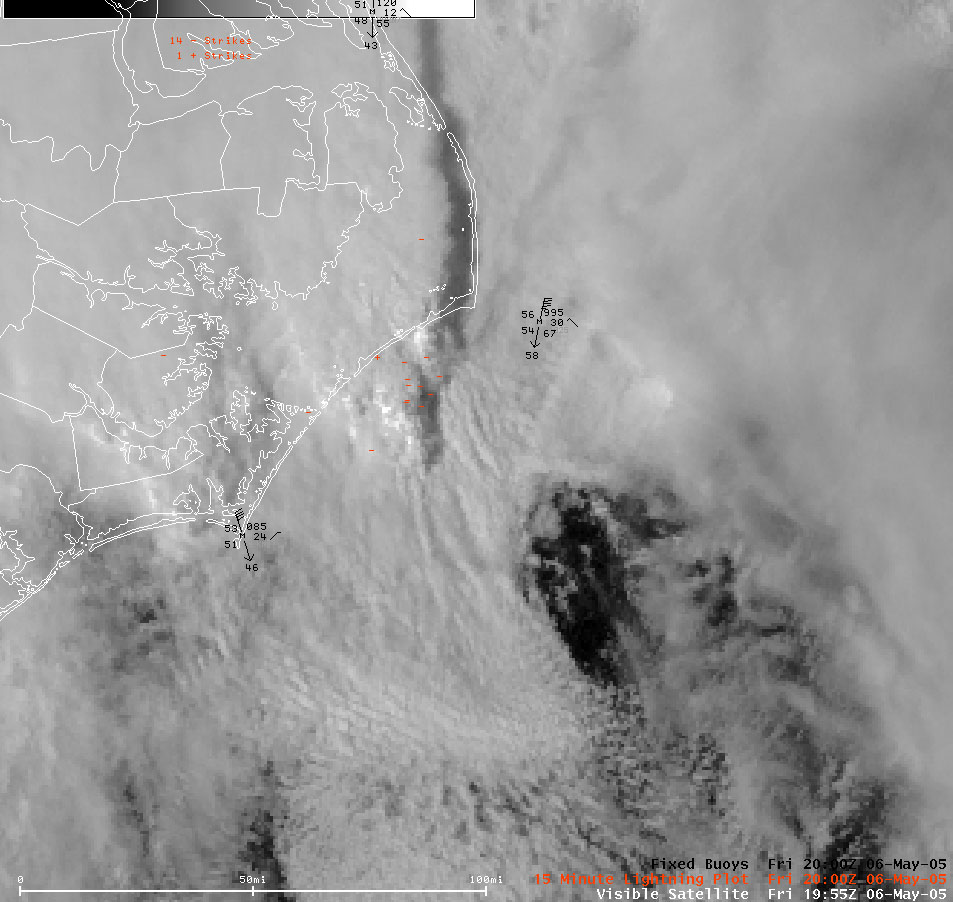
Visible Satellite - 05/06/05 2000Z Visible satellite image showing the eye-like low center due SSE of buoy 41025, which has a surface pressure of 999.5 millibars and winds 40-45 knots, gusting to 58 knots. Surface pressures in the low center were most likely near 995 millibars at this time. Note: an almost 10 millibar pressure difference between Cape Lookout and Buoy 41025, a difference of only 75 miles!
Infrared Satellite - 05/07/05 (Saturday) 2245Z (645 pm) Infrared satellite imagery showing convection wrapping around the center of circulation and a distinct eye feature, indicating that the smaller-scale circulation embedded within the synoptic extratropical system had probably obtained subtropical (hybrid) characteristics.
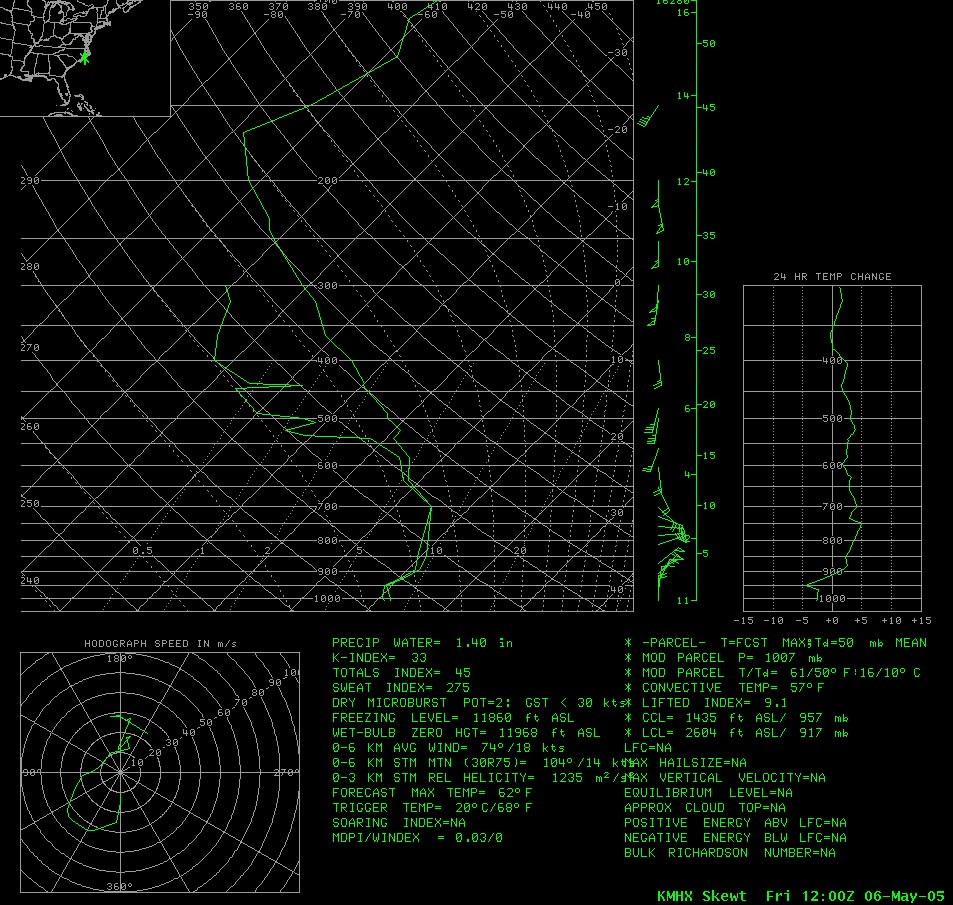
Upper-Air Sounding - 05/06/05 1200Z (8:00 am) MHX Skew-T showing 50 knot winds at 1000 ft AGL and 67 knots winds at 3000 ft AGL. Although the sounding is quite stable, heavy rain was able to drag these winds down to the ground in coastal locations. The MHX VAD Wind Profile showed 73 knot winds at 4000 ft AGL later in the day!
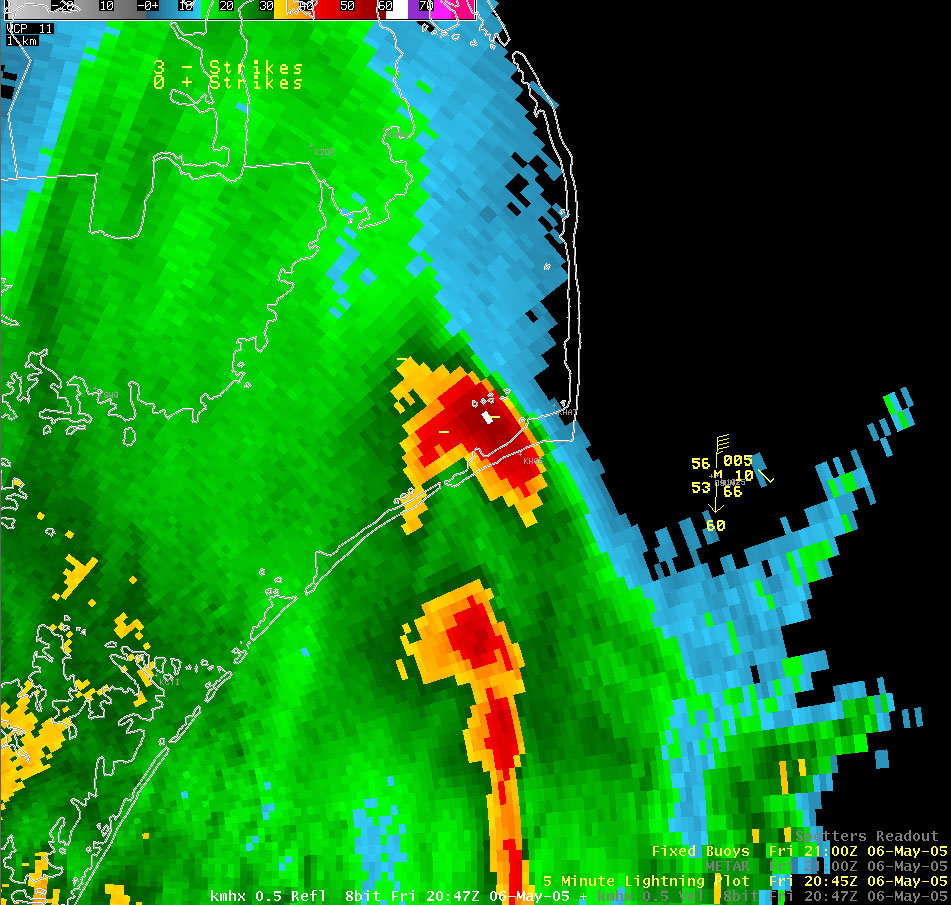
Dare County Severe Thunderstorm - 05/06/05 2100Z (5:00 pm) 0.5 degree radar reflectivity showing a thunderstorm (formed at 3:00 pm south of Ocraoke and subsequently moved NNE into Hatteras Village) that prompted back-to-back severe thunderstorm warnings for OBX Dare County from 4:00 pm - 5:25 pm. The storm produced 60-65 mph winds in Hatteras Village and 70-75 mph winds in Frisco. Note: In this image the cell had a 60+ dBZ reflectivity core and several negative CG lightning strikes associated with it.
Case Study Team:
Brandon Vincent


 Map View
 Weather Hazard Briefing (when applicable)
 Forecaster Discussion
 Marine
 Text Products
.png) Skywarn
Skywarn Submit Storm Reports
 Coastal Flood
.png) Surf Forecast/Rip Currents
Surf Forecast/Rip Currents