March 28, 1984 Major Tornado Outbreak
Event Overview
The most destructive tornado outbreak to sweep through the Carolinas since the 1884 Enigma Outbreak occurred during the afternoon and evening hours of March 28, 1984. There were 24 confirmed tornadoes (Figure 1), including 7 F4 tornadoes, 5 F3 tornadoes and 7 F2 tornadoes. The outbreak caused 57 deaths and 1248 injuries, with 37% of the deaths in mobile homes. The storms were moving as fast as 65 mph, crossing all of eastern North Carolina in about 4 hours and crossing the MHX CWA in a little over an hour. In the Newport/Morehead City County Warning Area (CWA), there were 3 total tornadoes, 2 were F4’s, the other an F3. These 3 tornadoes produced 16 deaths and over 300 injuries. The counties affected in Eastern North Carolina included Pitt, Greene, Lenoir and Duplin with 9 deaths reported in Pitt County and 7 in Greene County. East Carolina University in Greenville sustained severe damage.
The National Severe Storms Forecast Center (now Storm Prediction Center) had all of Eastern North Carolina in a high risk of severe weather, the only time a high risk has ever been utilized in this area until April 16, 2011. Many of the tornado damage paths were ¾ to 1 mile wide. This outbreak developed near the center of a mesoscale low, in a fashion resembling the famous 1925 “Tri-State Tornado”. In this outbreak, the damage path was attributed to separate tornadoes, though one mesocyclone produced (along a roughly 250+ mile track), a family of large tornadoes – 12 of which produced F3 or F4 damage with swaths of downburst damage and large hail.
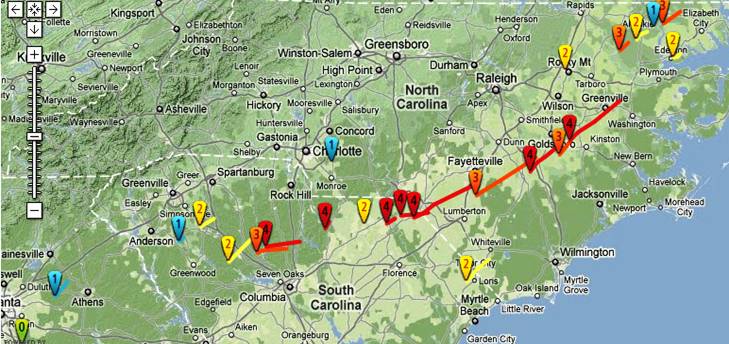
Figure 1. Path and Fujita rating of March 28, 1984 tornadoes across the Carolinas.
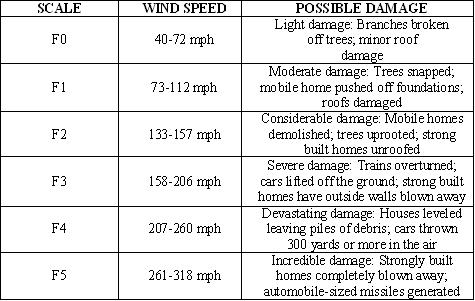
Fujita Scale
Synoptic Overview
The 00Z March 28, 1984 upper air isotach analysis at 300 mb showed a strong 120 to 140 knot jet streak along the base of an upper level trough extending from Texas to Mississippi (Figure 2). The 500 mb analysis showed a low cutting off over the Texas Panhandle with a strong mid-level jet rounding the base of the upper trough with diffluent flow aloft developing over the western Gulf states (Figure 3). By 12Z on March 28, the upper air charts showed an intense shortwave trough progressing rapidly across the southern United States. The center of the trough was over northeast Arkansas with 500 mb winds of 80 to 90 knots (Figure 4). At 850 mb at 12Z, 50-60 knot winds were present with dewpoints increasing to 10 to 13 degrees Celsius. This strong 850 mb jet coupled with dual 95-knot jets at 500 mb led to a strongly sheared pre-storm environment over the Carolinas on March 28 (Figure 5).
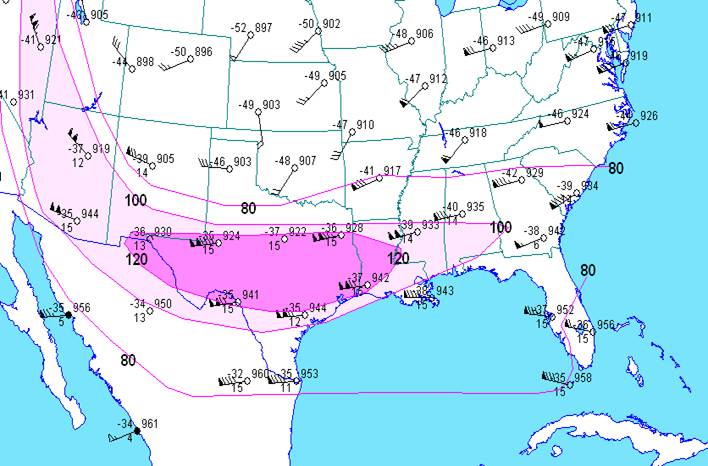
Figure 2. 300 mb Isotachs at 00Z March 28, 1984 showing strong jet max across Texas into Mississippi.
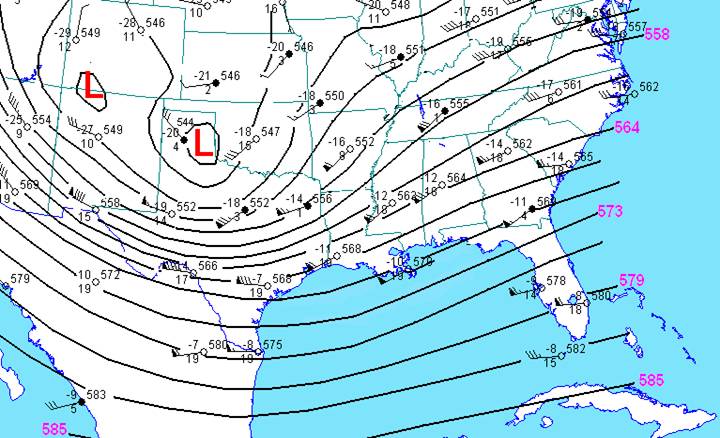
Figure 3. 500 mb Heights at 00Z March 28, 1984 shows cutoff low over the Texas panhandle and jet max rounding the base of the low.
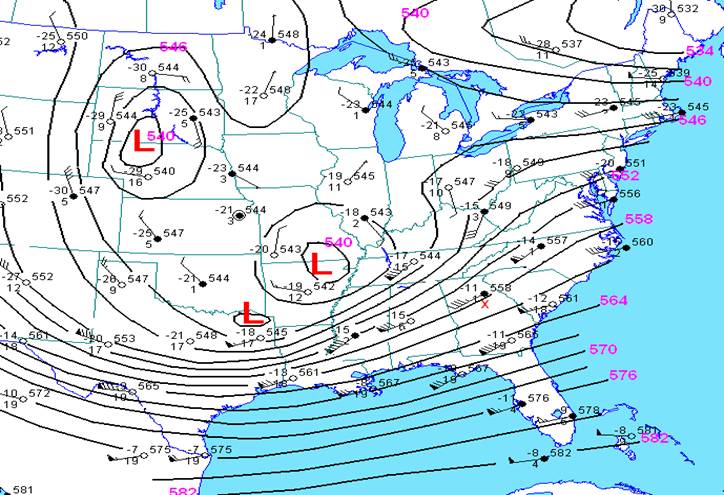
Figure 4. 500 mb Heights at 12Z March 28, 1984 showing closed upper low over Northeast Arkansas with diffluent flow aloft.
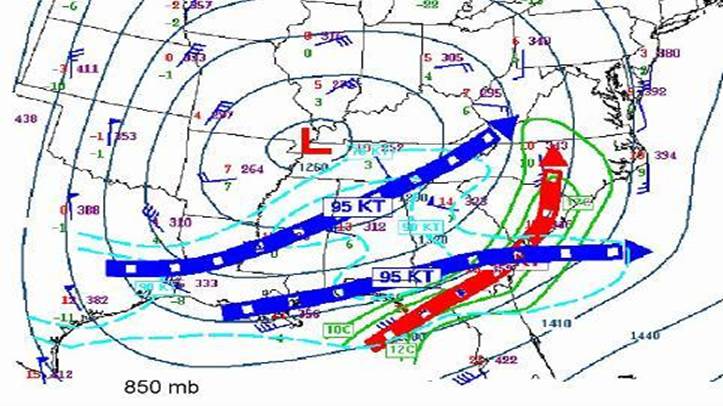
Figure 5. 850 mb Heights showing 50 to 60 knot jet along with 10 to 13 degree Celsius air being transported into the Carolinas. Dual 95- knot jets at 500 mb are superimposed to show development of wind shear.
At the surface, the 15Z surface analysis (Figure 6) showed a strong but broad area of low pressure over the Tennessee Valley. From the low, a warm frontal extended from Mississippi into Eastern South Carolina. This front gradually lifted north into eastern North Carolina during the day. A very strong mesoscale low formed on the front over Georgia by 20Z (Figure 7) and rapidly deepened to 978 mb, and began to race east-northeast across South Carolina. The airmass became very unstable across Eastern North Carolina during the afternoon with lifted index values down to -10C with 60 to 80 knots of deep layer shear.
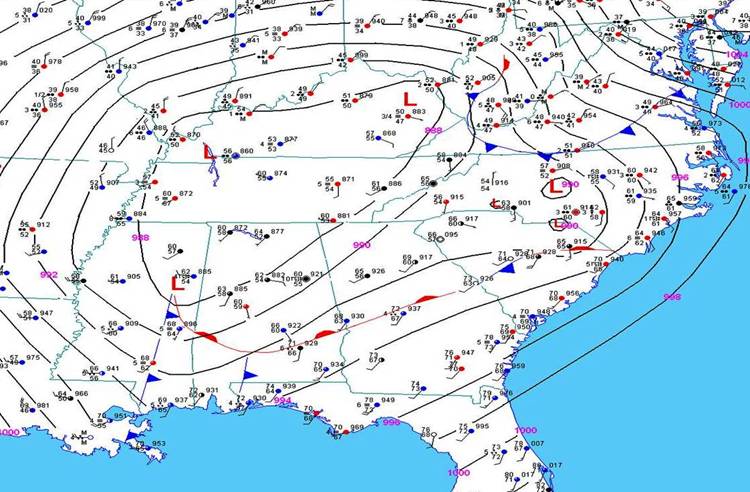
Figure 6. Surface Analysis at 15Z March 28, 1984 showing warm front extending east from strong but broad low pressure over the Tennessee Valley.
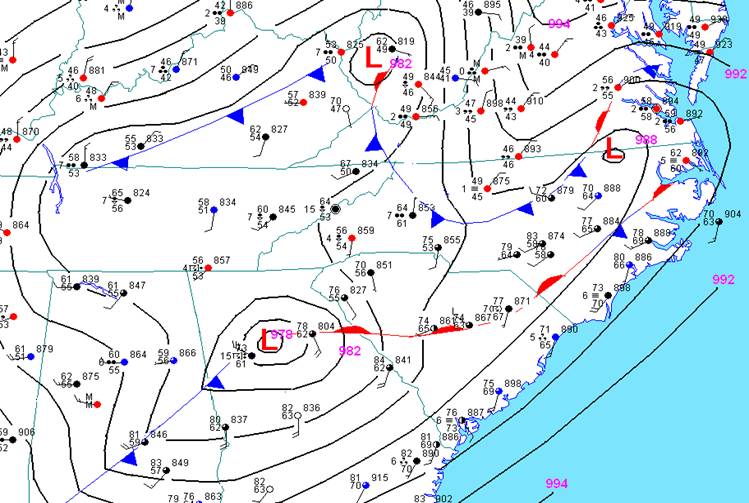
Figure 7. The 20Z Surface Analysis on March 28, 1984 shows strong 978 mb mesoscale low developing east of Atlanta, Georgia.
A deepening and acceleration of the mesoscale low occurred during the late afternoon hours. As of 21Z (Figure 8), the low had dropped to 976 mb and was located just east of Athens, Georgia. It was about this time that the first of the family of violent tornadoes touched down in Newberry, South Carolina. From this point, the surface low raced east-northeast at speeds up to 65 mph across central South Carolina into eastern North Carolina. Surface based CAPE values in excess of 3000 J/Kg were observed in northeast South Carolina with 60 to 80 knots of deep layer shear.
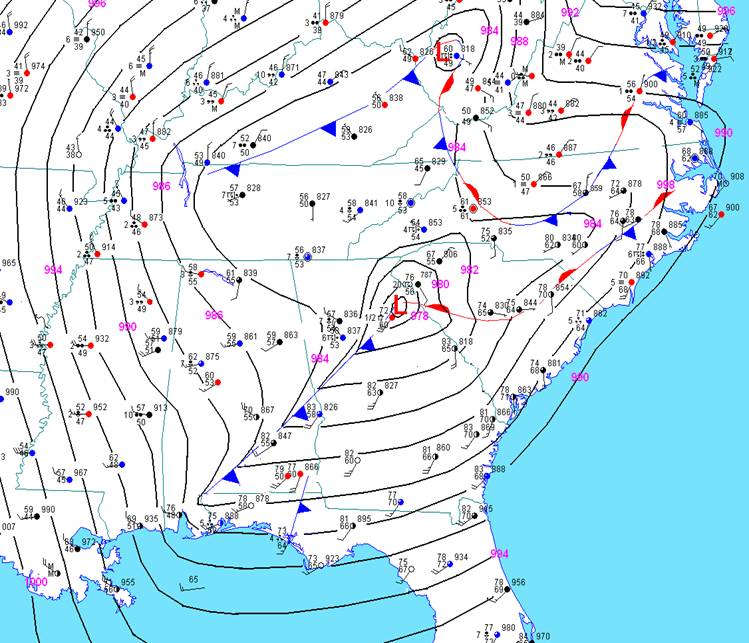
Figure 8. The 21Z Surface Analysis March 28, 1984 shows strengthening surface mesoscale low near Athens, Georgia. The first violent tornado of the day developed around this time near Newberry, South Carolina.
By 23Z, the mesoscale low had moved to just northwest of Columbia, South Carolina with a trough extending east and northeast to near Greenville, North Carolina. The family of tornadoes tracked near the trough as the surface low raced to the east-northeast. As the low moved into southeast North Carolina by 01Z on March 29 (Figure 9), surface winds were strongly backed along the warm frontal boundary, signaling strong low-level helicity. The tornadoes exited eastern North Carolina by 03Z March 29, as cold air surged in behind the exiting low pressure.
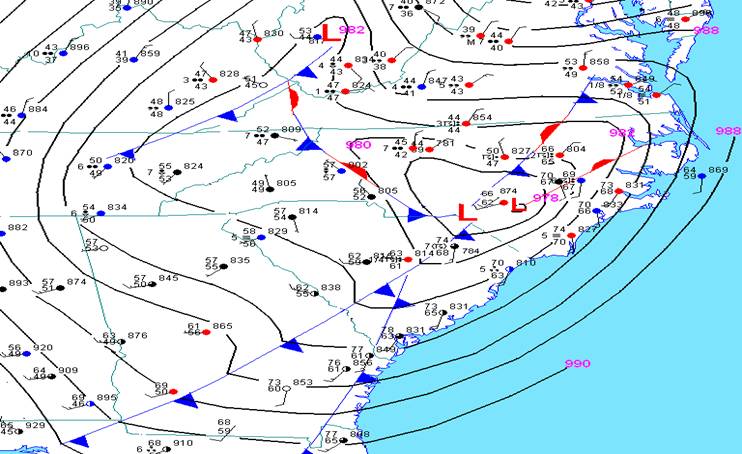
Figure 9. Surface Map at 01Z March 29, 1984 showing strong (978 mb) surface low over southeastern North Carolina. Strong tornadoes were affecting eastern North Carolina at this time.
Timeline of Eastern North Carolina Tornadoes (times approximate)
· 815 pm – Tornado enters Duplin County from Sampson County producing extensive F4 damage in Faison and Calypso before hitting Mount Olive in Wayne County. The tornado travelled 21 miles and was as much as ¾ mile wide.
· 830 pm - F3 tornado touches down and moves through the southeastern portion of LaGrange in Lenoir County, injuring 81 but causing no deaths.
· 845 pm – the deadliest tornado of the entire outbreak caused 16 deaths and 153 injuries in Greene and Pitt County. The tornado was up to ¾ mile wide and caused extensive damage to the southeastern suburbs of Greenville including damage at East Carolina University. Nine fatalities occurred in Pitt County with seven in Greene County. The fatalities occurred in Greenville, Winterville, Ayden and Snow Hill. See Figure 10 for a closer view of the Eastern North Carolina tornadoes.
Figure 10. Tracks of the 3 tornadoes affecting the Newport/Morehead City (MHX) County Warning Area (CWA).
A major change in National Weather Service warnings occurred due to this outbreak. The subsequent disaster survey report recommended that the National Weather Service begin using tornado “call to action” statements in severe thunderstorm warnings issued during tornado watches.
Sources
¨ Storm Prediction Center
¨ U.S. Significant Tornadoes, Thomas Grazulus, 1860-1991.
¨ Historical Tornado Cases for North America, Jonathan D. Finch
¨ Wikipedia
¨ NCEP
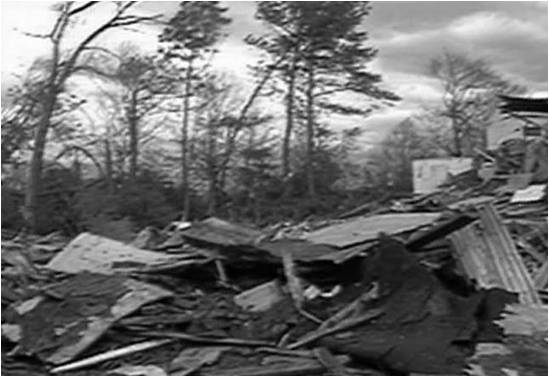
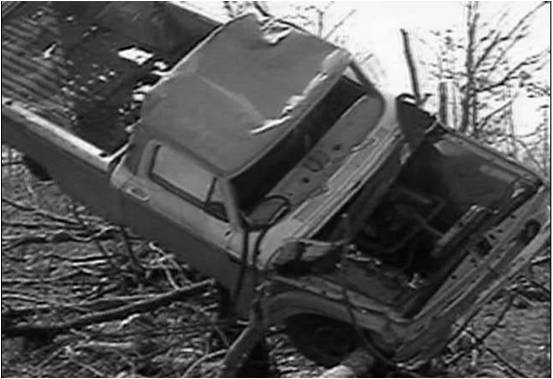
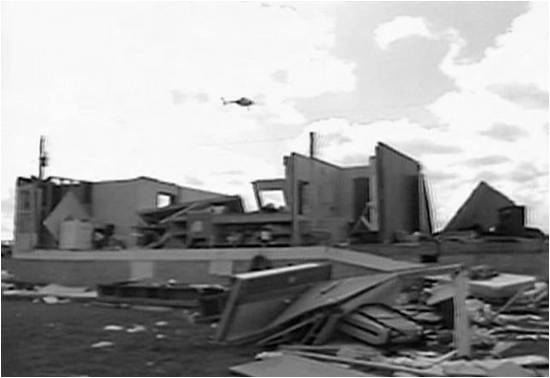
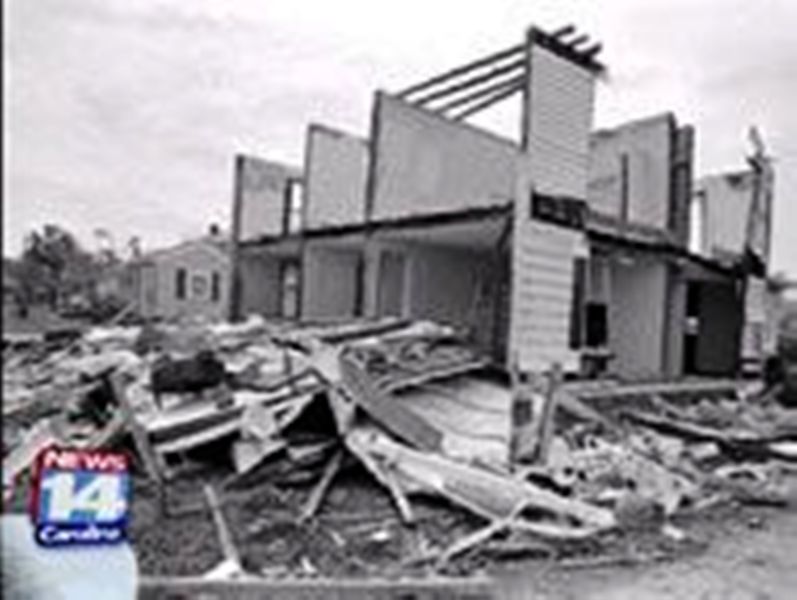
Photos
(courtesy WRAL-TV and News 14 Carolina)


Case Study Team:
Chris Collins


 Map View
 Weather Hazard Briefing (when applicable)
 Forecaster Discussion
 Marine
 Text Products
.png) Skywarn
Skywarn Submit Storm Reports
 Coastal Flood
.png) Surf Forecast/Rip Currents
Surf Forecast/Rip Currents