Event Overview
Several strong to severe thunderstorms impacted eastern North Carolina during the late afternoon and evening hours of July 17, 2009. The storms developed in an unstable air mass ahead of a slow moving frontal boundary. Deep convection was initiated and sustained over the area due to a variety of factors. These factors included colliding sea breeze and outflow boundaries, prefrontal troughing, good upper level support, and sufficient wind shear.
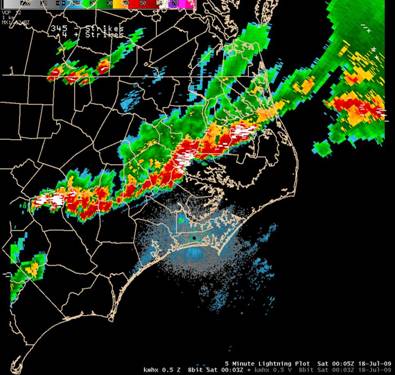
Figure 1. 0.5 degree base reflectivity and lightning plot from KMHX at
8:05pm EDT July 17, 2009 showing quasi-linear convective system
(QLCS) impacting the region.
Synoptic and Mesoscale Overview
A cold front approached from the west slowly during the late afternoon and evening hours of July 17, 2009, as a well defined mid to upper level short wave passed north of the region. Ahead of the front a trough developed over central North Carolina with very unstable air across eastern North Carolina as temperatures climbed into the upper 80s and lower 90s with dewpoints well into the 70s. MSAS and
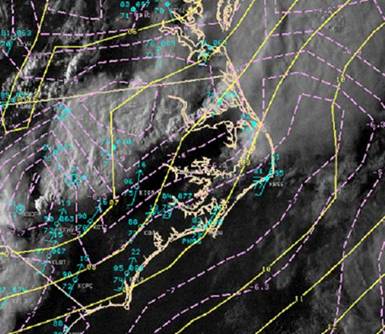
Figure 2. Visible satellite imagery with MSAS mean sea level pressures
(mb in yellow) and lifted indices (C in pink).
The mid level short wave passing north of the region helped increase mid level winds resulting in 0-6km shear values in the 30 to 35 knot range (Figure 3), in addition to providing lift through positive vorticity advection. The combination of strong instability and moderate shear was favorable for storm organization and
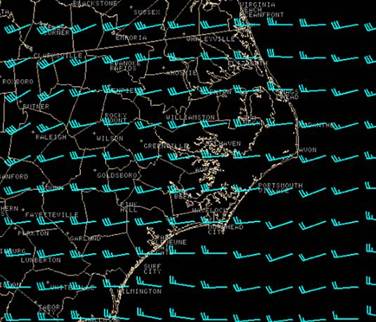
Figure 3. NAM12 0-6km bulk shear vectors.
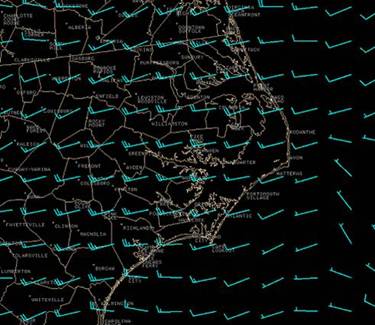
Figure 4. NAM12 0-1km shear vectors.
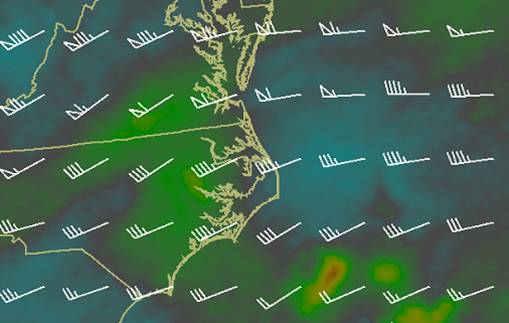
Figure 5. NAM12 250mb winds and divergence (shaded). Green and yellow colors
are divergent and blue values are convergent. Note the upper level divergence maxima
near little Washington.
RADAR and Warning Overview
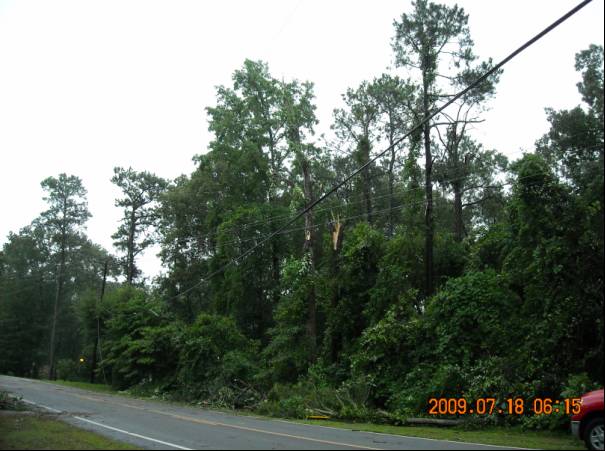
Scattered thunderstorms began to develop inland from the coast during the mid afternoon hours as along the sea breeze/resultant boundary near Highway 17. One small storm with a decent 55-65dbz core developed over central Onslow county and blew the top off a pine tree NE of Jacksonville. This was the only missed event of the day. Other thunderstorms began to intensify in Beaufort County and one developed supercell characteristics with a fat hook or kidney bean shape with some decent low level rotation. A tornado warning was issued for this storm given the above mentioned environment and due to its radar characteristics. This storm produced a weak tornado east of Washington where some minor damage was reported.
A more organized broken line of storms along a prefrontal trough then began to move
As the above mentioned cell moved across eastern Pitt and into extreme western Beaufort County (Figure 6) some low level rotation began to develop along the leading edge of the low level gust front. Initially these rotational couplets were weak and we held off on issuing a tornado warning. Eventually the couplets strengthened a bit (Figure 7) and were also moving east into lower LCL heights. Based on this, a tornado warning was immediately issued.
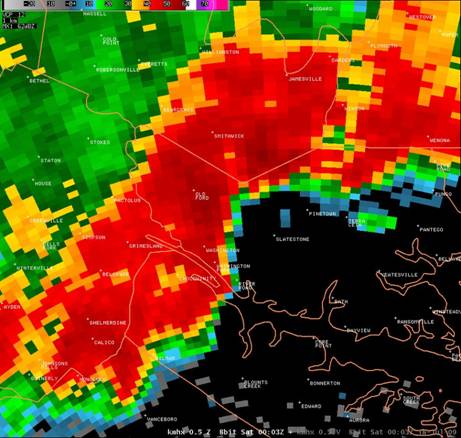
Figure 6. 0.5 degree reflectivity from 8:03pm
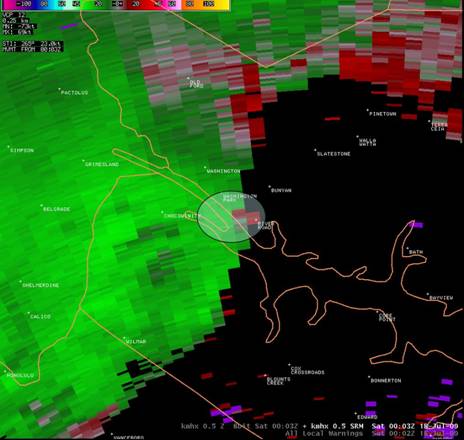
Figure 7. 0.5 degree storm relative velocity from 8:03pm
WSR-88D. Shaded circle represents rotational couplet responsible for EF-0 tornado
5 miles SE of Washington.
Damage Survey and Reports
The July 17, 2009 severe weather outbreak led to 2 confirmed tornadoes and 5 reports of damaging winds in the WFO
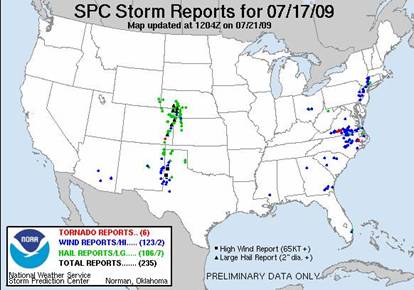
Figure 8.
Damage Pictures from Beaufort County: July 17, 2009
Photos Courtesy of John Pack, Beaufort County Emergency Manager.


 Map View
 Weather Hazard Briefing (when applicable)
 Forecaster Discussion
 Marine
 Text Products
.png) Skywarn
Skywarn Submit Storm Reports
 Coastal Flood
.png) Surf Forecast/Rip Currents
Surf Forecast/Rip Currents