Event Overview
A potent storm system wreaking havoc across the southern US Sunday January 9th, 2011 tracked to the southeast by early on the 10th leaving in its wake several inches of snow and ice accumulation (Figure 1). On the morning of Monday January 10th, 2011 much of southeastern NC woke up to a winter wonderland. By Monday evening, there were several inches of snow on the ground across Duplin, Onslow, southern Jones and Carteret County. A transition to freezing rain occurred Monday night into Tuesday making travel extremely hazardous, especially across interior portions of NC. By Tuesday, the precipitation moved north as the low tracked toward New England dumping over a foot of snow in portions of NY, MA and CT.
An unusual occurrence, the southern portions of the CWA received the highest snowfall accumulations, while the northern counties barely received a trace (Figure 2). The anomalous nature of this event and the forecast challenges are highlighted below.

Figure 1. Visible Satellite Image of the Southeast on Wednesday morning (1545Z). After 48 hours, snow is still visible across northern sections of Alabama, Mississippi, Georgia and much of the Carolina’s.
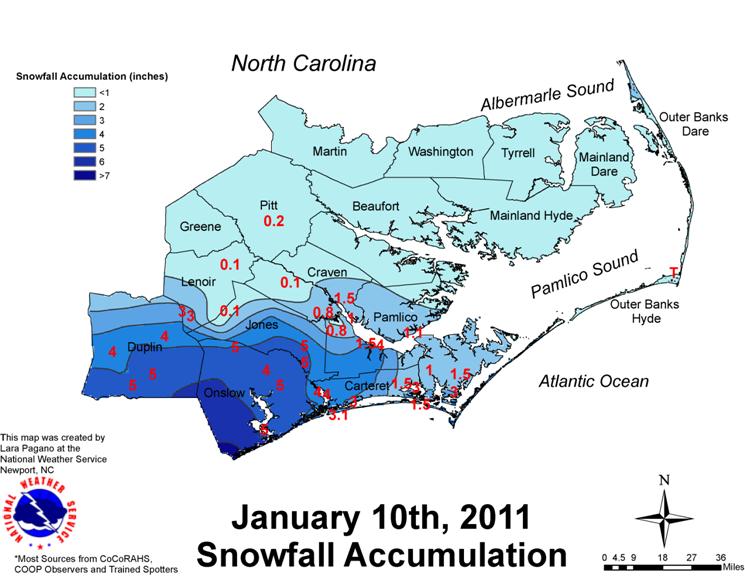
Figure 2. Snowfall Accumulation Map. Duplin, Onslow, Jones and portions of Carteret Counties received the highest snowfall amounts ranging from a Trace to >5” on Monday January10th, 2011.
Forecaster Challenges
1. The strength and location of the apparent High Pressure across Eastern NC… This can have an impact on precipitation type and low level saturation.
2. Precipitation Banding… This will ultimately impact precipitation rates that will aid in saturating the lower levels…therefore increasing snowfall amount.
3. Unusual Synoptic Pattern… This challenged forecaster’s ability to draw from previous experience.
Synoptic and Mesoscale Overview
Precursor: Saturday through Sunday, January 8th-9th, 2011…
On Saturday January 8th, 2011 a cold front crossed the Carolina’s with Canadian High Pressure beginning to build in from the NW (Figure 3). On the evening of January 9th, 2011 the cold High Pressure over the Great Lakes region built south across much of the Mid-Atlantic and southeast with cyclone formation off the Texas coast (Figure 4). Although the surface low was weakening as it migrated eastward along the Gulf Coast region, the mid and upper level pattern (with a negatively tilted trough across the central US) was able to provide sufficient lift north of the system (Figure 5 and Figure 6). The mid and upper level divergence observed across AL, MS and GA late Sunday night and early Monday morning coincided well with the observed wintery precipitation (Figure 7). In addition, with cold high pressure in place across the south and moist southerly flow moving north ahead of the surface low, a winter storm started to take shape for much of the southeast. While snow was falling in many locations, parts of Mississippi and Alabama were experiencing icy conditions late Sunday evening. Near the surface, before the storm had approached the Carolina’s, the low levels had a sufficient temperature gradient between the southern states (AL, MS, LS and GA) and the Carolina’s with a fairly deep layer of CAA keeping temperatures at or below freezing (Figure 8). This layer can also be seen in the 00Z RAOB at MHX (Figure 9). Also, based on this profile precipitable water was less than a quarter of an inch. Apart from this limitation, the temperature and upper atmospheric dynamics were suitable for winter weather development. However, the main questions plaguing forecasters at this time were the onset of precipitation (low level saturation) and low level cold pool stabilization (blocking high pressure).

Figure 3. A cold front crossed the East Coast on Saturday leaving a residual frontal boundary draped across the Gulf of America Saturday evening (00Z Sunday). This stationary boundary combined with mid/upper level forcing helped to promote cyclogenesis along the Gulf Coast region Sunday.
Figure 4. A strong 1030mb High Pressure across the Great Lakes region builds down across the southeast Sunday afternoon with a cyclone developing off the Texas coast.
Figure 5. Pressure continues to build across the eastern CONUS by Sunday evening with a 1032mb High dropping south into the Carolina’s. The weakening low pressure (now 1008mb) along the Gulf Coast continues to migrate eastward. Note the large dew point depressions across the Carolina’s.
Figure 6. The deep southern stream jet with a negatively tilted trough draped from the NW to the Gulf Coast region continued to pivot to the east with the left entrance of the jet collocated with the surface cyclone. The majority of the upper level divergence was well correlated with the precipitation shield.
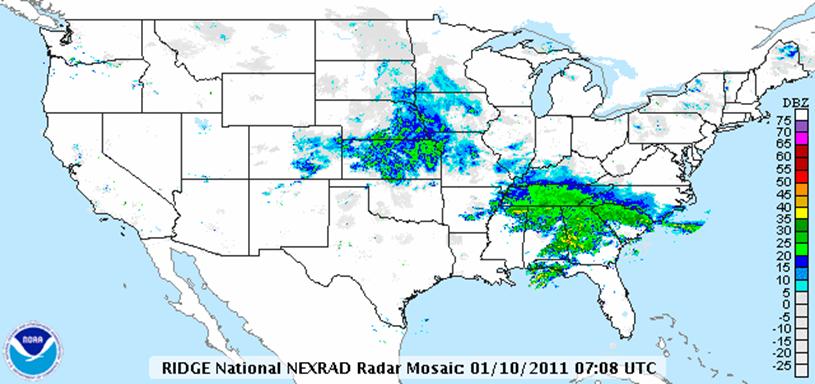
Figure 7. National Radar Mosaic Sunday overnight period (07Z Monday) with northern portions of AL, MS and Georgia receiving several inches of snow and ice. Much of the moisture observed across the Carolina’s was not reaching the ground due to lack of upper level forcing and low level dry air.
Figure 8. At the low levels, there is an impressive temperature gradient between the southern states and the Carolina’s thanks in part to the deep layer of northerly winds still in place across much of the Mid-Atlantic region. Surface high pressure also influenced the CAA in place across eastern NC.
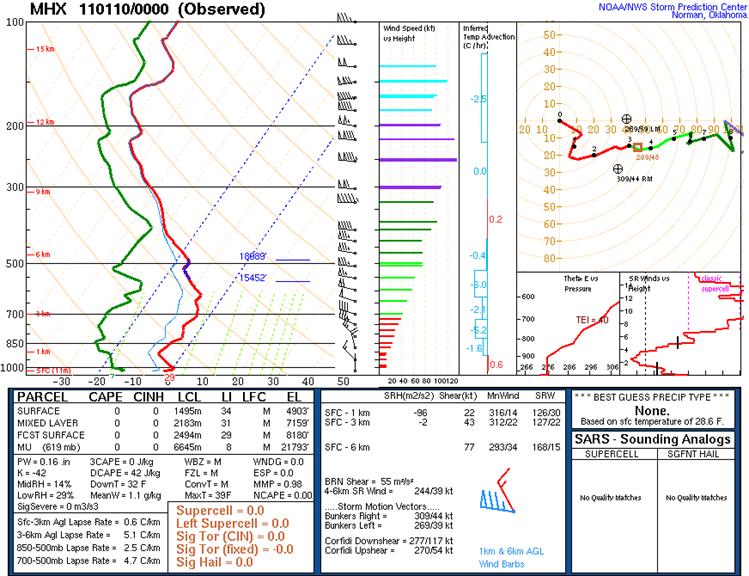
Figure 9. Based on the atmospheric sounding taken on Sunday night (00Z Monday), the mid and lower levels were dry with plenty of cold air in place. While the dry air was a limitation (precipitable waters around 0.16”), evaporative cooling helped lower temperatures as the atmosphere moistened with time.
Snow Event: Monday through Early Tuesday, January 10th-11th, 2011…
The unusual nature of this storm resided in both the northerly advection of precipitation ahead of the surface low and the zonal nature of the mid level flow (Figure 10). This made forecasting even more challenging as past event analogs were not able to be utilized.
The first reflectivities moved into the region early Monday morning (Figure 11). However, near surface conditions were fairly dry due to the strong 1030mb high pressure across the region (Figure 12). By 12Z, the upper level jet was across the Carolina’s with the left entrance region collocated with the 1010mb surface low offshore of the Florida Panhandle (Figure 13 and Figure 14). With heavier bands developing inland, low level saturation started to become realized across much of South Carolina and southern NC. A heavier band of reflectivity developed from West to East in the southern portion of the County Warning Area with heavier precipitation rates occurring at or just above the surface allowing low level saturation to increase more rapidly (Figure 15). This banding was predominately fueled by mid level vorticity (Figure 16). Snow inland and a wintery mix along the immediate coast quickly developed Monday morning. Surprisingly, no frontgenesis was noted, at least based on model output. The orientation of the snow band helped to promote higher precipitation rates while ultimately impacting the snowfall accumulations across Duplin, Onslow, Jones and Carteret Counties. Locations north of HWY-70 did not receive enough low level forcing and moisture initially to drown out the dry air in place near the surface (Figure 17). Therefore, it wasn’t until the late afternoon and evening that those locations received mixed precipitation. Higher reflectivities started propagating north of HWY-70 by Monday late afternoon helping to saturate the lower levels (Figure 18). However, by the time the northern CWA became saturated enough to generate precipitation to the ground, the majority dynamic forcing needed to generate precipitation had diminished and moved offshore. Monday evening, the surface low pressure formed off Georgia coast (Friday 19). Based on the 00Z RAOB sounding on Monday evening, the dendrite zone became unsaturated and the mid to lower levels were beginning to warm above freezing (Figure 20). This atmospheric profile is indicative of wintery precipitation transitioning to freezing rain. Any precipitation that did fall late Monday evening through early Tuesday was a wintery mix across much of the area (especially inland), with mainly freezing rain along the coast. Through the overnight hours much of the dynamic forcing needed to continue precipitation began to diminish in addition to upper level dry air intrusion. The surface low continued to move NE along the eastern seaboard eventually phasing with a potent upper level system which wreaked havoc in New England (Figure 21)
Figure 10. The mid level flow became more zonal across the Carolina’s by early Monday morning (12Z). The once amplified trough across central US became deamplified allowing the surface low to continue to weaken.
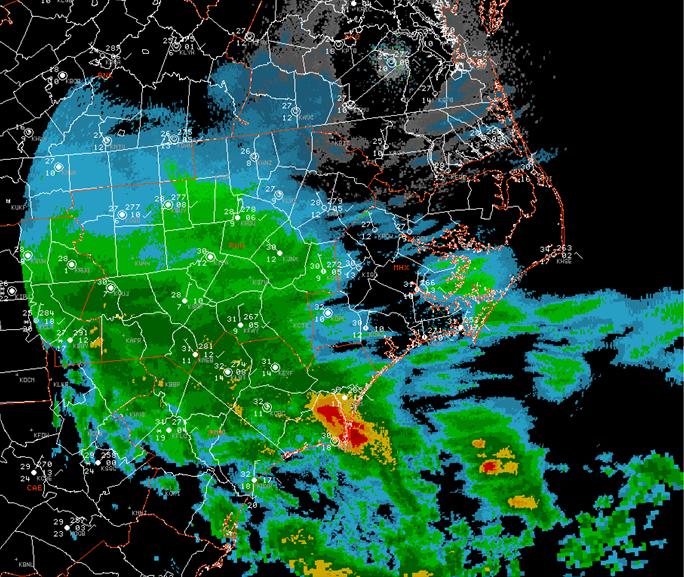
Figure 11. Composite reflectivity early Monday morning (09Z) with no reports of snow across most of NC and SC. However note the higher reflectivities moving across southeastern NC.
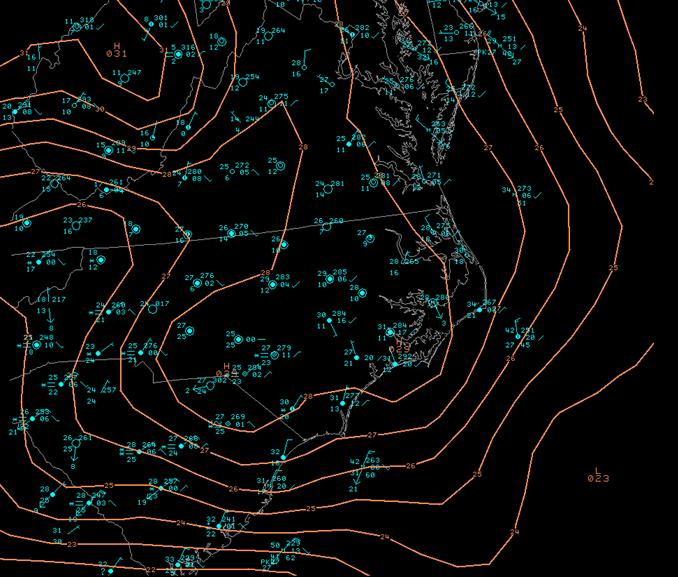
Figure 12. Surface high pressure building in across eastern NC Monday morning (12Z) keeps temperature low with dry conditions observed near the surface. Snow is falling across SC where a weaker high pressure gradient is in place.
Figure 13. Upper level jet stream moving NE has limited directional divergence. However, speed divergence is observed across Georgia and the Carolina’s with the left entrance region collocated with the surface low.
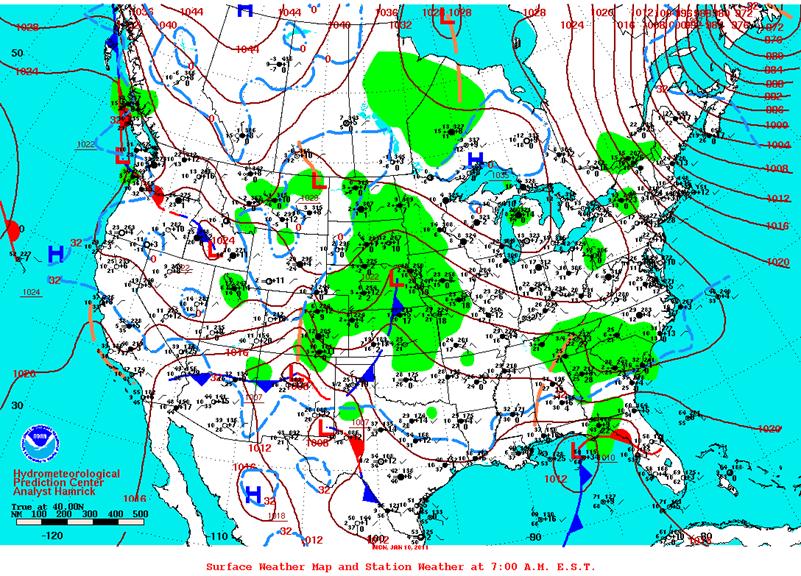
Figure 14. A surface low continues to move eastward south of the Florida Panhandle.
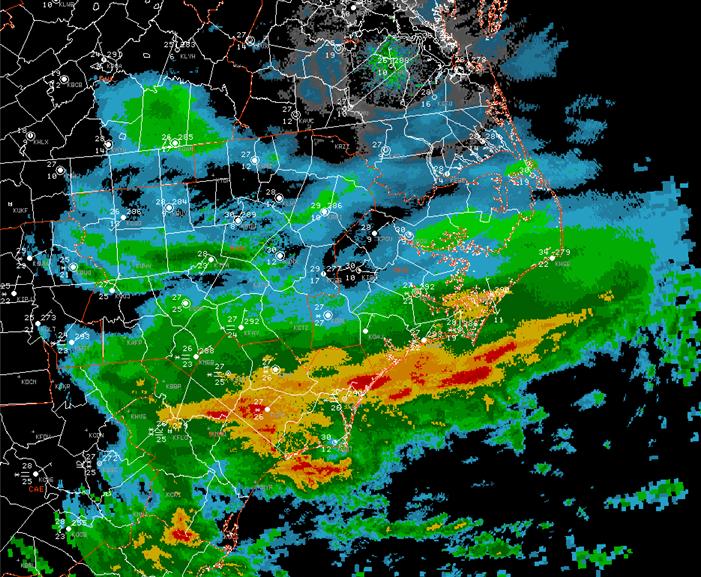
Figure 15. Composite reflectivity Monday morning (13Z) illustrates banding across SE NC. With heavier precipitation, low levels became saturated and snow was falling across most of Wilmington’s CWA.
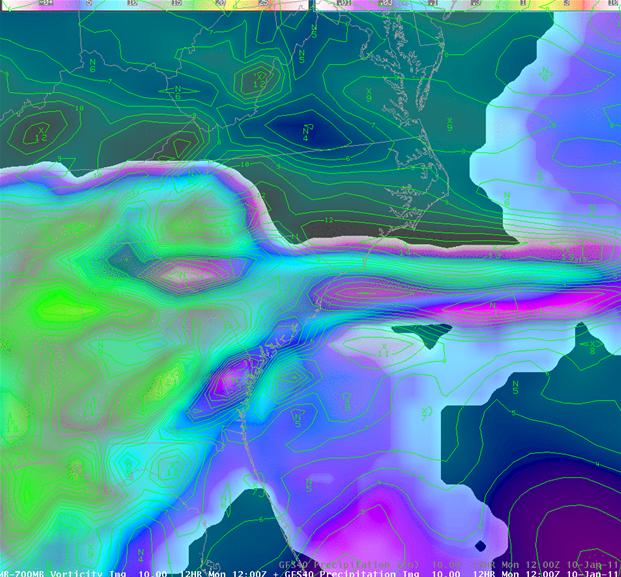
Figure 16. The 00Z GFS Sunday evening illustrates precipitation banding across southeastern NC with vorticity maxima (850mb-700mb layer) collocated with the heavier precipitation.
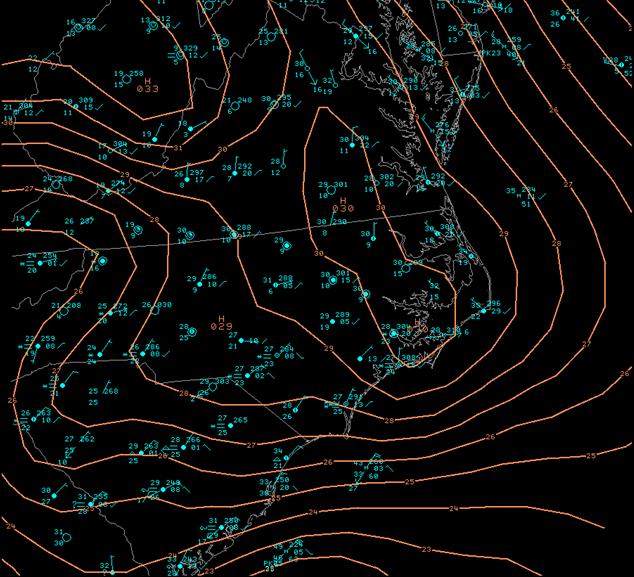
Figure 17. Surface analysis illustrates strong high pressure in control over much of eastern NC with dew very low dew points across central and northeast NC.
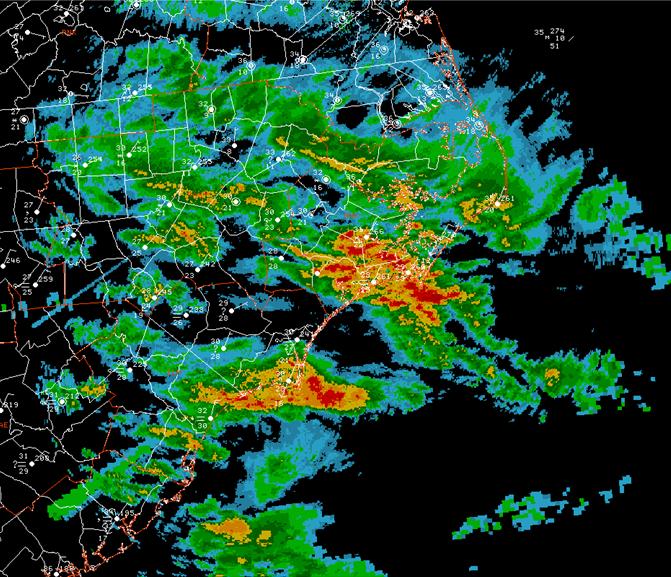
Figure 18. Composite reflectivity Monday afternoon (22Z) illustrates heavier precipitation moving north helping to saturate the lower levels across northeastern NC.
Figure 19. Surface analysis of the surface low moving off the SE coast with high pressure eroding along the Eastern CONUS.
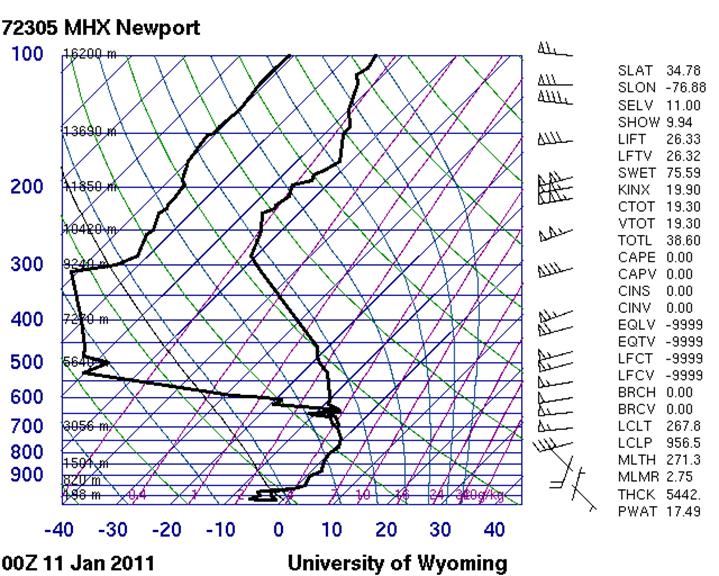
Figure 20. 00Z Monday RAOB sounding at MHX suggests mid to upper level drying of the dendrite zone (most commonly referred to as the -10- -20 degree C layer). With warming in the mid levels as illustrated with warming above freezing between 925mb-800mb and below freezing conditions near the surface, sleet and freezing rain will develop.
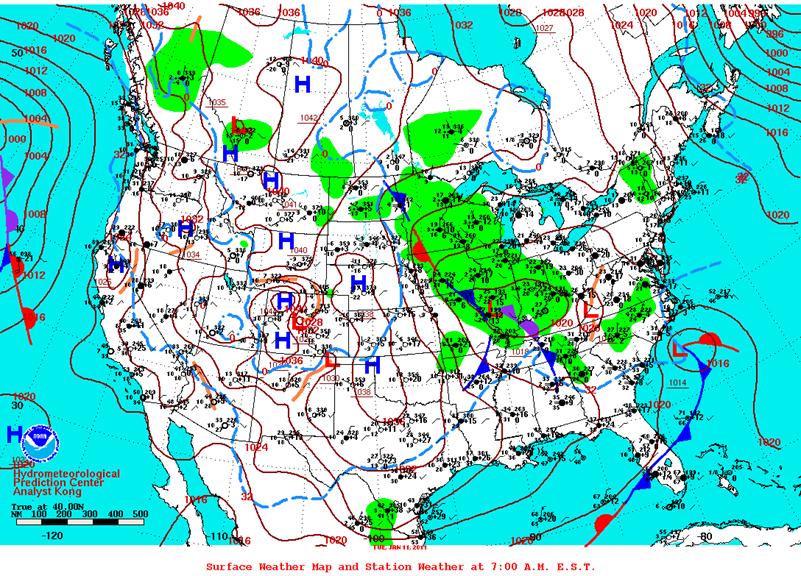
Figure 21. Surface analysis shows the surface low off the Carolina coast early Tuesday morning with precipitation inland and to the north.
Snowfall Pictures from Onslow County
Photos courtesy of: Beverly Smith, Mike McMahan, Theresa Dixon, Janay Thomas, Susanne Leone, Tom Martin
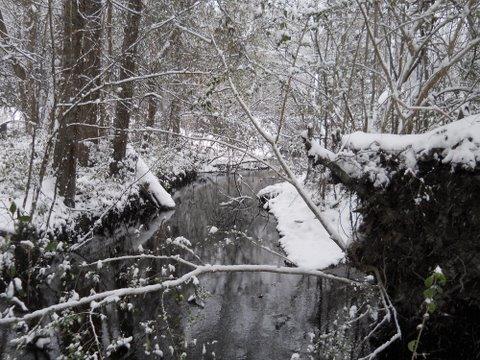
Figure 22. Hubert, NC

Figure 23. Jacksonville, NC
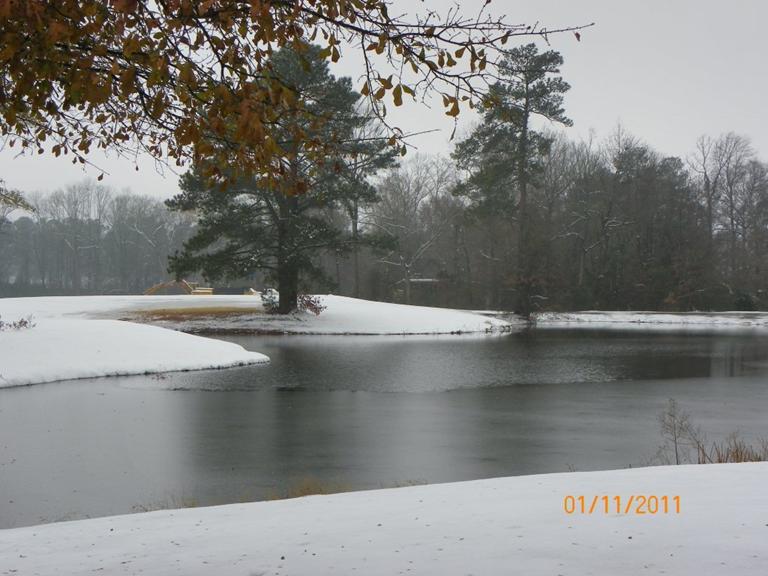
Figure 24. Jacksonville, NC (10am)
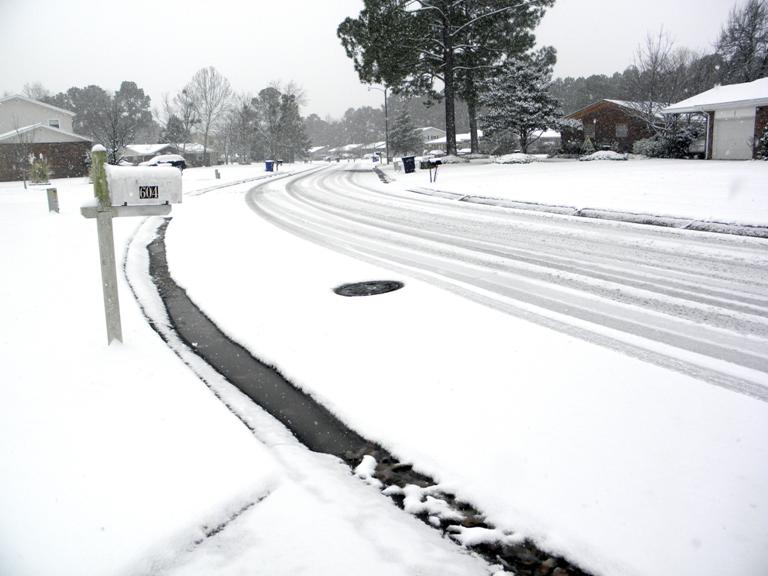
Figure 25. Jacksonville, NC
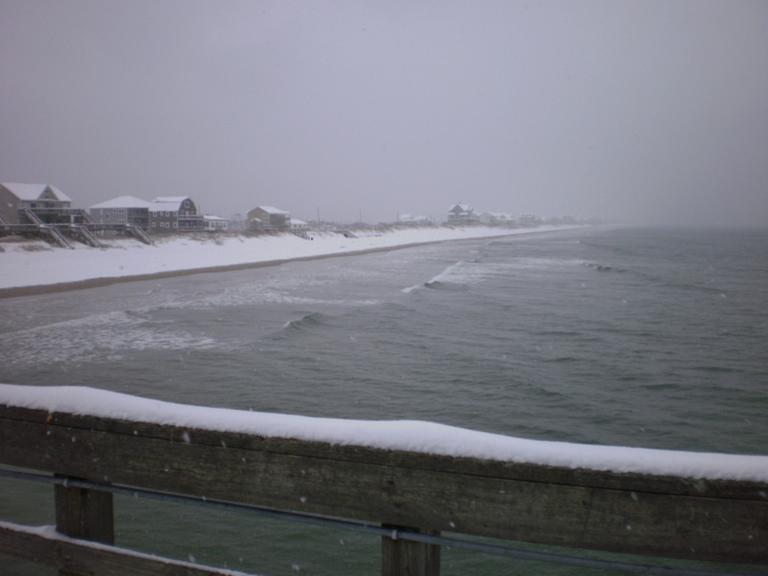
Figure 26. North Topsail, NC
Snowfall Pictures from Greene County
Photos courtesy of: Susan Bowen
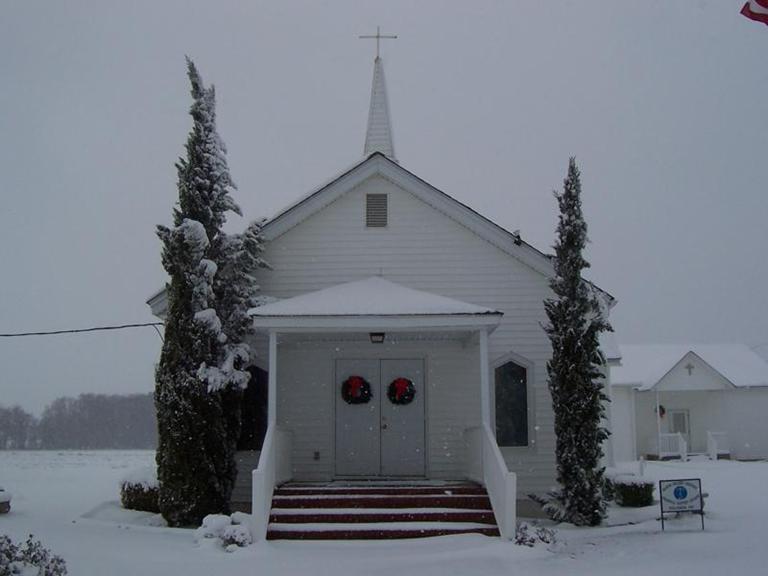
Figure 27. Ormondsville, NC
Snowfall Pictures from Carteret County
Photos courtesy of: C.F. Gabriel, Kathy Ruge, Brian Harrell
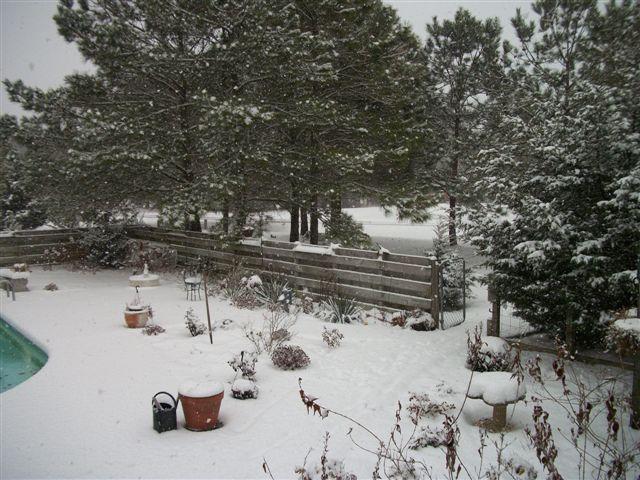
Figure 28. Bogue, NC
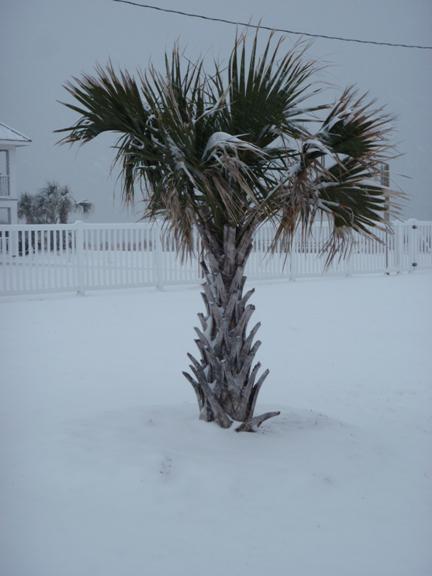
Figure 29. Emerald Isle, NC
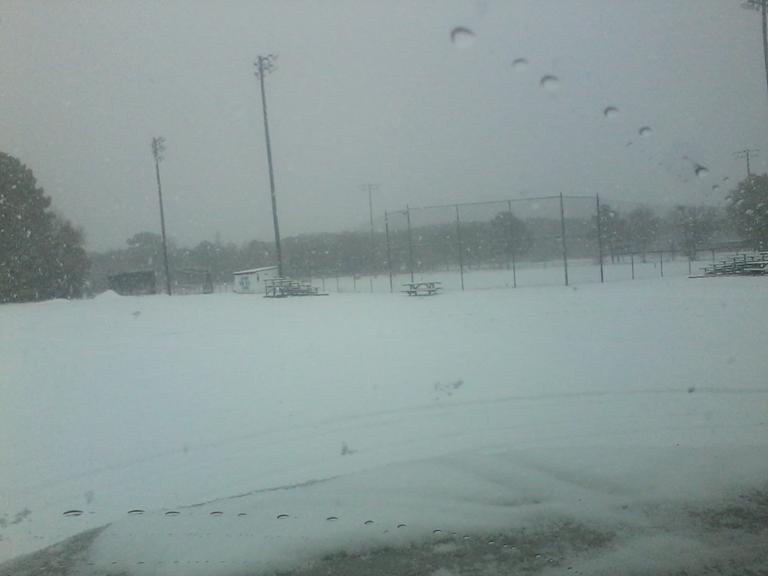
Figure 30. Newport, NC
Snowfall Pictures from Duplin County
Photos courtesy of: Rose Rocker
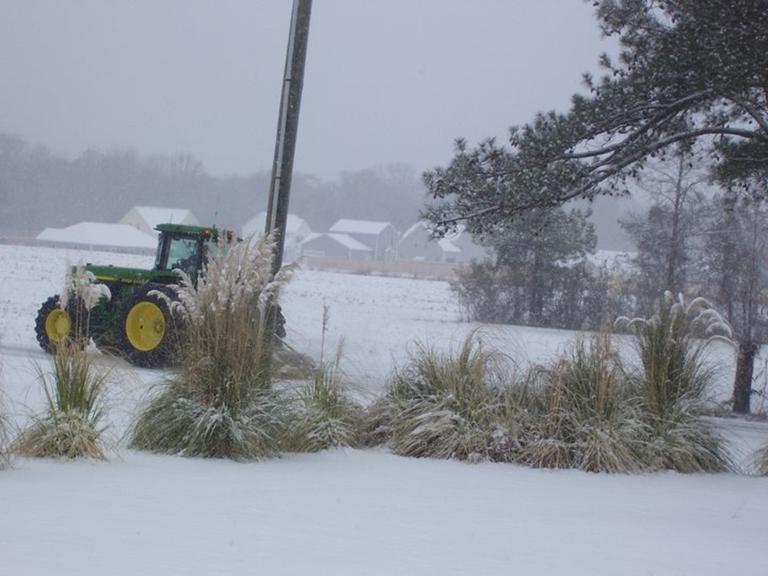
Figure 31. Richlands, NC
Case Study Team:
Lara Pagano
David Glenn


 Map View
 Weather Hazard Briefing (when applicable)
 Forecaster Discussion
 Marine
 Text Products
.png) Skywarn
Skywarn Submit Storm Reports
 Coastal Flood
.png) Surf Forecast/Rip Currents
Surf Forecast/Rip Currents