Event Overview
On the morning of January 9, 2004, a vigorous shortwave and surface low pressure system off of the NC/SC coast produced
widespread precipitation in the form of snow over most of Central and Eastern North Carolina (Figure 1). At Cherry Point, NC,
snow began at 0820 UTC. The snow mixed with rain and sleet for a few hours, then turned back to snow and ended at 2055 UTC.
Snow totals across the NWS Newport/Morehead City county warning area ranged from around 2" in counties to the north and west
(Greene, Pitt, Martin, Lenoir, Jones, Duplin counties) to a dusting in coastal communities (Craven and Carteret counties). A visible
satellite image of the snowfall across North Carolina can be seen in Figure 7.
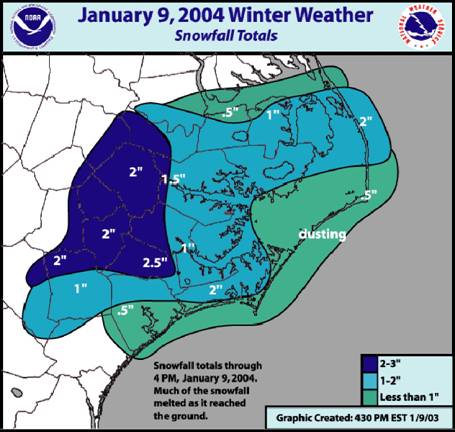
Figure 1. Preliminary Snowfall Totals in NWS MHX's County Warning Area.
Synoptic Overview
The longwave pattern over the U.S. just before the event occurred was characteristic of a highly amplified meridional pattern, with
pronounced ridging over the Western U.S. and pronounced troughing in the Eastern U.S. (Figure 2). In the East, a shortwave was
located over KY, TN and IN. At the surface, a 1041 mb high was located in SE Canada (just north of the Great Lakes), and a 1025
mb high was located along coastal VA (Figure 3). These surface high pressure systems provided the ingredients necessary for a
Cold Air Damming (CAD) event to setup in the Mid-Atlantic. Surface conditions in the Mid-Atlantic states at the time the event began
were characteristic of the classic CAD ridging over the region. Cloudy skies and temperatures ranging from the upper 20s to mid
30s prevailed over most of North Carolina (Figure 4). Critical thicknesses over North Carolina at the beginning of the event showed
a wedge cold enough to support all snow in central NC and a mix of precipitation further to the south and east in coastal NC (Figure 5).
Figure 2. 1200 UTC January 9, 2004 500mb Height (Eta 12 UTC Analysis) - Shortwave over TN/KY
approaches North Carolina.
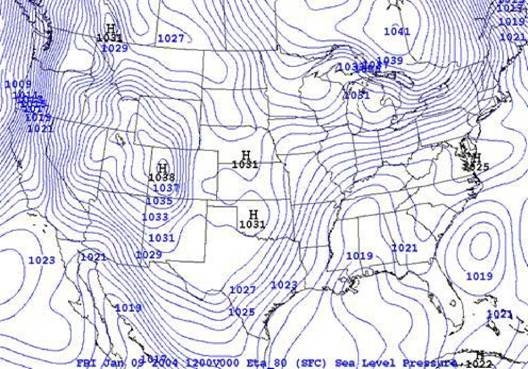
Figure 3. 1200 UTC January 9, 2004 MSLP (Eta 12 UTC Analysis) - Surface Low off of the North Carolina
coast. Also note CAD signature over Central North/South Carolina and Georgia.
Figure 4. 1200 UTC January 9, 2004 Surface Observations.
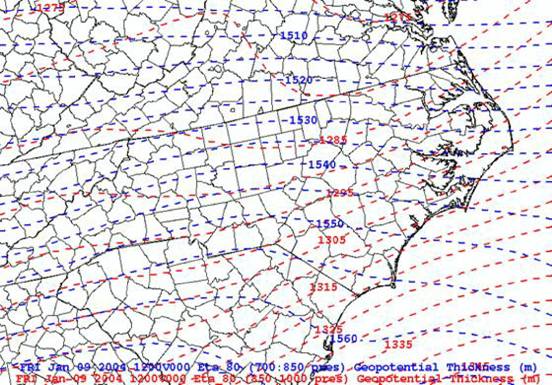
Figure 5.1200 UTC January 9, 2004 (Eta 12 UTC Analysis) - 1000/850 and 850/700 mb Thicknesses.
Summary
It appears that the 500 mb shortwave (Figure 2) was most responsible for the swath of precipitation over Central/Eastern North
Carolina as the lift ahead of it crossed the area in the morning and early afternoon hours. The surface low (Figure 3) does not
appear to have significantly contributed to the amount of precipitation over Eastern North Carolina. The low stayed well offshore
and helped to reinforce flow from the North and NE over Eastern NC. The result - most of the precipitation associated with the
surface low stayed offshore. Note that the CAD signature over NC/SC/GA in Figure 3 actually extends as far south as Northern
FL! Warmer temperatures at the surface and aloft along the coast (mid 30s) (Figure 4) and the mix over to rain and sleet for a
period of the event significantly decreased potential snow accumulations over the Havelock/New Bern/Newport/Morehead City
area. Consequently, a dusting (Figure 6) of accumulation was observed in these areas when 1 or 2" of accumulation would have
been observed if the entire event had been snow. Looking at Figure 5 above, it can be seen that the thicknesses near the coast
supported mixed precipitation while the thicknesses in Central NC supported all snow.
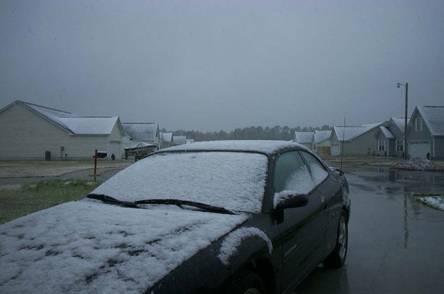
Figure 6.Snowfall in Havelock, NC on January 9, 2004 (Picture taken by Brandon Vincent).
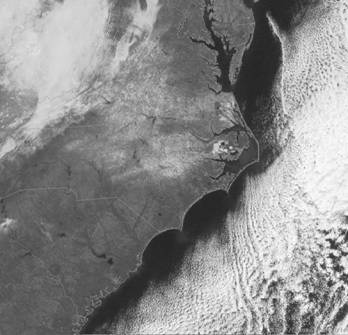
Figure 7.1600 UTC January 11, 2004 Visible Satellite Image of Snowfall over Central/Eastern NC.


 Map View
 Weather Hazard Briefing (when applicable)
 Forecaster Discussion
 Marine
 Text Products
.png) Skywarn
Skywarn Submit Storm Reports
 Coastal Flood
.png) Surf Forecast/Rip Currents
Surf Forecast/Rip Currents