Event Overview
On Sunday December 26th, 2010, residents across Eastern North Carolina awoke to several inches of snow on the ground, a rare occurrence just one day after Christmas (Figure 1). Snow continued to fall throughout the day Sunday with many counties along and west of Highway 17 reporting six to eight inches of snow (Figure 2). Widespread snowfall was a result of a developing coastal low pressure system in close proximity to the NC/SC coastline (Figure 3) and a strong, large amplitude, upper level trough digging south across the eastern U.S. (Figure 4). This event was the third winter weather event to impact the state in a month with every NC county reporting measurable snowfall from this storm.
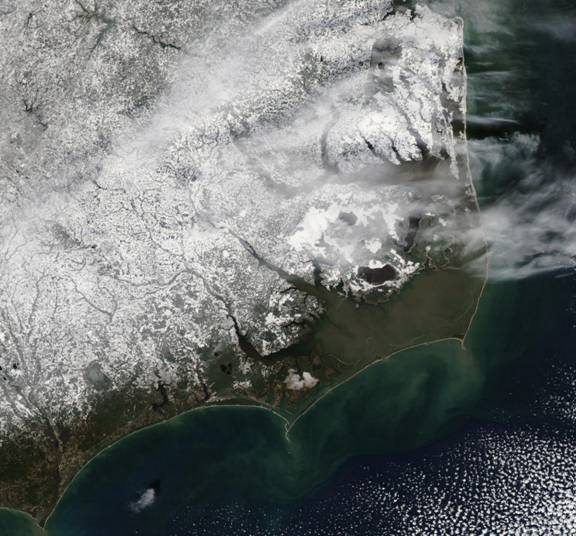
Figure 1: December 27th, 2010 MODIS-AQUA image of snow on the ground (https://rapidfire.sci.gsfc.nasa.gov/realtime/single.php?2010361/crefl2_143.A2010361181500-2010361182000.250m.jpg).
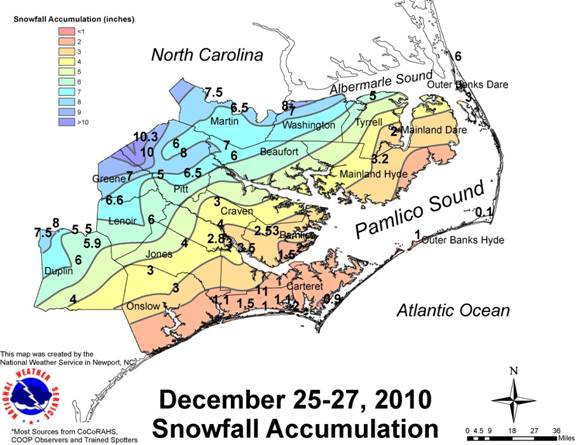
Figure 2: Eastern North Carolina snowfall map from December 25-26, 2010.
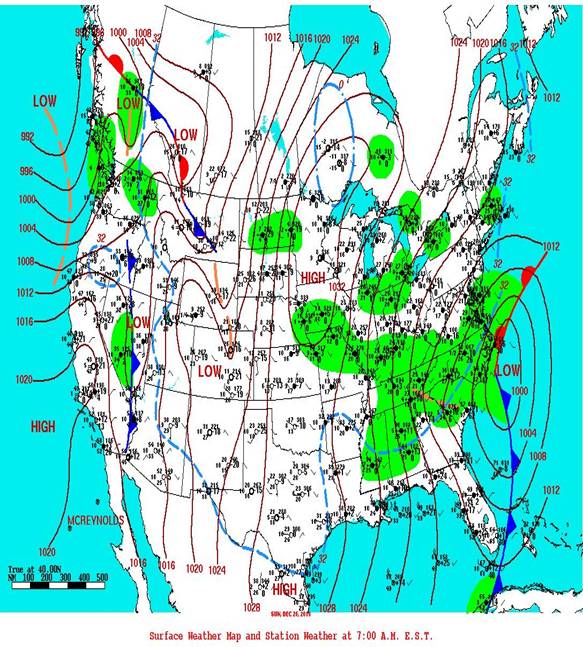
Figure 3: Hydrometeorological Prediction Center surface map for December 26th, 2010 at 7 AM EST indicating the developing low pressure system off the Carolina coast. Notice the 32 °F line (dashed light blue) oriented southwest to northeast across eastern North Carolina.
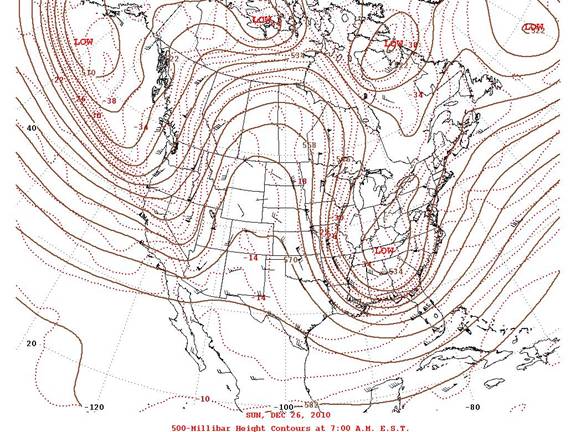
Figure 4: Hydrometeorological Prediction Center 500 millibar chart for December 26th, 2010 at 7 AM EST. Note the very cold air aloft and 540 dm height contour oriented south-southwest to northeast across Eastern NC.
Synoptic and Mesoscale Overview
A. Synoptic Discussion
The upper level pattern was representative of meridional flow with a highly amplified trough centered across the Eastern CONUS (Figure 4). The upper level trough deepened as it crossed the Eastern U.S. At the surface, low pressure developed across the northern Gulf of America on the 24th then pushed northeast across Florida and into the western Atlantic Ocean on the 25th (Figure 5). The coastal low then strengthened down to 993 mb and made its closest approach to Eastern North Carolina around 10 AM EST on the 26th (Figure 6). The synoptic setup was favorable for frozen precipitation given the cold airmass aloft combined with ample moisture support from an intensifying coastal low pressure system.
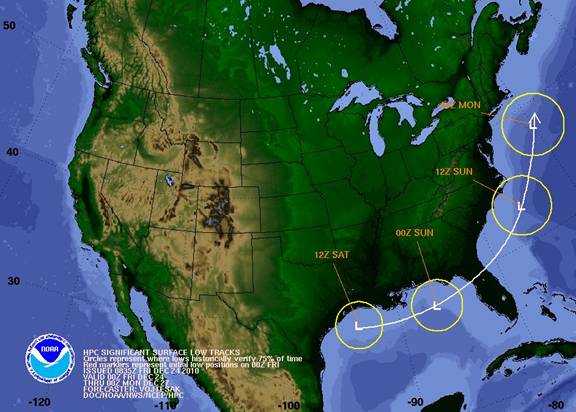
Figure 5: Hydrometeorological Prediction Center’s significant surface low tracks issued at 0835Z Friday morning, December 24th. The actual track was a little closer to the coast which is within the circle of uncertainty shown at 12Z Sunday.

Figure 6: MSAS mean sea level pressure (green lines) and surface temperature (orange lines) overlaid with METAR and buoy observations at 15Z (10 AM EST) on December 26th. Notice the changeover to all snow occurred across most of eastern North Carolina by this time except for the Outer Banks.
B. Mesoscale Discussion
As is often the case with complex coastal low pressure systems, the amount of storm total snowfall and timing of changing precipitation type depend on the storm’s track. If a storm passes very close to the coast then the transition line from rain to snow pushes farther inland. Conversely, if the storm tracks slightly offshore then the rain/snow line would push closer to the coast. This storm passed about 100 miles off the coast which was far enough for every location to eventually change over to all snow as the low pushed northeast.
For this event the models performed fairly well several days out suggesting light precipitation would first begin as rain or a rain/snow mix across the Coastal Plain counties Christmas night. The GFS model low level thickness values were forecast to change rain over to snow by 7 AM for western portions with a rain/snow mix across central and eastern portions (Figure 7). Note that the 1290 m and 1540m isohypse contours are oriented southwest to northeast across Duplin, Lenoir, Pitt, and Martin counties where the greatest snowfall was observed. Frontogenesis fields are also important forecast tools and often highlight areas of greater precipitation when low level frontogenesis vectors converge (Figure 8).
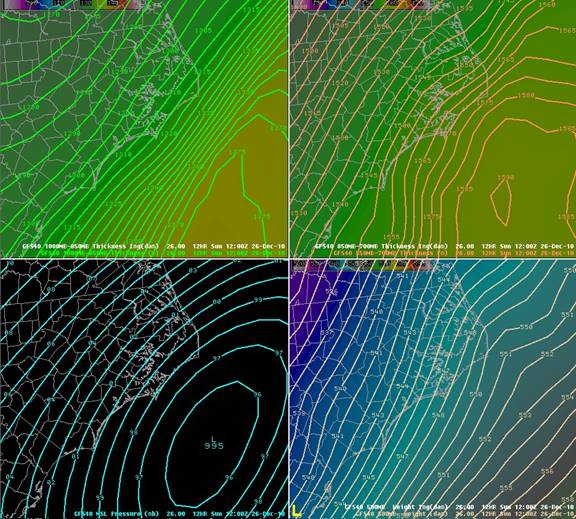
Figure 7: 12 hour GFS forecast of low level thicknesses, mean sea level pressure, and 500 mb height. The top two frames show low level thicknesses of 1000-850 mb (left) and 850-700 mb (right) with critical thicknesses of 1290 and 1540 meters respectively. The bottom two frames illustrate the location and strength of the surface low (left) and upper level trough (right).
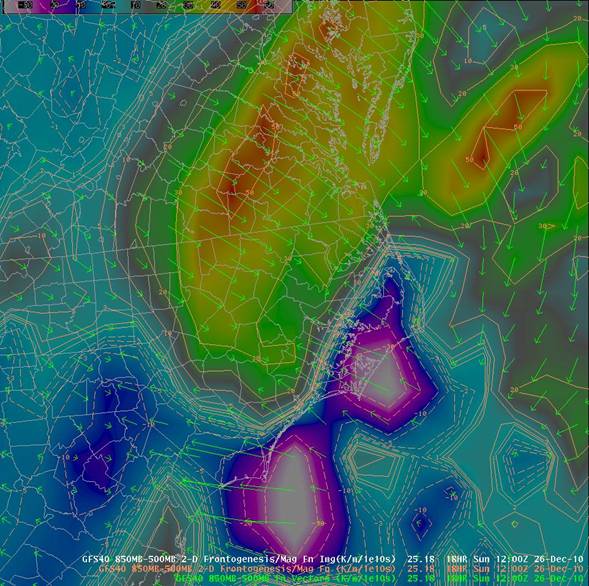
Figure 8: 18 hour GFS 850-500 mb layer frontogenesis and convergence vectors. Note the vectors converge across the Coastal Plain on a line from Duplin County northeast to the NC/VA border where locally higher 7 to 10 inch snowfall was observed.
Observations
Figure 6 above illustrated the surface observations with most locations having transitioned to all snow by 10 AM EST on the 26th. A vertical profile or sounding of temperature and dewpoint also illustrates the changeover process from west to east (Figure 9). By 10 AM EST the Coastal Plain was below zero from the surface aloft while Cape Hatteras reported 42 °F. As the low pushed northeast of the region during the early afternoon the freezing line shifted east (Figure 10). The snowfall map in Figure 2 illustrates the spatial variation of snow from the Coastal Plain to the Outer Banks. Please view the Public Information Statement (Figure 11) for specific snowfall amounts for each county.
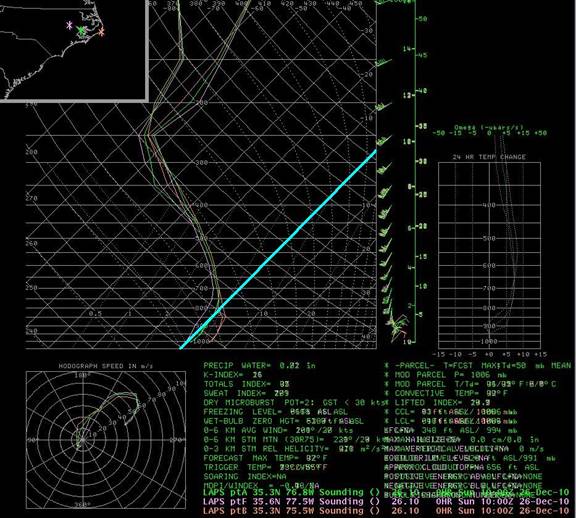
Figure 9: LAPS sounding at 10 Z (5 AM EST) Sunday December 26th. The light blue line marks 0 °C. Notice central and eastern portions of the region were above freezing at the surface (green and orange lines) while the entire column was below freezing in across the Coastal Plain.
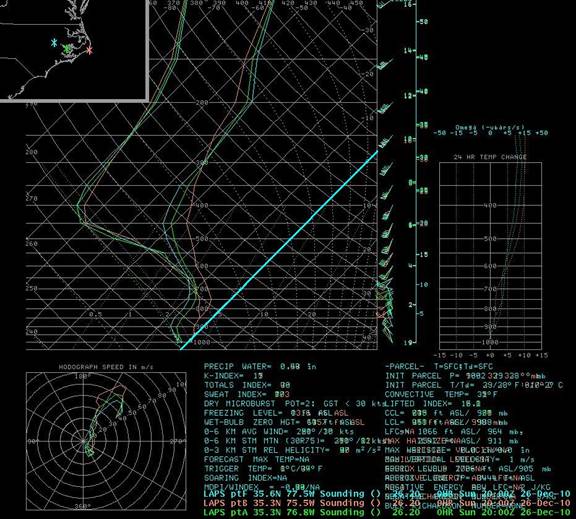
Figure 10: LAPS sounding at 20 Z (3 PM EST) Sunday December 26th. The light blue line marks 0 °C. All locations were at or below freezing by this time.
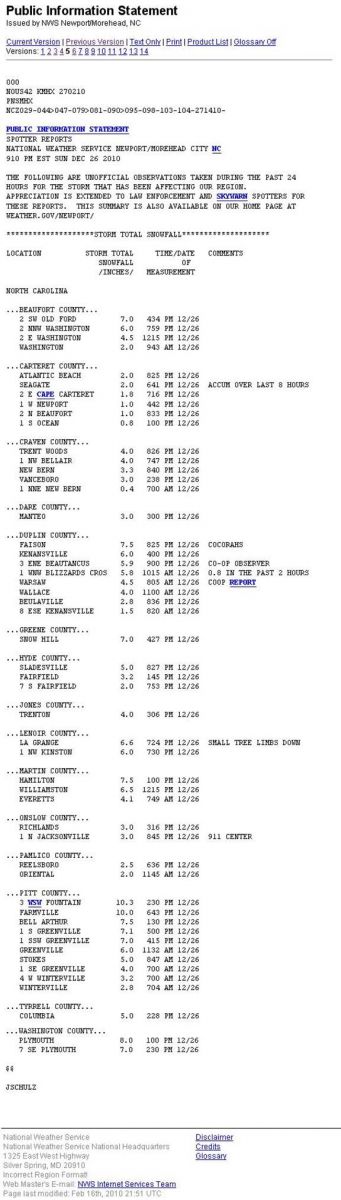
Figure 11: At 9:10 PM EST the NWS Newport/Morehead City issued a Public Information Statement for storm total snowfall amounts across the region. Notice the variability across the more populated counties of Beaufort, Carteret, Craven, Duplin, and Pitt counties.
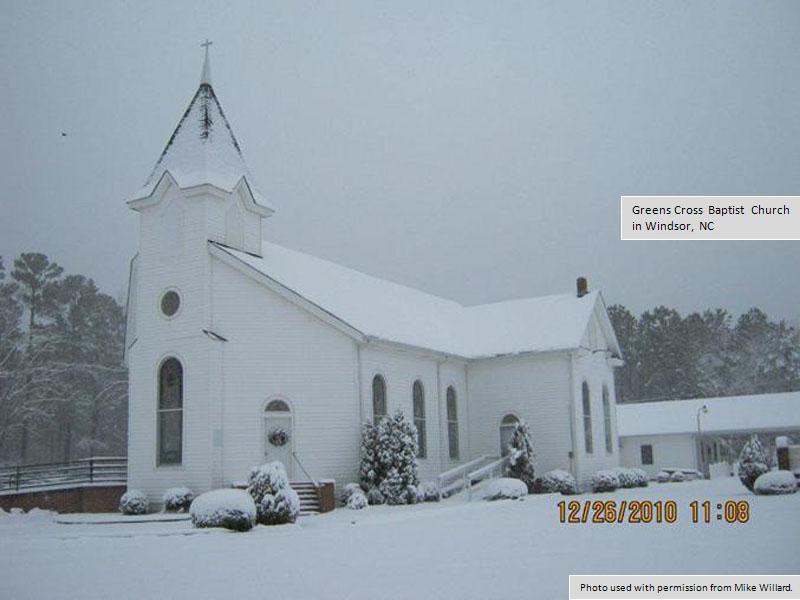
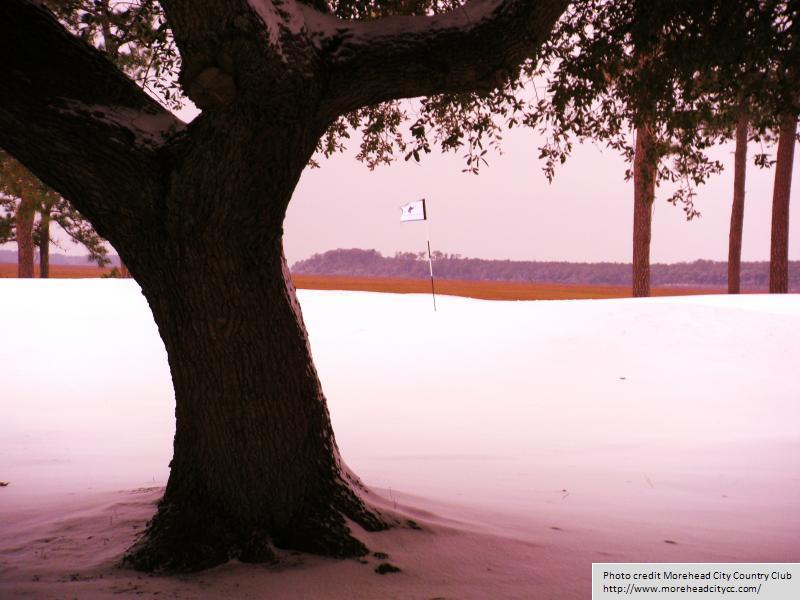
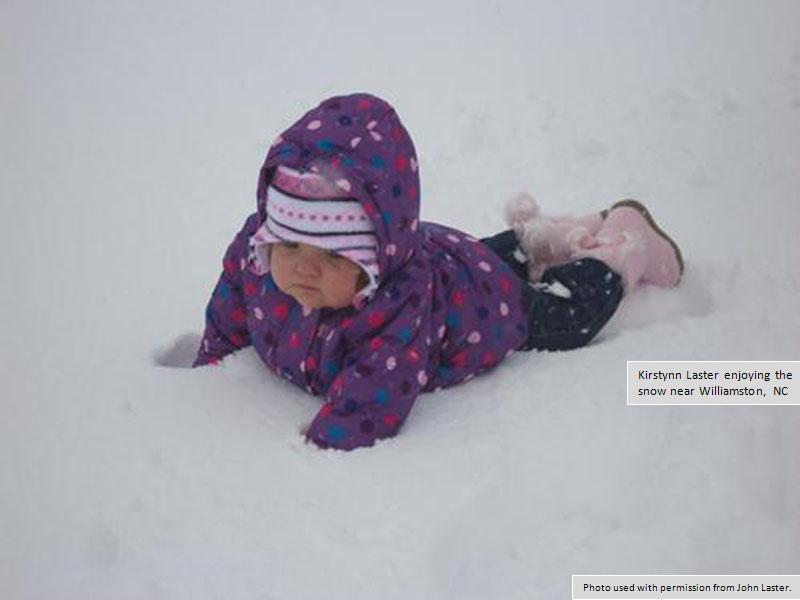
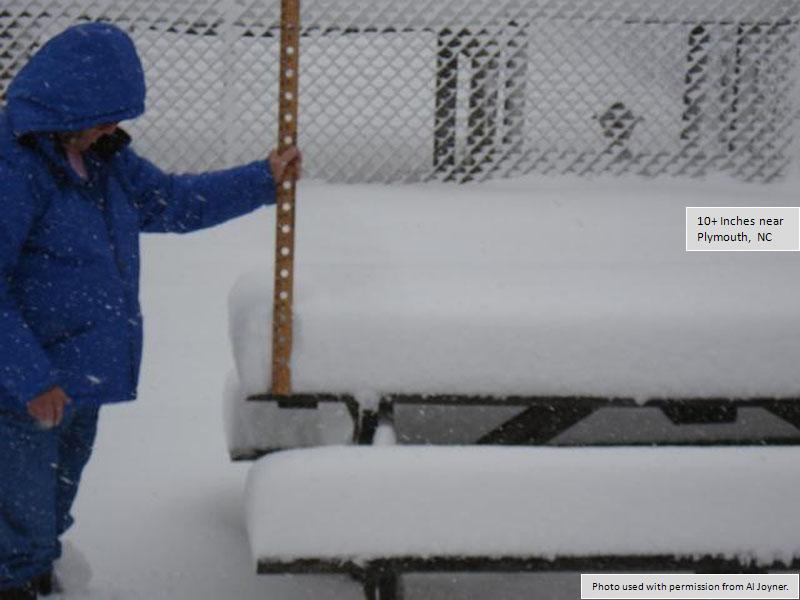
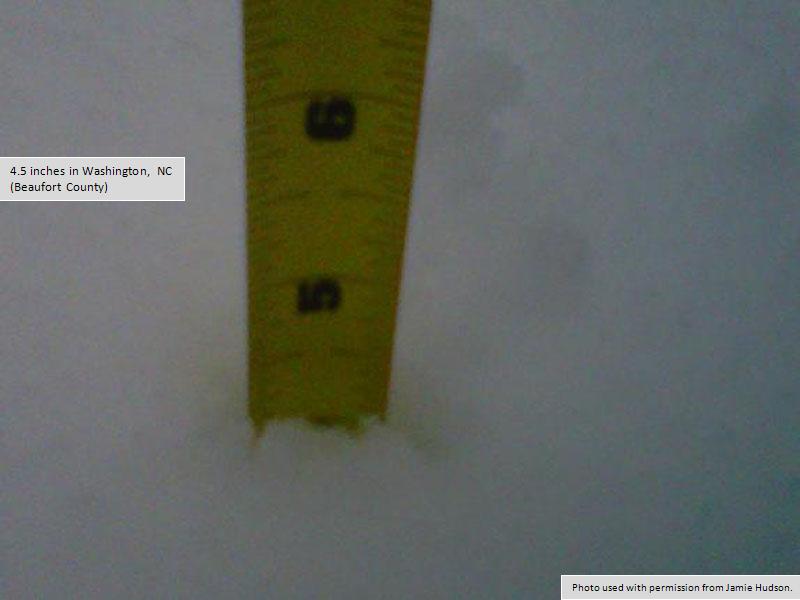
Snowfall pictures across Eastern North Carolina
Case Study Team:
David Glenn
Chris Collins
Scott Kennedy
John Elardo
Lara Pagano
Bel Melendez
Jeremy Schulz


 Map View
 Weather Hazard Briefing (when applicable)
 Forecaster Discussion
 Marine
 Text Products
.png) Skywarn
Skywarn Submit Storm Reports
 Coastal Flood
.png) Surf Forecast/Rip Currents
Surf Forecast/Rip Currents