
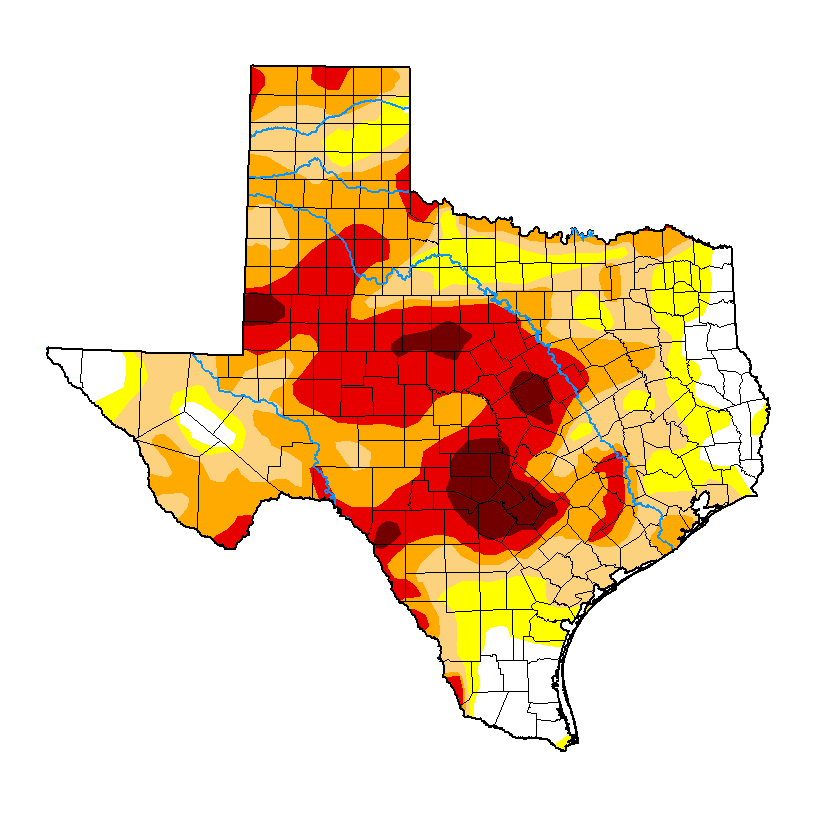
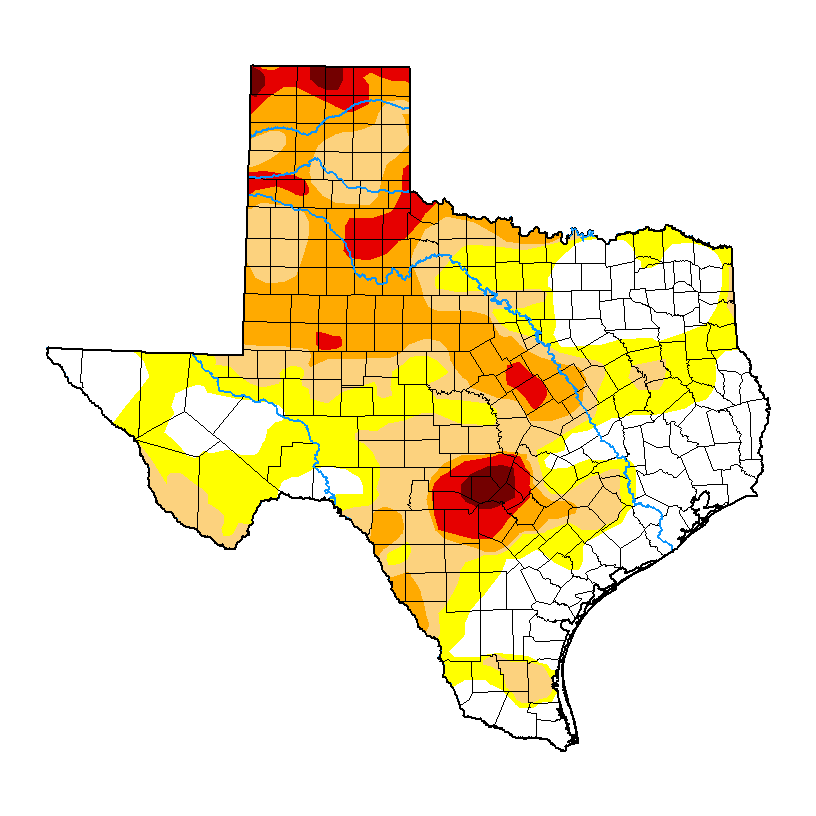
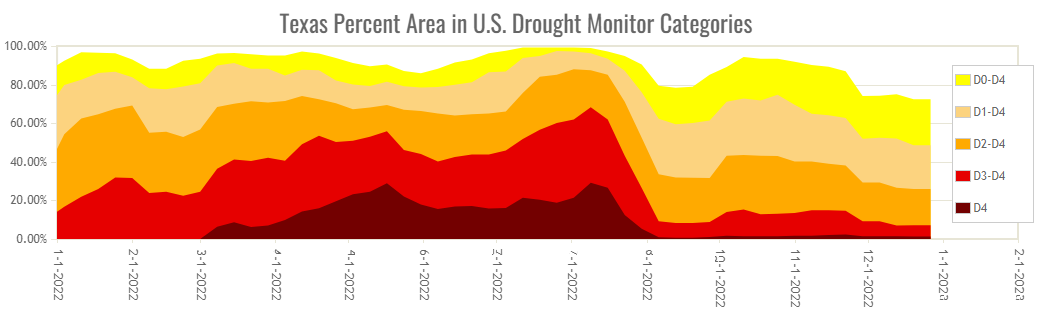
 The main weather themes of 2022 were the exceptionally dry start and intense drought, condensed active spring storm season (primarily confined to May), extremely HOT summer and wet late summer and early fall. The year ended as the 10th warmest on record in Lubbock, finishing with an average yearly temperature of 62.3 degrees. Precipitation was almost nonexistent the first four months of the year, sporadic during our traditional severe weather season centered around May, generous in late summer into fall before turning drier again late in the year. The year ended with all of West Texas in moderate to severe drought, which was a considerable improvement from the widespread exceptional drought that prevailed in the spring. In total, 15.06 inches of precipitation fell at Lubbock during 2022, which ranks as the 41st driest in the historical record. The main weather themes of 2022 were the exceptionally dry start and intense drought, condensed active spring storm season (primarily confined to May), extremely HOT summer and wet late summer and early fall. The year ended as the 10th warmest on record in Lubbock, finishing with an average yearly temperature of 62.3 degrees. Precipitation was almost nonexistent the first four months of the year, sporadic during our traditional severe weather season centered around May, generous in late summer into fall before turning drier again late in the year. The year ended with all of West Texas in moderate to severe drought, which was a considerable improvement from the widespread exceptional drought that prevailed in the spring. In total, 15.06 inches of precipitation fell at Lubbock during 2022, which ranks as the 41st driest in the historical record.The graphic below highlights some of the more significant weather events that occurred across the area in 2022. The year started with a quick shot of cold air and rain and snow New Year's Day. Another quick-hitting storm system brought additional snow to the southern Texas Panhandle and the northern South and Rolling Plains January 26th. The heaviest snow targeted the southeast Texas Panhandle where as much as 2-4+ inches fell. Early February Early February provided the coldest air of the year, at or below 0 degrees. Muleshoe measured the coldest temperature in Lubbock's County Warning Area when the mercury dipped to -12°F on February 4th. The rest of winter and early spring was very dry, and led to an intensifying drought. The weather finally turned active in May, complete with several rounds of severe weather including very large hail, damaging winds, tornadoes and flash flooding. May 23rd was especially active, when a cyclic supercell thunderstorm produced several tornadoes, including two EF-2 tornadoes, near Morton. Thankfully, the tornadoes stayed over rural land and inflicted minimal damage. Just over a week later, hail as large as 3.5" diameter (between baseball and softball size) dropped out of the sky near Memphis. Heat and dry conditions then moved in for much of the summer before widespread and heavy rain finally returned to West Texas in late August. Many locations experience one or more days when 1-3+ inches of rain fell in late August and early September, including an impressive 4.66" downpour in Olton between August 20th and 21st. Occasional rainfall continued into the fall before dry conditions took a firm grip again in late fall and to close out the year. The year concluded on a warm note on the heels of a brief, but bitter cold intrusion of Arctic air shortly before Christmas.
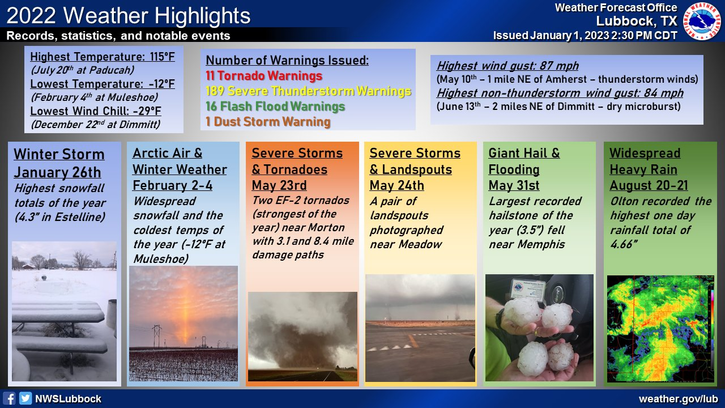 Notable weather impacts to the region in 2022. Note that this is just a sampling of events, many more have been omitted due to space constraints.
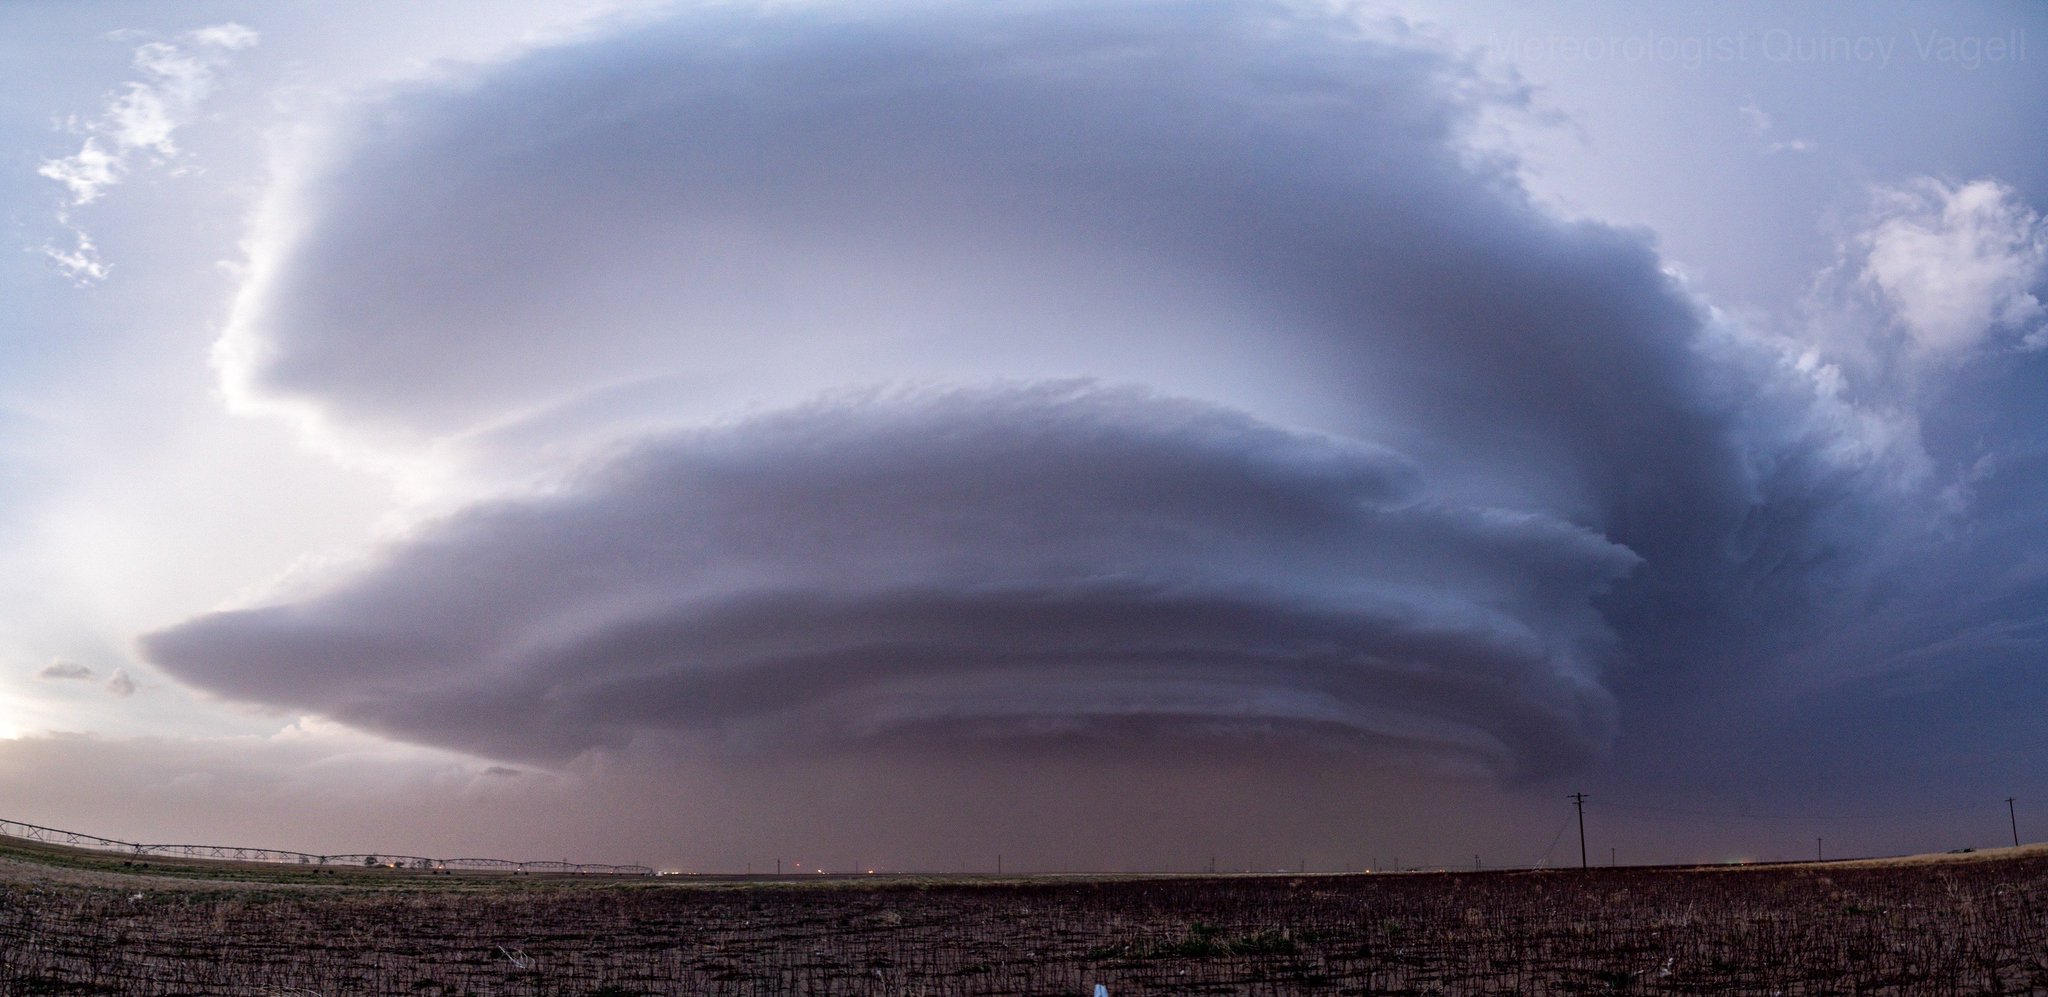
A total of 12 supercell tornadoes were observed in the Lubbock 24-county service area in 2022, two-thirds of the long-term average of 18. All of these documented tornadoes occurred in May, during the typical heart of severe weather season for West Texas. The bulk of the tornadoes, 9 to be exact, were observed on the evening of May 23rd. All the tornadoes were produced by a cyclic-supercell that tracked slowly eastward from north of Morton to east of Pettit. Thankfully, most of the tornadoes were short-lived and all of the tornadoes occurred over rural land, where they inflicted minimal to no known damage. Two of the tornadoes were given a rating of EF2, primarily due to downed power poles and a couple of overturned pump jacks. The remainder of the tornadoes were given a rating of EFU or EF0. Earlier in the month, 3 dusty tornadoes spawned by another cyclic-supercell affected parts of rural northeast Dickens and northern King Counties on May 4th. Thankfully, these early-May tornadoes did no known damage and acquired an EFU rating. In addition to the supercell tornadoes, several landspout tornadoes were observed near Meadow on May 25th. As is typical with landspout tornadoes, they were short-lived, moved very little and did no known damage.
|
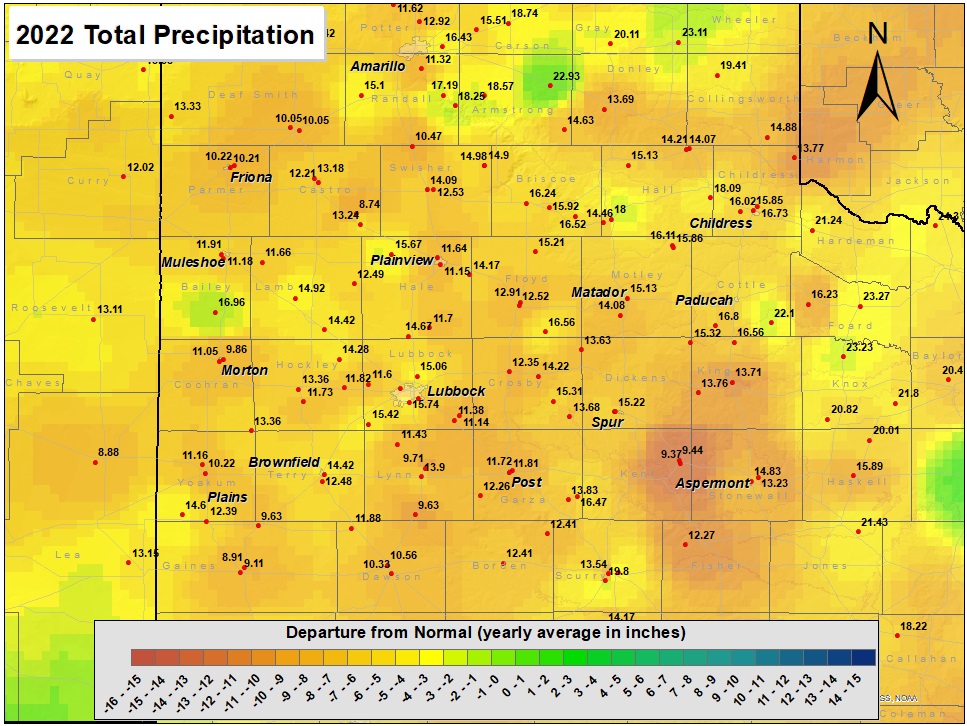
Precipitation in 2022 was a precious commodity, with all but a few locations tallying under 20 inches and many spots falling shy of 15 inches. The driest locations, around and under 10 inches, were dotted about the South Plains and southwest Texas Panhandle, with one pocket of sub-10 inch totals off the Caprock in and around Jayton. The most generous rainfall was tallied over the east-central Texas Panhandle as well as the far eastern Rolling Plains into western North Texas, where many sites measured over 20 inches. The Hackberry West Texas Mesonet (WTM) measured the most precipitation in NWS Lubbock's Forecast Area, topping out at 22.10 inches, while the Hart WTM was lowest, reporting a meager 8.74 inches.
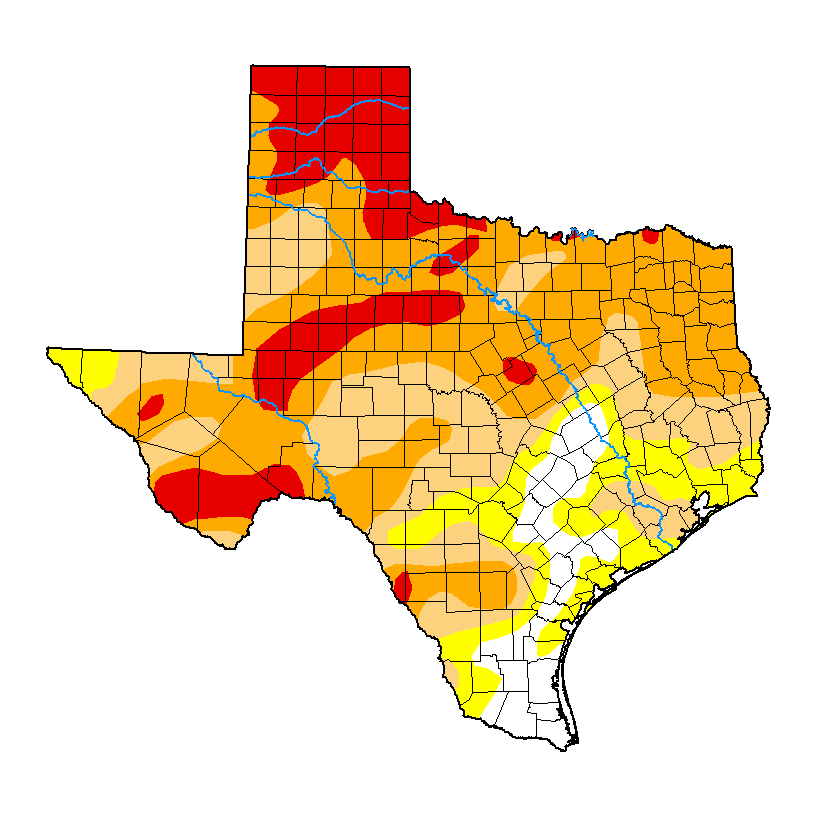
Lubbock International Airport officially recorded 15.06 inches of precipitation, a little over 3.0 inches below the long-term average of 18.33 inches, or about 82% of average. This was fairly representative of the city of Lubbock and it was on the more generous side in comparison to most locations on the Caprock. The map below shows the 2022 precipitation as a percent of the long-term average or "normal". This image shows the driest region (50-70% of average) speckled about much of the region in no clear pattern. A couple of spots, including near Muleshoe National Wildlife Refuge and west of Denver City, had annual totals near normal, while the remainder of the area fell somewhere between 70% and 90%.
|
|
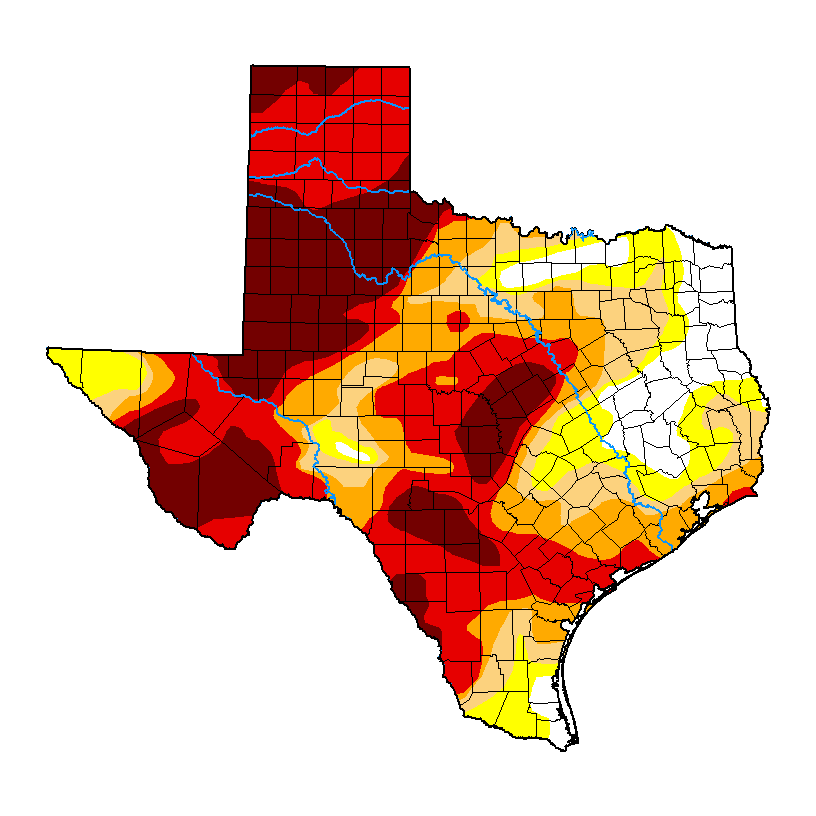
Dry conditions in the fall of 2021 continued through the winter and on into the spring of 2022 resulting in the development and intensification of drought conditions over much of Texas. When regular and widespread rain failed to materialize in spring, much of West Texas tumbled into extreme to exceptional drought. The lack of moisture during the first half of the year caused many crops to fail, while a significant number of farmers refrained from planting crops at all due to the bleak weather and soil conditions. Eventually, rainfall did become more widespread and heavier by late summer into the fall, and this helped to alleviate, but not fully extinguish the drought over portions of northwest Texas.
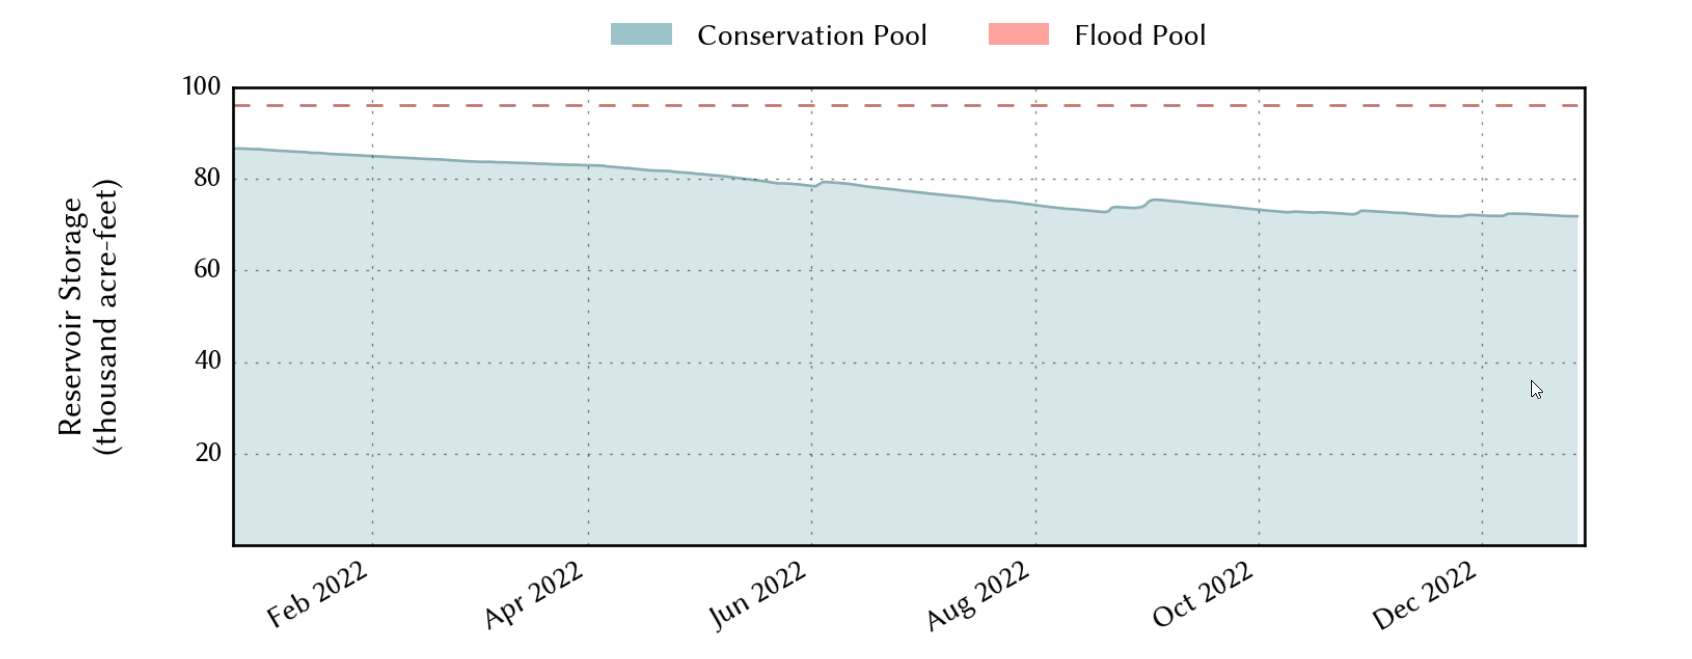
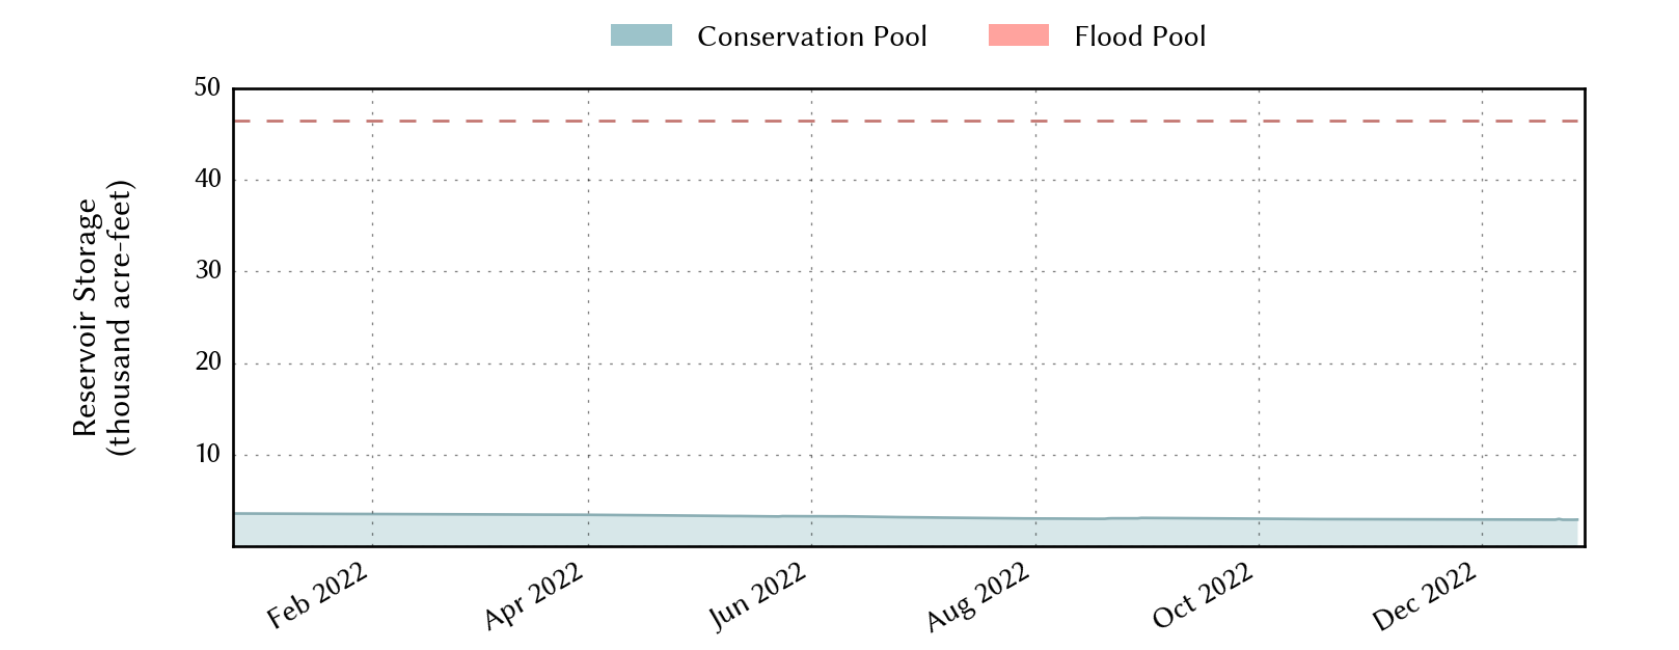
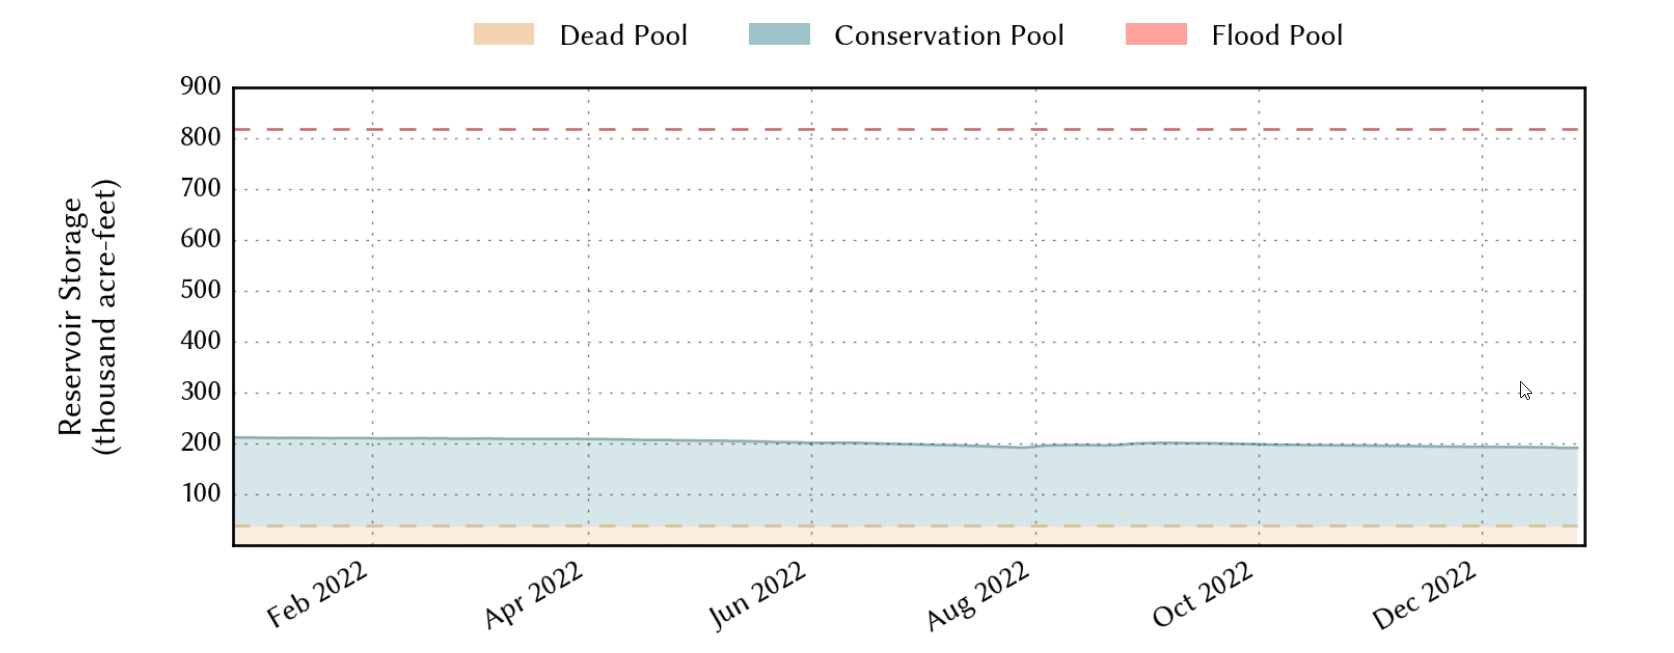
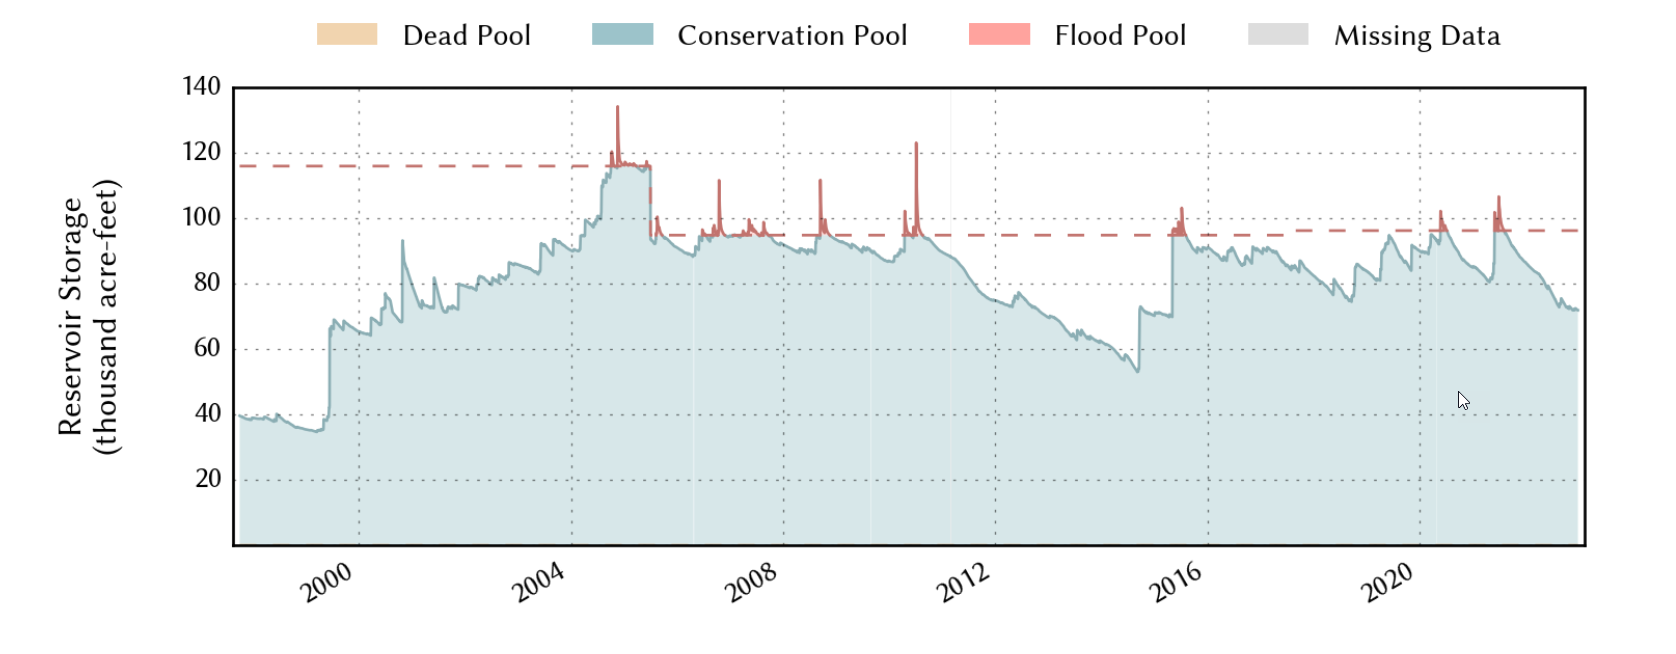
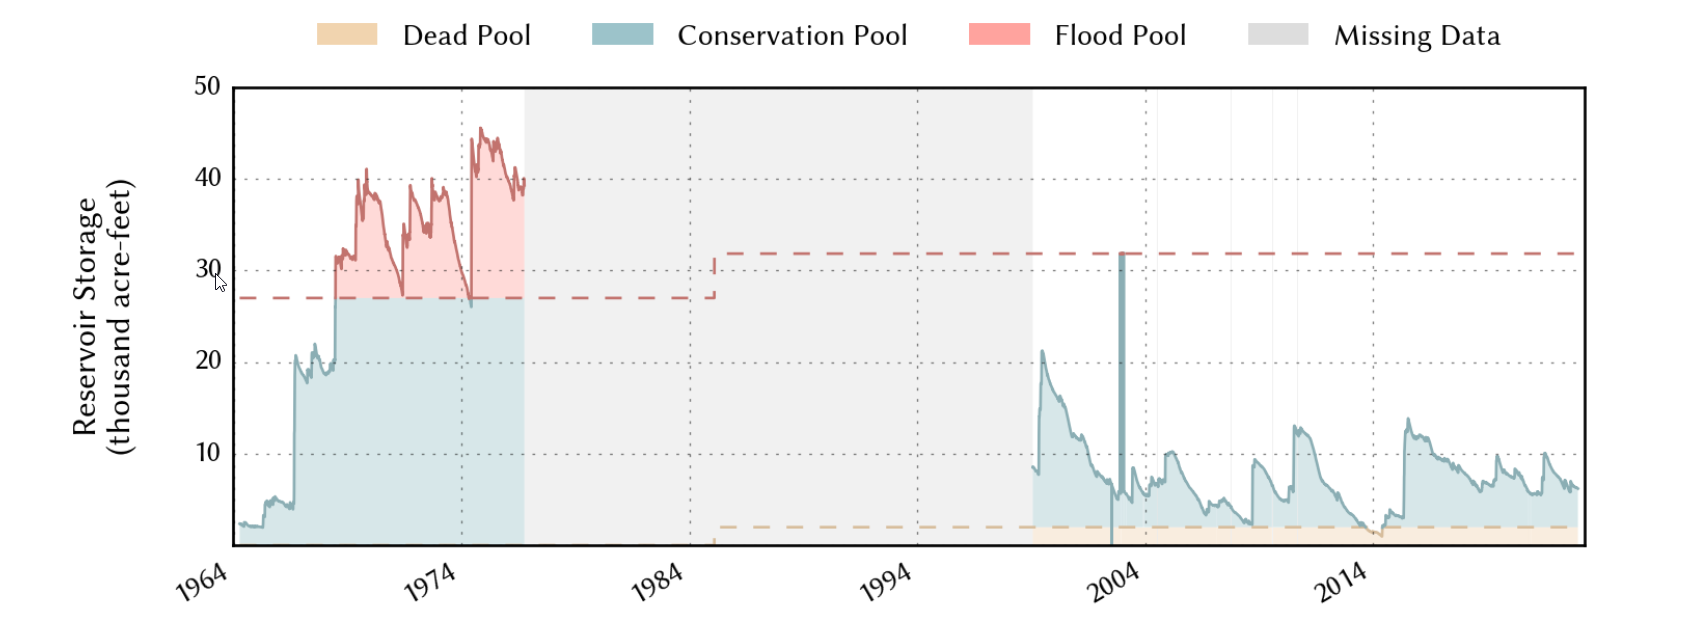
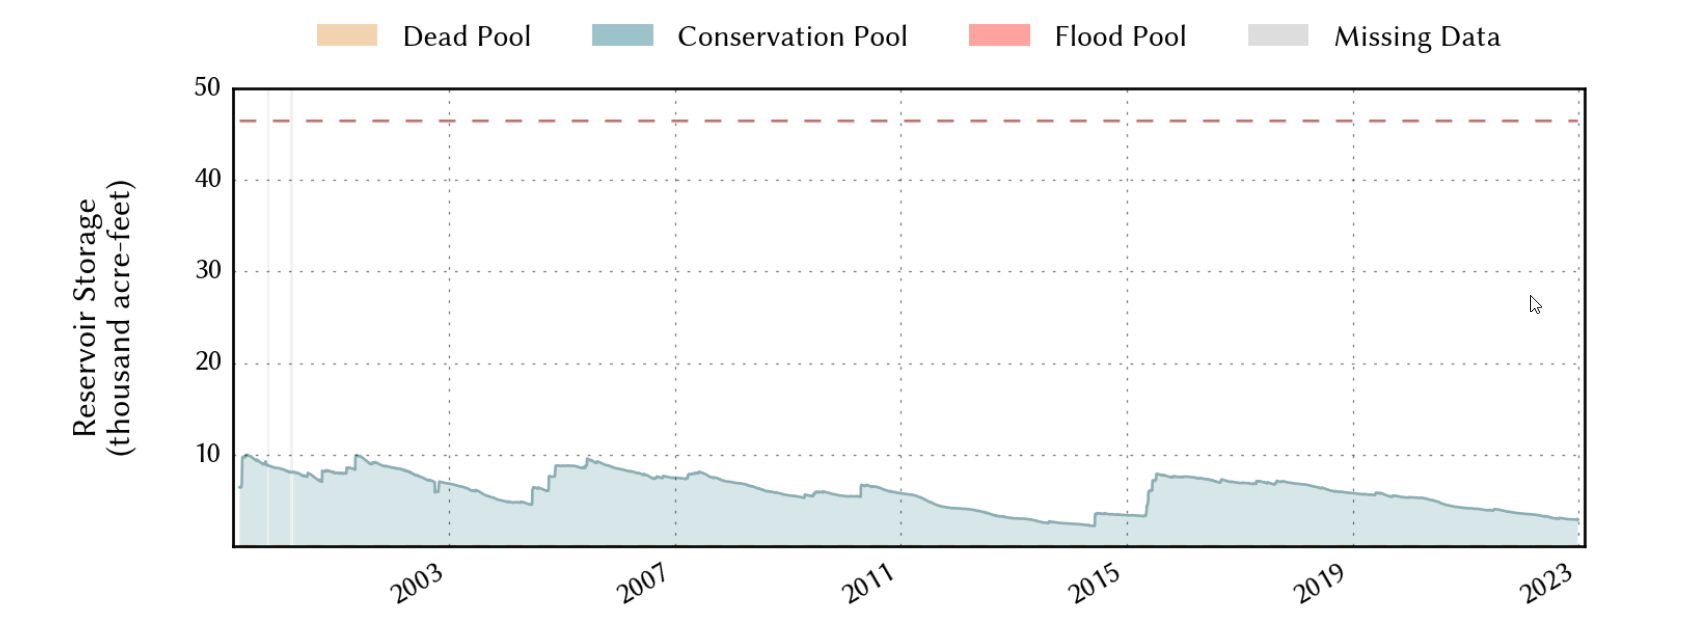
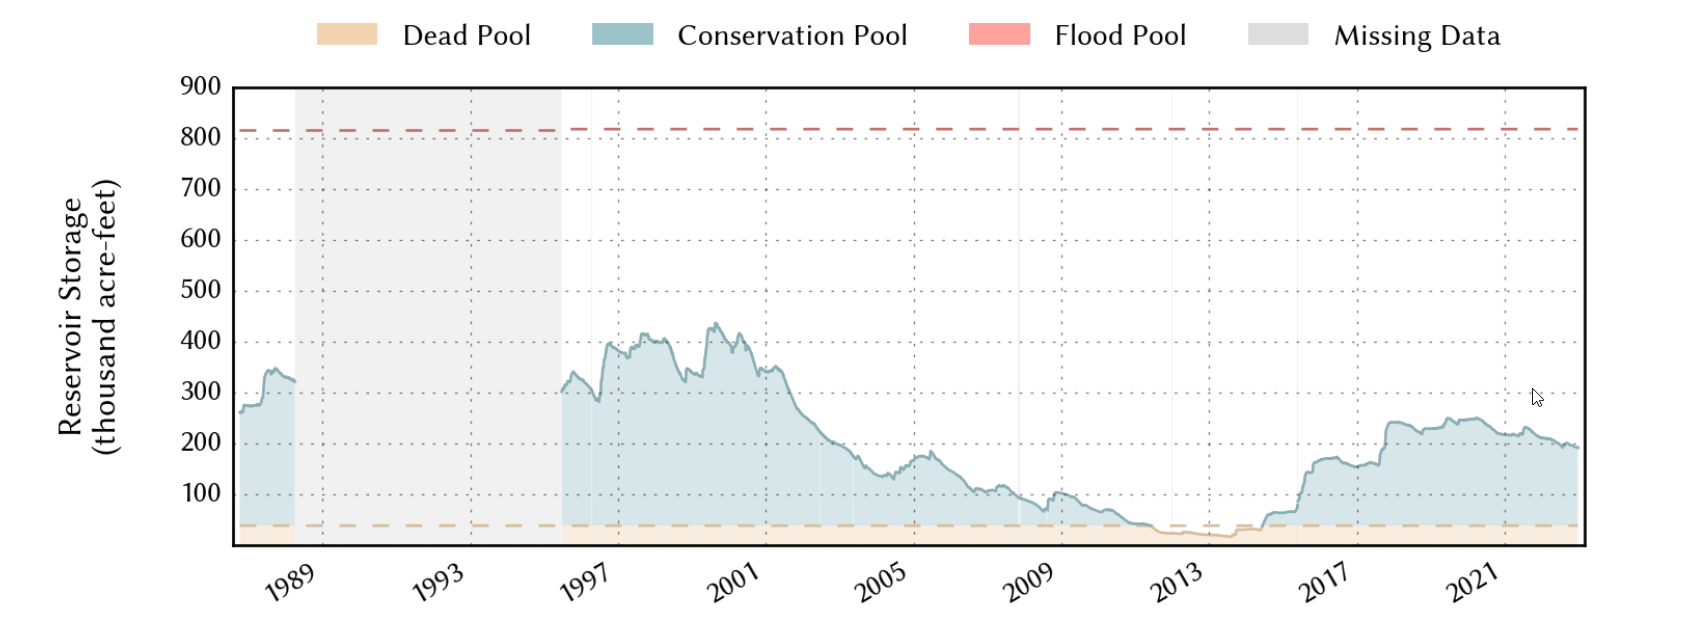
The dry spring and summer resulted in all of our area reservoir levels falling over the course of 2022. Lake Alan Henry and White River Lake measured a few minor upticks following rain events in the summer and fall, but overall dropped several percentage points. Over the entire year of 2022 Lake Meredith (from 34% to 31%), Lake Alan Henry (from 89% to 74%), White River Lake (from 19% to 14%) and Lake Mackenzie (from 8% to 6%) each measured net decreases in their conservation levels.
|
||||||||||||||||||||
|
2022 will go down in the books as the 10th warmest and 41st driest year since records began in 1911 at Lubbock. Mean monthly temperatures were warmer than average for 7 months and cooler than average 5 months (January, February, March, October and November). The warmest months, with respect to average, were July (+5.6°F) and May (+4.7°F). The coolest months, with respect to average, were February (-5.1°F) and November (-3.2°F).
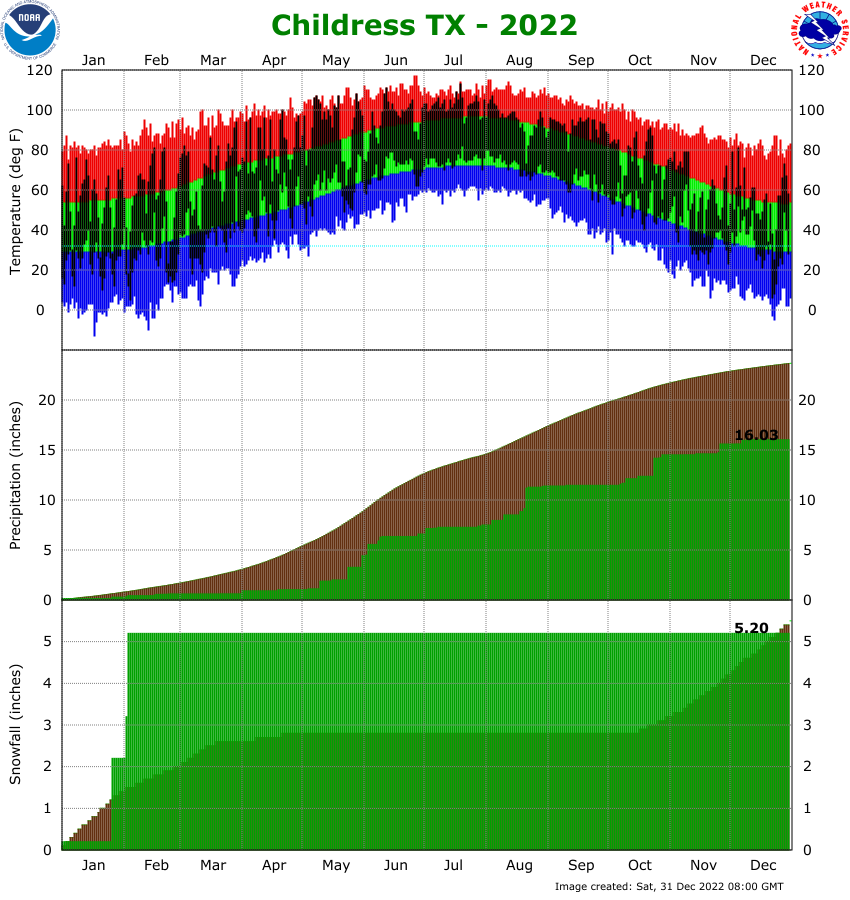
Precipitation was tough to come by in the first half of 2022, but picked up in late summer and fall before fading late in the year. Nine months recorded below average rainfall, with only May, August and October finishing above average. The wettest month of the year, by far, was August when 5.95 inches of rain fell (4.21 inches above the monthly average). The only other months that recorded over an inch of rain were May (3.58") and October (2.39"). The remaining 9 months measured under an inch of rainfall with less than a quarter inch in January, February, March, April and July. In fact, the first 4 month of 2022 tallied a meager 0.38", the lowest such total on record for the first four months of the year in Lubbock. The year brought 2.7" of snow fall at Lubbock, including 1" in January, 1.6" in February and 0.1" in March. Only trace amounts of snowfall were recorded in late fall and early winter. The Lubbock Airport recorded a total of 15.06 inches of precipitation for 2022, finishing 3.27 inches below average. Two daily rainfall records were set in 2022: 1.41" on August 18th (previous record was 0.94" in 1964); and 2.25 inches on August 31st (previous record was 1.02" in 1942).
The hottest temperature in 2022 was 107°F, reached on June 12th and again on July 19th. The high reached or exceeded 105°F on 2 other occasion: June 11th (106°F); and July11th (105°F). In all, temperatures reached the triple digits on 34 occasions, the second most on record (2011 recorded 48 100-degree days) and well above the long-term average of 10. On the other side of the pendulum, the coldest temperature of the year was a bitter cold -1°F, experienced February 4th. Thirty nights fell below 20°F for the entire year, including five below 10°F. Ten record highs were tied or set in 2022: 94°F on March 28th; 92°F on April 5th and 15th; 94°F on April 20th; 96°F on April 28th; 102°F on May 7th; 98°F on May 8th; 101°F on May 17th; 107°F on June 12th; and 104°F on July 18th. In addition, 24 record high minimum temperatures were set or tied in 2022, including two days that didn't drop below 80°F on July 27th and August 1st. One record low was set in 2020: -1°F on February 4th. In addition, 3 record low maximum temperatures were set in 2022.
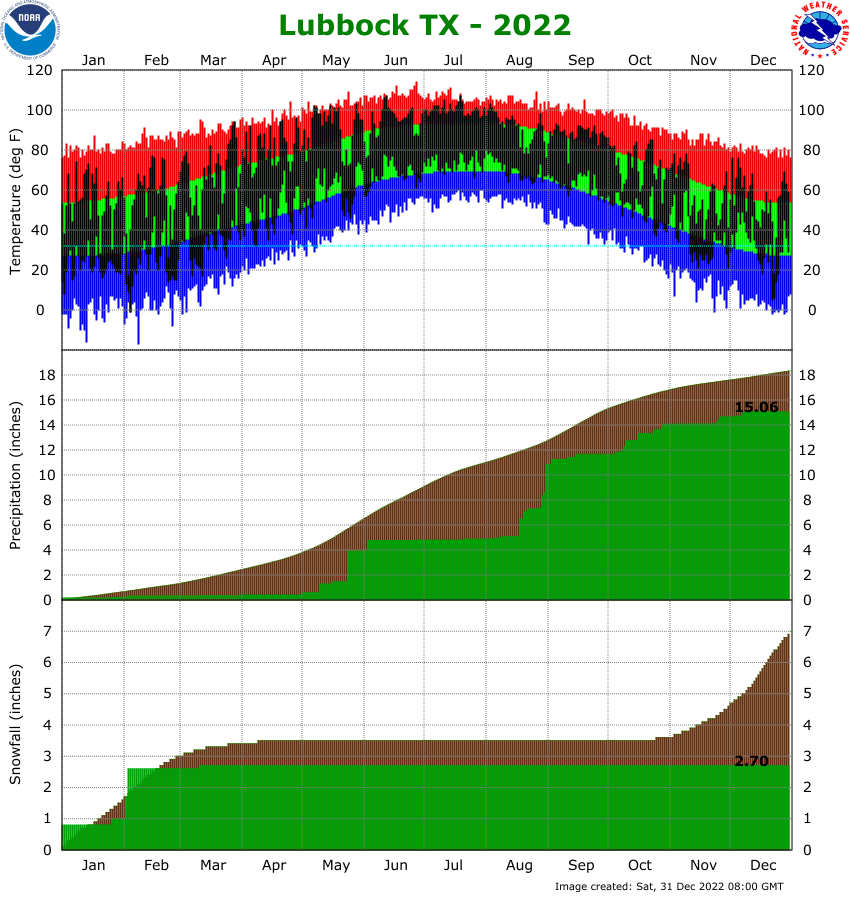
The upper section of the below graph shows the daily high and low temperature distribution for 2022 at Lubbock Preston Smith International Airport. A majority of the year yielded temperatures at or above average, with 7 of the 12 months finishing warmer than average. Unfortunately, 6 of the 7 months that finished above normal were during the middle of the year (April through September), when even average temperatures are warm/hot. This included July when all days were above average and the month finished 5.6 degrees warmer/hotter than normal. Only December finished above average during the cool season, despite a brief but bitterly cold intrusion before Christmas. Then, aside from December, the cool season months finished below average, punctuated by a chilly middle of November (12 straight days below average) and cold start and end to February.
The middle section of the chart above shows how much rain accumulated through 2022. Lubbock finished with a grand total of 15.06 inches, over 3 inches below the 30-year average. The year began on an unsettled note, with a shot of cold air, light rain, then brief heavy snow on New Year's Day. Thereafter, dry conditions and intensifying drought were the theme through April. Periodic showers and thunderstorms finally returned to the South Plains in May, including 2.48 inches falling on May 24th thanks to a couple of rounds of thunderstorms. The rainfall effectively shut off in early June and didn't return in earnest until the second half of August. Unfortunately, this rain fell way too late for the summer growing season, but it did provide hope for planting cool-season crops. August finished with an impressive 5.95 inches of rain, punctuated by 2.25 inches on the final day of the month. Periodic rain continued through the fall before shutting off again late in the year.
Snowfall was tough to come by in 2022, tallying a meager 2.7 inches. The year did not start that way though, as a band of heavy snow provided a quick 0.8" the evening of January 1st. Another 0.2" of snow fell on January 26th, when freezing drizzle briefly switched to snow before changing back to freezing drizzle. The only other days in 2022 to bring measurable snowfall to Lubbock was February 2nd and 3rd when a total of 1.6" fell during an Arctic invasion. Only a few flakes of snow were observed in October and November, but nothing measurable during the fall or start of winter. The 2.7 inches of snow ties 2020 as the 24th lowest yearly snow total on record.
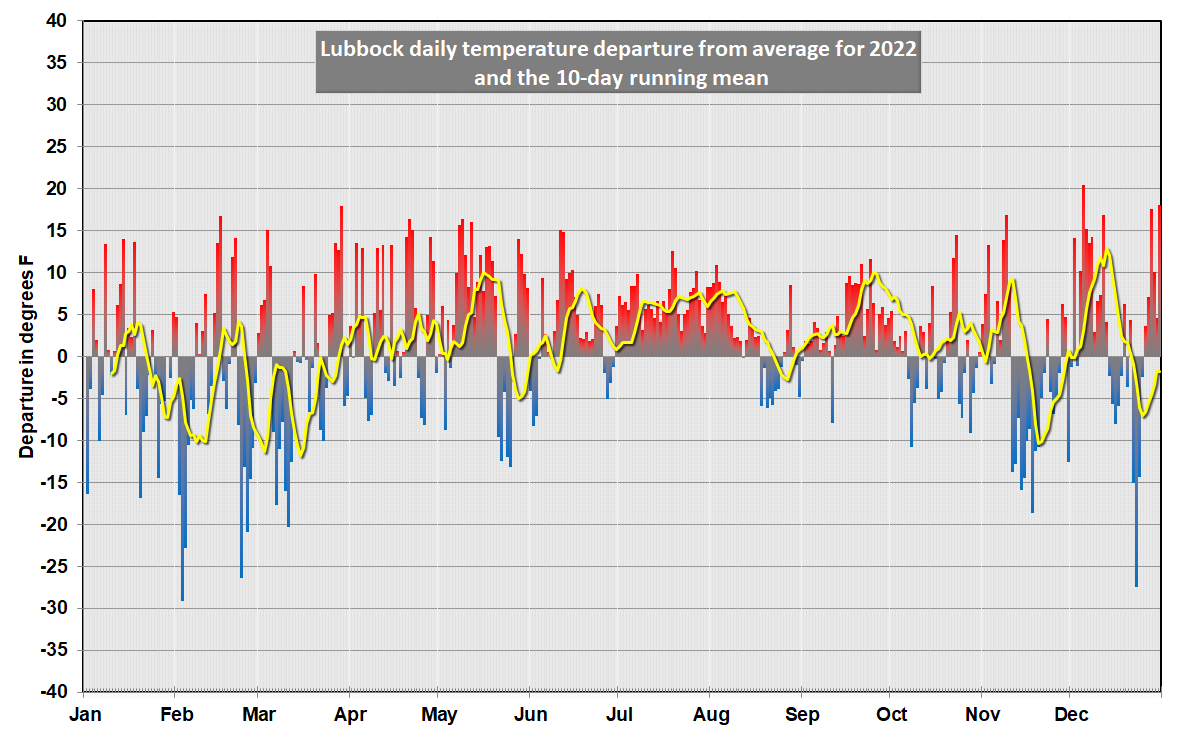
The graph above displays the daily temperature as the departure from the "normal", or 30-year average temperature. The yellow line represents the 10-day running mean of the daily temperature departure and is used to smooth out the day-to-day extremes so that longer trends are easier to see. It is clear that above average temperatures dominated most of the warm season, from May through October, aside from brief cooler periods in late May and early June, late June and late August. The most consistent period of above average temperatures spanned from early July through mid-August, when warmer than average temperatures are least needed. The cool season saw more variability, as is typical, but generally leaned to the cool side of average. Several well below average periods occurred in early and late February and late December, but thankfully they were short-lived. Overall, the average temperature of 62.3 degrees for the entire year was 0.9 degrees above the 30-year average, and made for the 10th warmest year in the historical record for Lubbock.
|
|
|
| JANUARY through DECEMBER |


