
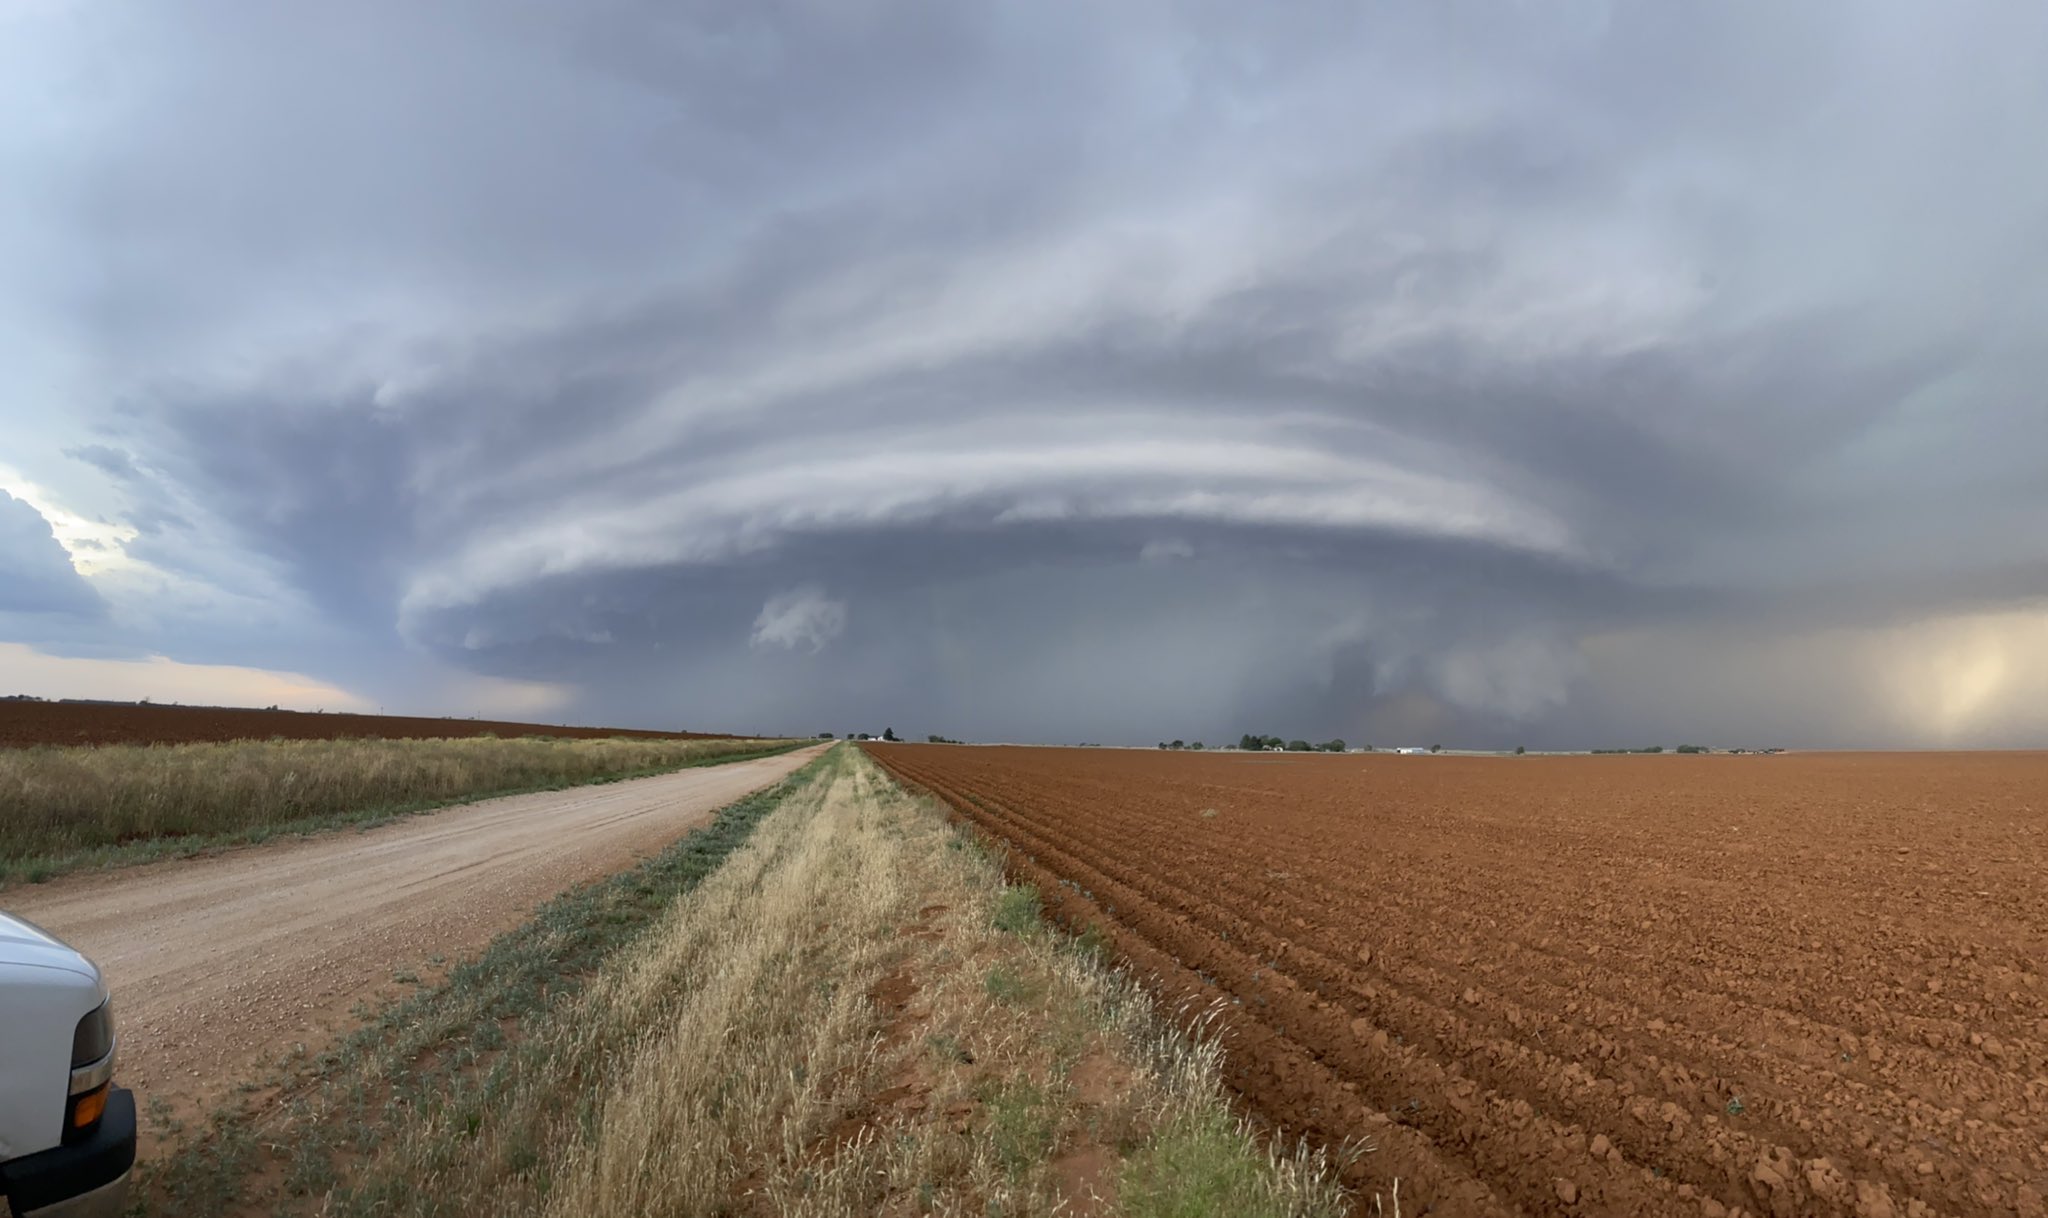
 The main weather themes of 2020 were the unsettled first few months, a relatively anemic spring storm season, overall warm and dry conditions and the development and intensification of drought conditions through the late spring, summer and fall. The year ended as the 6th warmest on record in Lubbock, finishing with an average yearly temperature of 62.8 degrees. Precipitation was fairly regular through March, but then became tough to come by through much of the remainder of the year. The year ended with all of West Texas in drought, including extreme to exceptional drought over much of the Caprock. In total, 11.55 inches of precipitation fell at Lubbock during 2020, which was the 11th driest in the historical record and over 7 inches below average. The main weather themes of 2020 were the unsettled first few months, a relatively anemic spring storm season, overall warm and dry conditions and the development and intensification of drought conditions through the late spring, summer and fall. The year ended as the 6th warmest on record in Lubbock, finishing with an average yearly temperature of 62.8 degrees. Precipitation was fairly regular through March, but then became tough to come by through much of the remainder of the year. The year ended with all of West Texas in drought, including extreme to exceptional drought over much of the Caprock. In total, 11.55 inches of precipitation fell at Lubbock during 2020, which was the 11th driest in the historical record and over 7 inches below average.The map below highlights some of the more significant weather events that occurred across the area in 2020. The first few months of the year provided several rounds of rain and snow, including a winter storm that dropped over a foot of snow in Jayton in early February. The spring season was relatively anemic, producing only 1 tornado, while the entire year only brought 4 tornadoes. Thankfully all 4 tornadoes remained over open land and did no known damage. Some of the most intense thunderstorm of the spring developed on May 23rd. The strongest storm of the 23rd anchored over southwest Garza County, where it produced one tornado and torrential rainfall. Runoff from the heavy rain swept the pavement off of FM 669 south of Post and also filled Lake Alan Henry. Additional severe storms dropped golf ball to baseball size hail in parts of Lubbock and Silverton on May 23rd. Parts of Lubbock also saw large hail, from tennis ball to baseball size on March 18th and May 20th. Wind gusts estimated to be near 100 mph caused damage in Brownfield on June 17th as a thunderstorm moved through. Additionally, a 98 mph thunderstorm wind gust was recorded near White River Lake on August 2nd while a 94 mph wind gusts was recorded as a storm tracked over Graham on June 4th. An intense heat-fueled storm produced a number of microbursts of 80-100 mph winds that caused damage near Estelline on July 9th. Moisture was rather limited in 2020, but heavy rain, in excess of 5 inches, did fall on the far southeast Rolling Plains in mid-September. Several rounds of wintry weather affected portions of the region early and late in the year, but the most widespread and impactful event occurred in late October when record cold moved into West Texas. Up to 3 to 5 inches of snow blanketed the southwest Texas Panhandle and northwest South Plains, but the most impactful weather was further east, from the central South Plains into the southeast Texas Panhandle and Rolling Plains, where sleet and ice totals of an inch or more were common. The widespread and heavy icing downed many power lines and trees and caused numerous power outages, some that lasted for many days. The year concluded with a final winter storm that brought snow to the eastern South Plains and most of the Rolling Plains. Post recorded an impressive 9.5 inches of snow on the final day of the year.
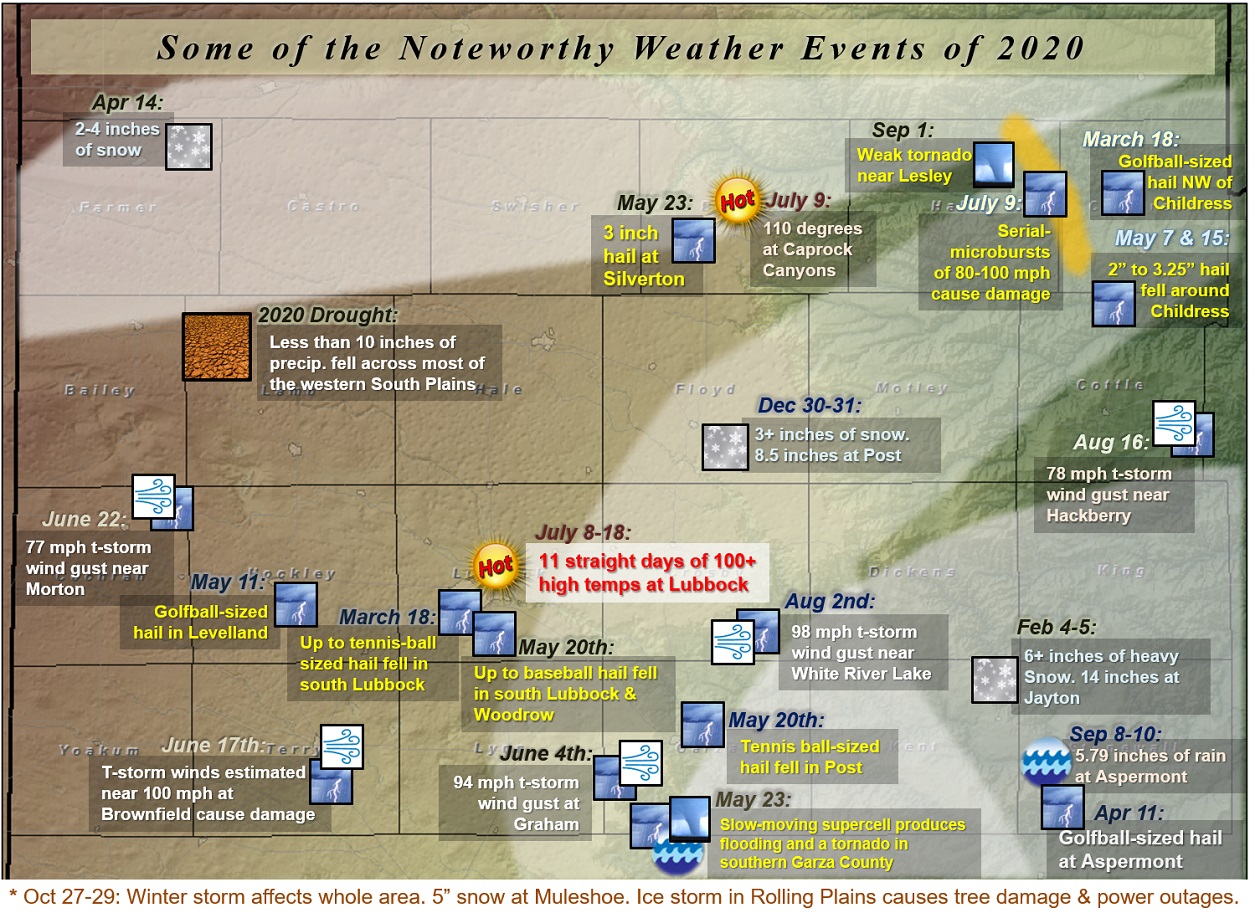 Map displaying many of the more notable weather impacts to the region in 2020. Note that this is just a sampling of events, many more have been omitted due to space constraints. Click on the image to view a larger map.
Only 4 tornadoes were observed in the Lubbock 24-county service area in 2020, well below the 23 observed the previous year, and the long-term average of 18. Improbably, only one tornado was observed during the heart of climatological severe weather season, from April through June. The springtime tornado occurred on May 23rd in open land over southwest Garza County and lasted about 11 minutes. A brief landspout tornado was also observed south of Crosbyton on July 22nd, and 2 brief tornadoes where reported with a storm that tracked across the southeast Texas Panhandle (northeast of Antelope Flats and southwest of Lesley, respectively) on September 1st. Thankfully, none of these tornadoes did any known damage.
|
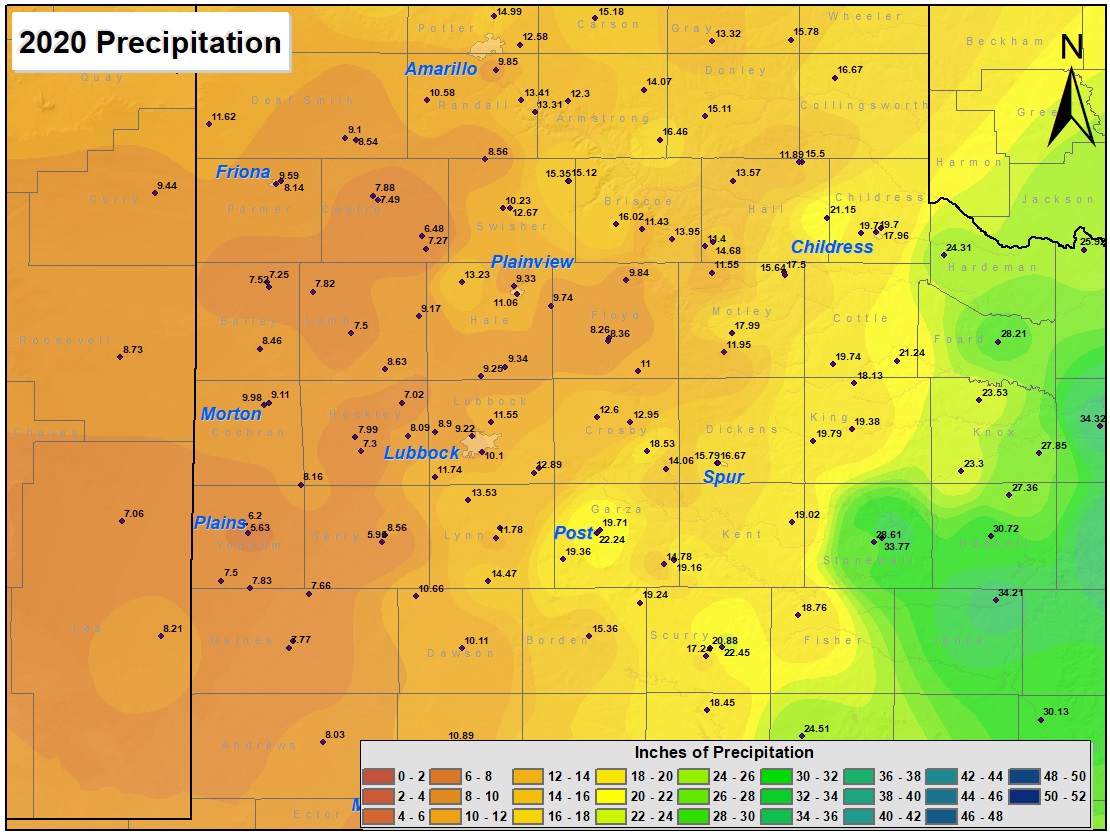
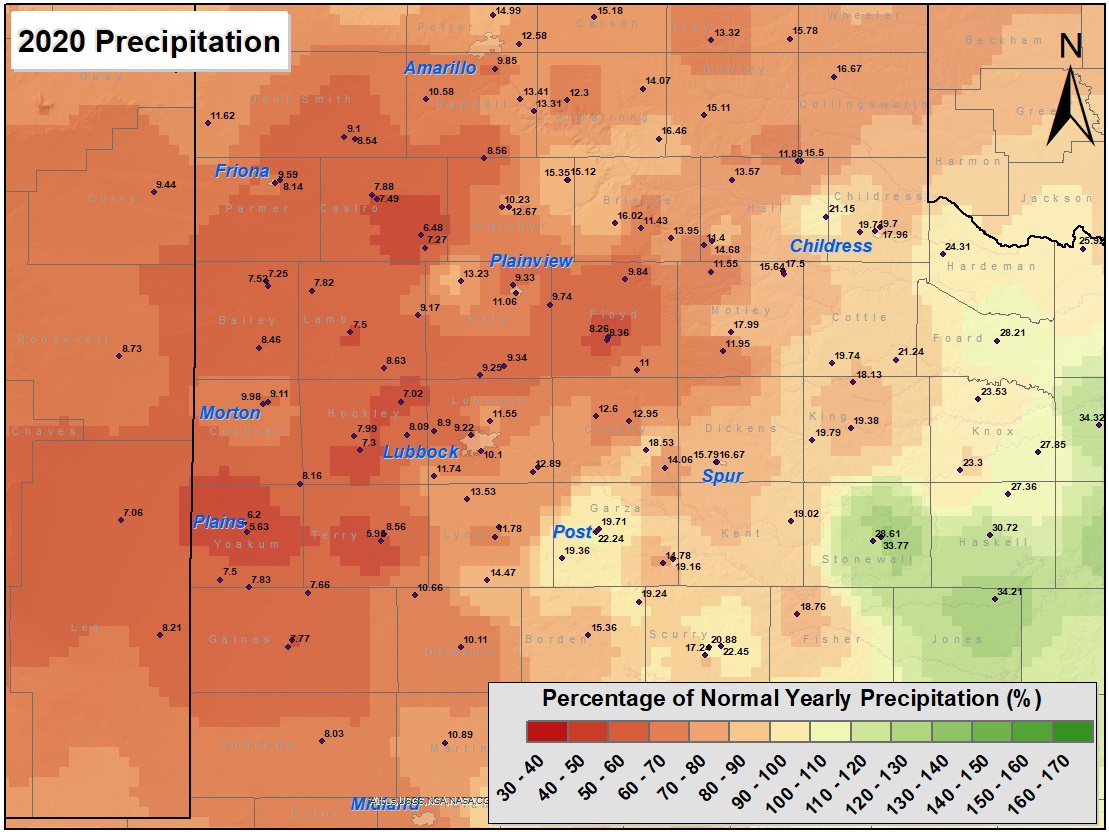
Precipitation in 2020 was a precious commodity, with all but a few locations tallying under 20 inches and many spots on the Caprock falling shy of 10 inches. The southwest South Plains was the driest of all, including stations in Plains and Brownfield, where 12-month totals were under 6 inches. Yearly totals of 6 to 10 inches were widespread over the southwest Texas Panhandle into the northern, western and central South Plains. Further east, yearly tallies of 10 to 20 inches were common from the south-central and southeast Texas Panhandle into much of the Rolling Plains and eastern South Plains. The exception was across western North Texas into the far southeastern Rolling Plains, including southeast King and much of Stonewall Counties, where 25 to 30+ inches of rain fell. A good chunk of this "extra" rainfall came in mid-September when several inches of rain accompanied a front that brought record cold to the region. Aspermont measured the most precipitation in NWS Lubbock's Forecast Area, an impressive 33.77 inches. Lubbock International Airport officially recorded 11.55 inches of precipitation, over 7.5 inches below the long-term average of 19.12 inches, or about 60% of average. This was fairly representative Lubbock County, including the city of Lubbock. The map below shows the 2020 precipitation as a percent of the long-term average, or "normal". This image shows the driest region (30-40% of average) in pockets across the southwest Texas Panhandle and northern and western South Plains. Most of the remainder of the locations on the Caprock finished under 60% of average. Even off the Caprock, rain tallies were shy of average for all but from around Stonewall County eastward. Rainfall deficits of 5 to 10 inches were common over much of the South Plains region. The widespread and significant precipitation shortfalls caused drought to develop and intensify through much of the year, resulting in extreme to exceptional drought over most of the Caprock by the conclusion of 2020.
|
|
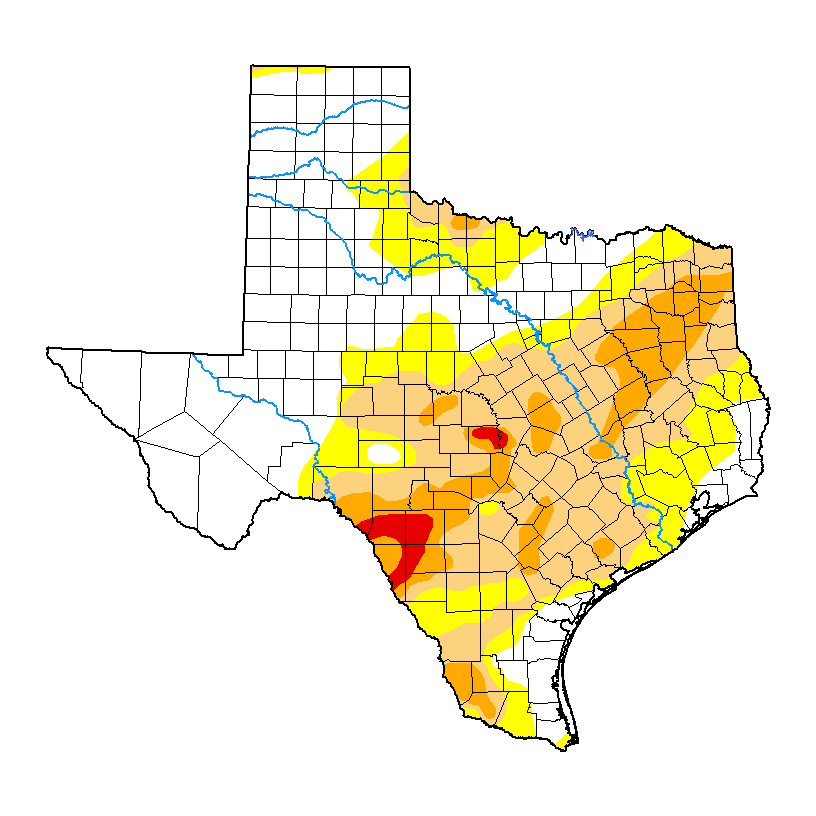
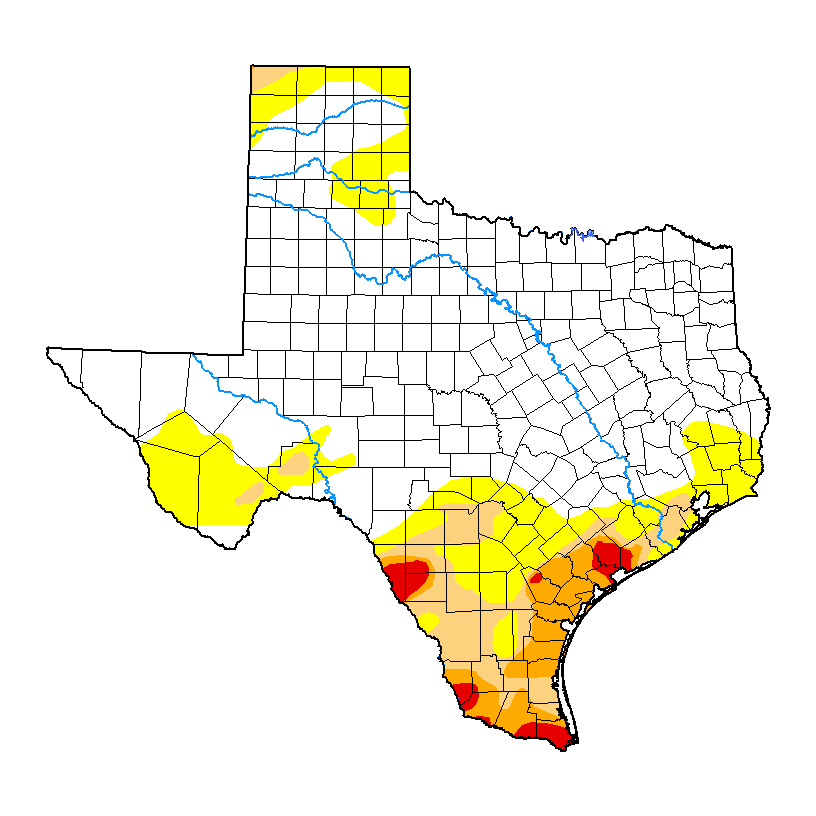
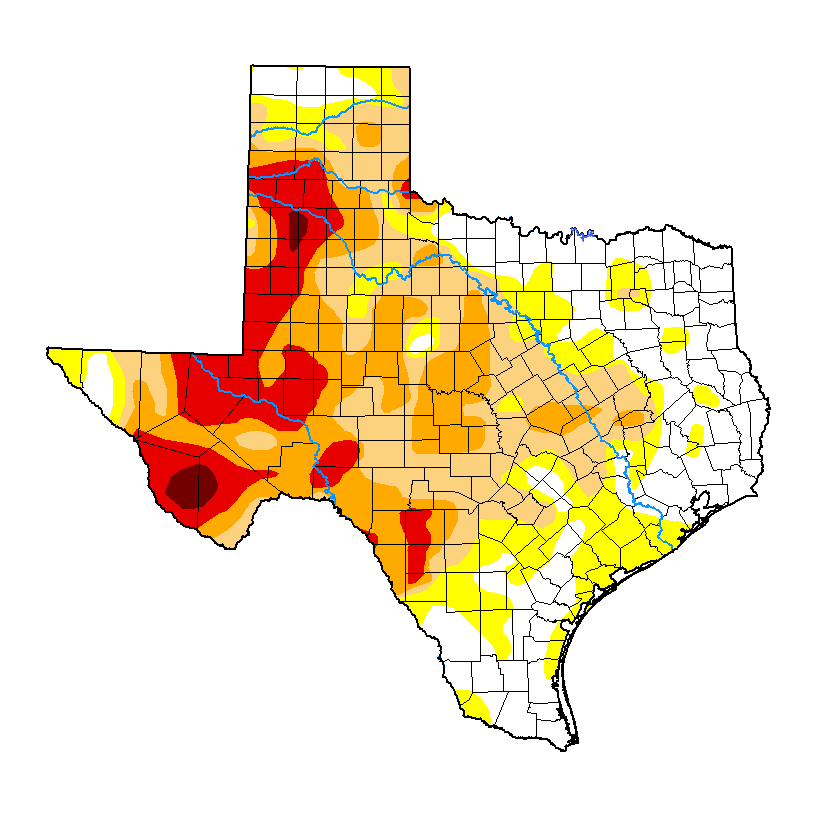
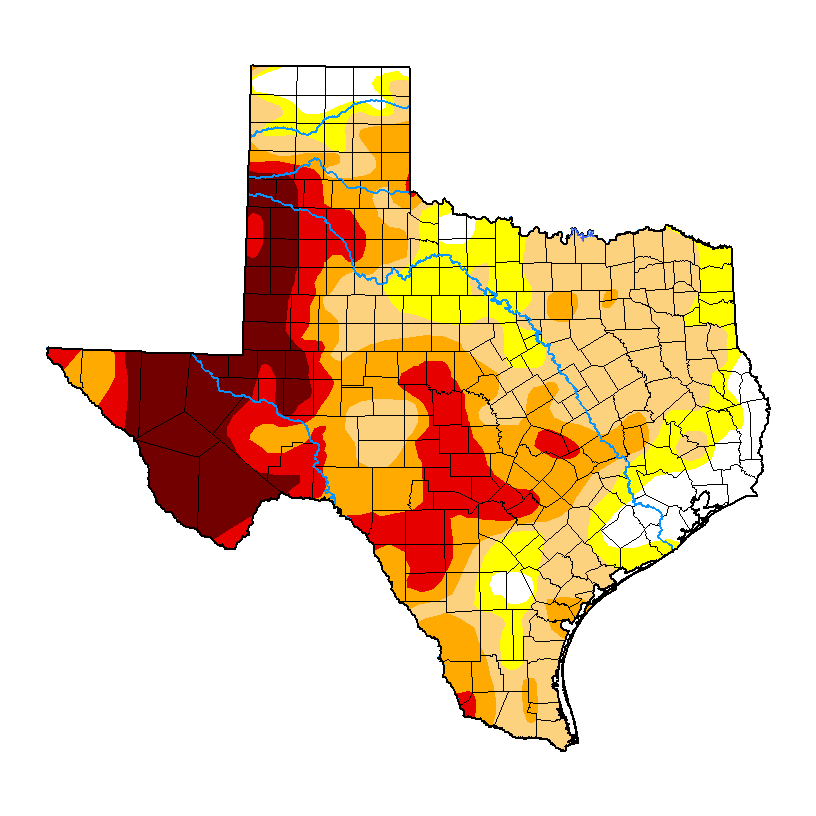
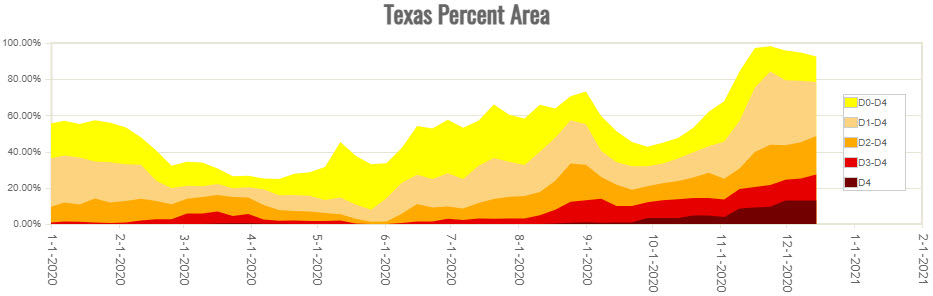
The year began with minimal drought across the western part of the state of Texas, though moderate to severe drought occupied much of Central, South and East Texas. Drought conditions were largely suppressed to the southern portions of the state through early spring as several rounds of rain and snow affected the northern and central part of the state late winter into early spring. Unfortunately, the remainder of the spring into the summer was underwhelming with regards to thunderstorm coverage and rainfall for much of the western part of the state, including over the South Plains region. In response, drought conditions rapidly developed and intensified, with extreme to exceptional drought forming over much of the Caprock of the South Plains and southwest Texas Panhandle by late summer. Dry conditions largely prevailed on through the fall and into early winter, further exacerbating the drought. By late 2020, exceptional drought, the worst category, prevailed from the southwest Texas Panhandle and western South Plains through the Big Bend. Further east, moderate to severe drought was common across the southeast Texas Panhandle into the Rolling Plains, while much of the state experienced some form of drought.
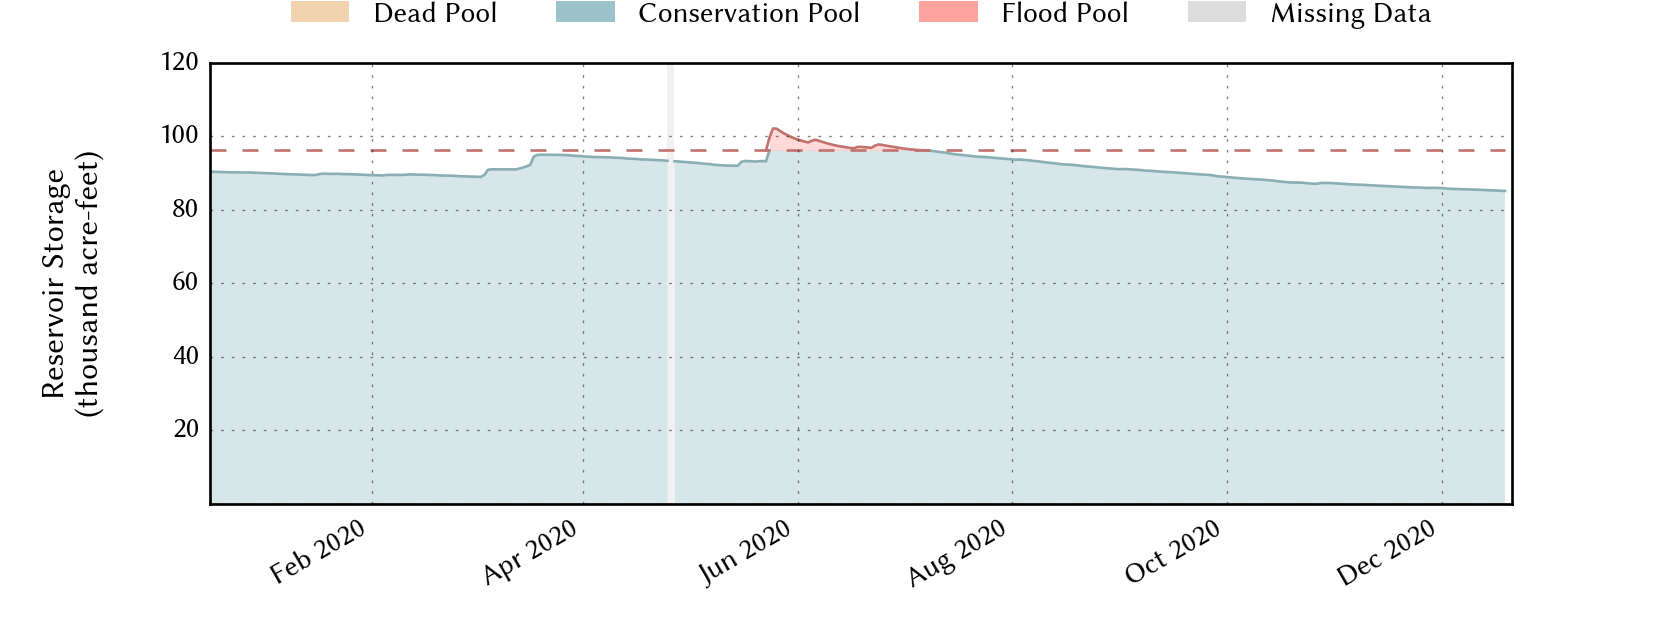
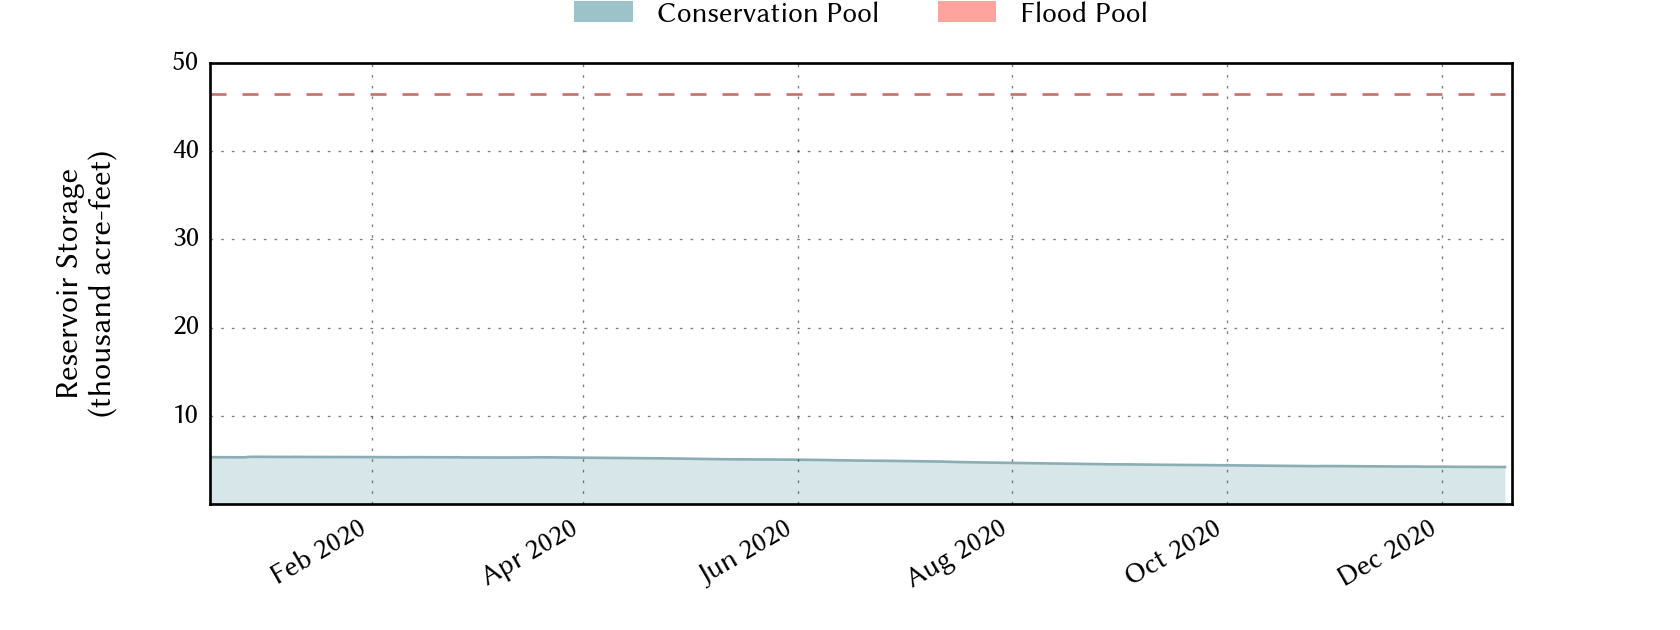
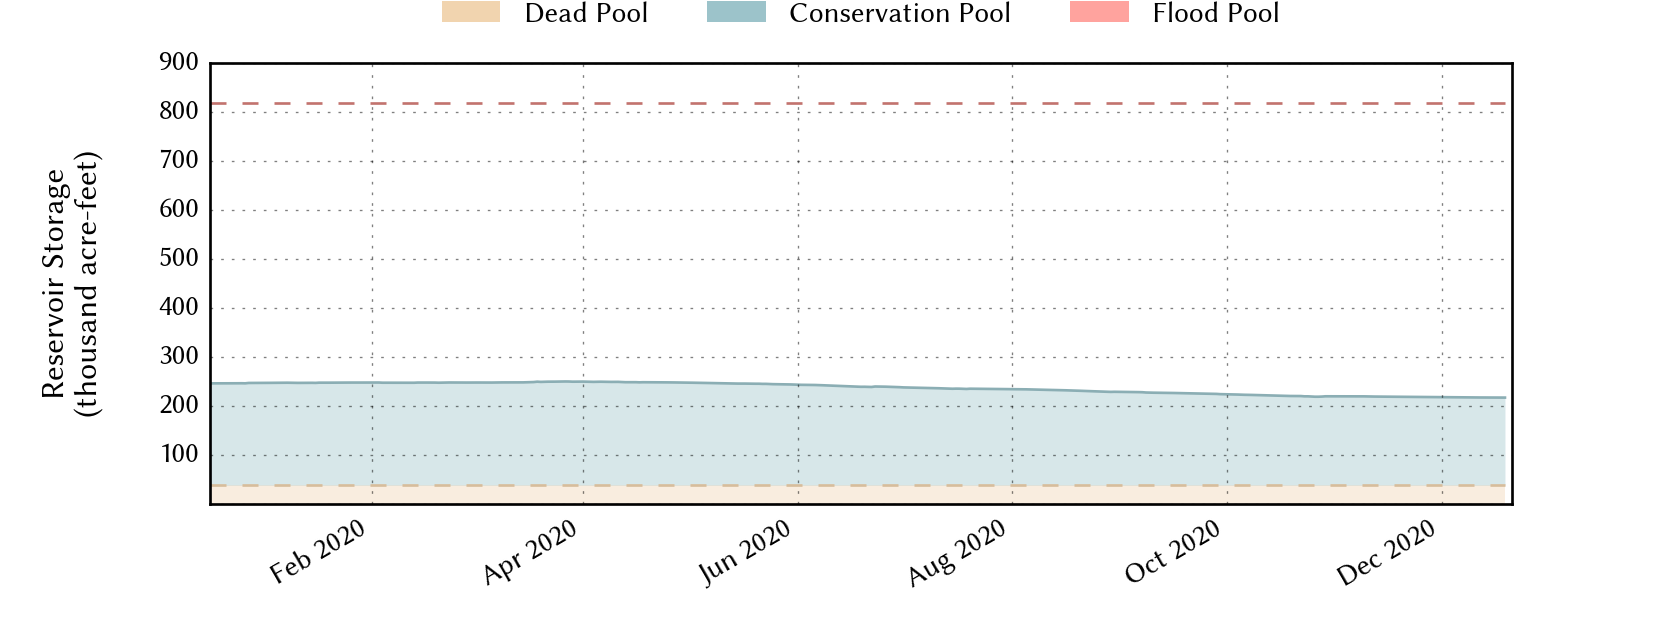
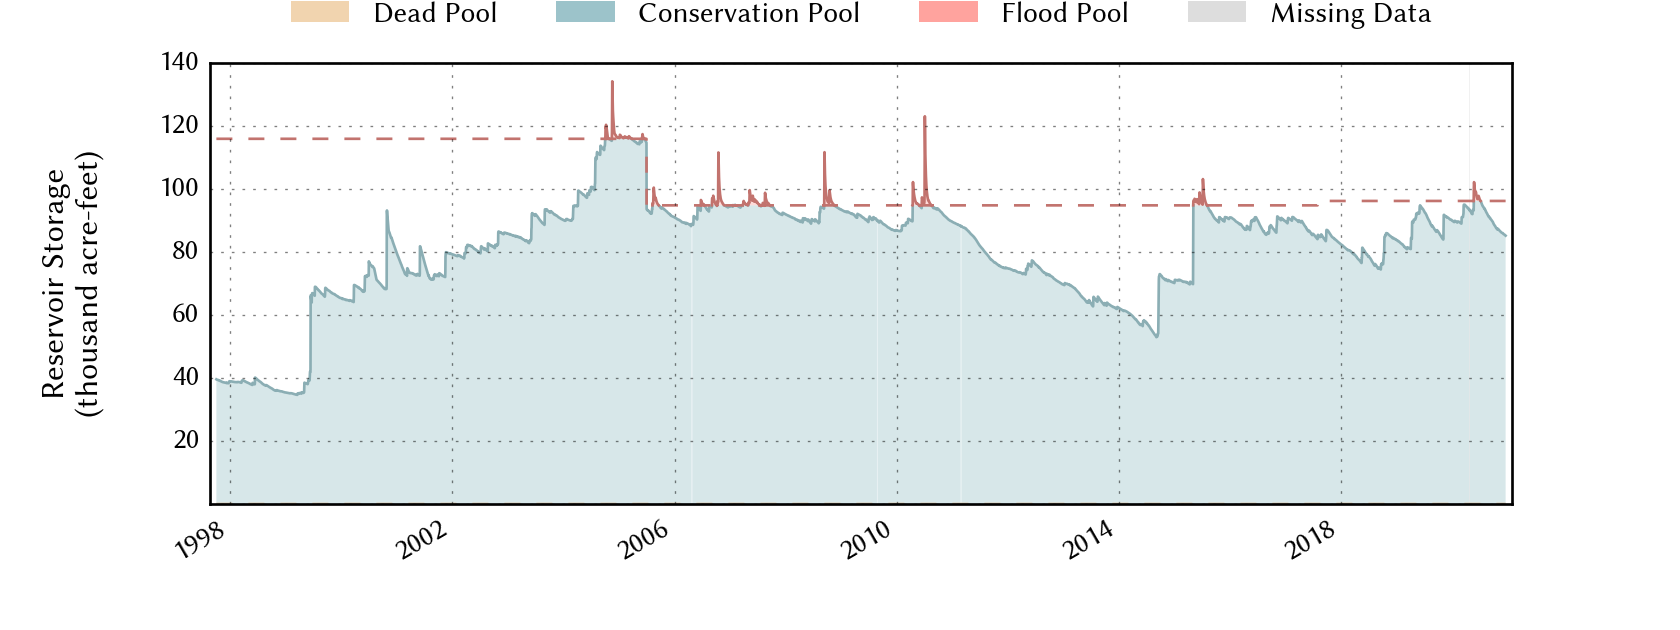
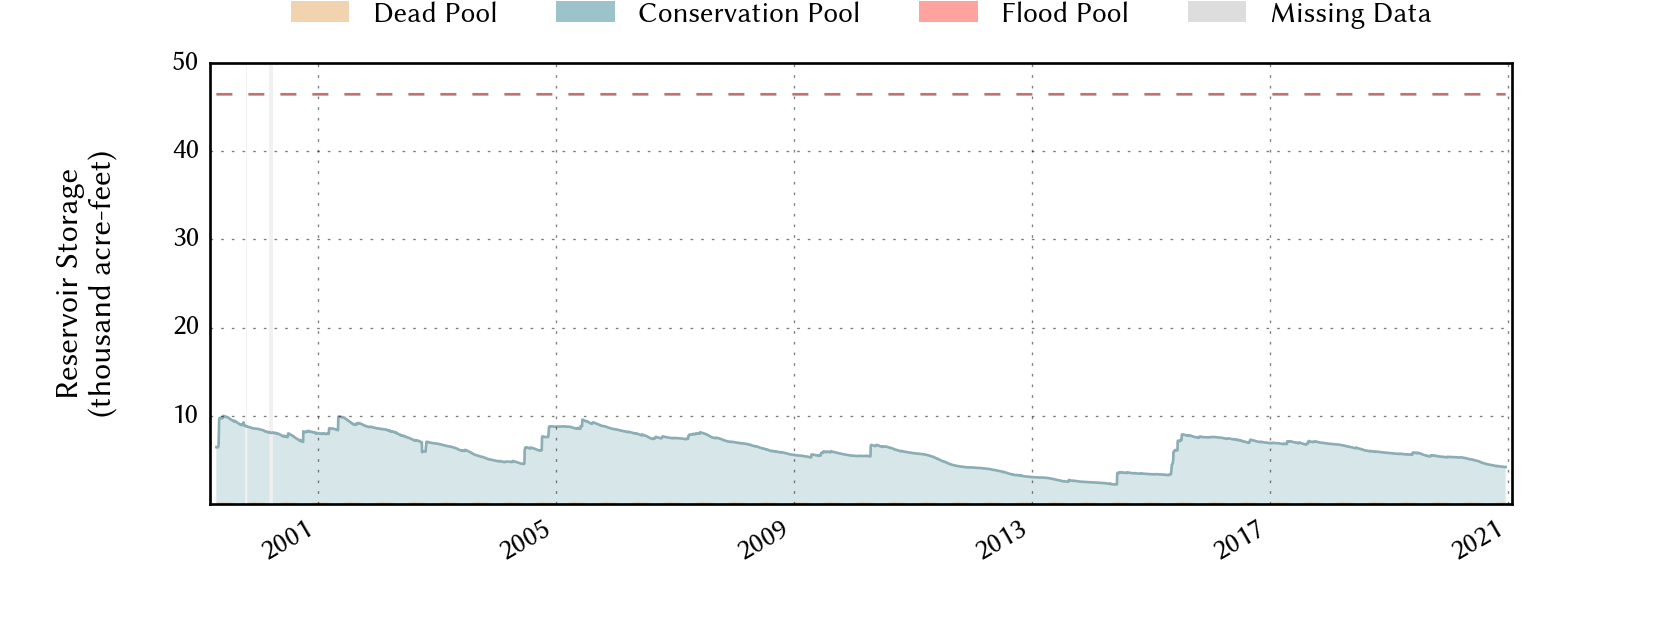
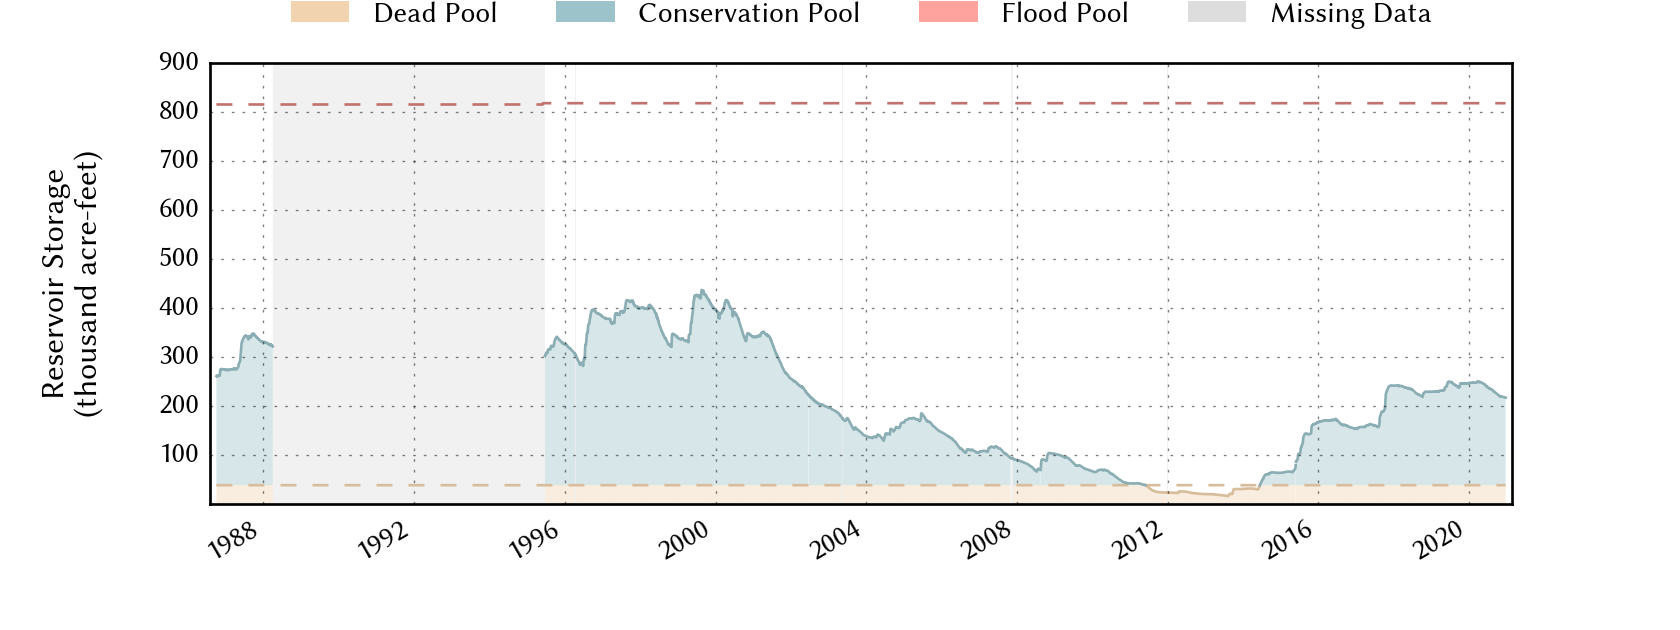
The relatively dry spring, summer and fall caused all of our area reservoir levels to drop over the course of 2020. Lake Alan Henry did briefly fill in late May, thanks to a well-placed nearly stationary tornadic thunderstorm that dropped torrential rain just upstream of the lake. However, even Lake Alan Henry lost more water in the second half of the year than it gained in the spring. Over the entire year of 2020, Lake Meredith (from 42% to 36%), Lake Alan Henry (from 94% to 89%), White River Lake (from 19% to 12%) and Lake Mackenzie (from 11% to 9%) each measured net decreases in their conservation levels.
|
||||||||||||||||||||
|
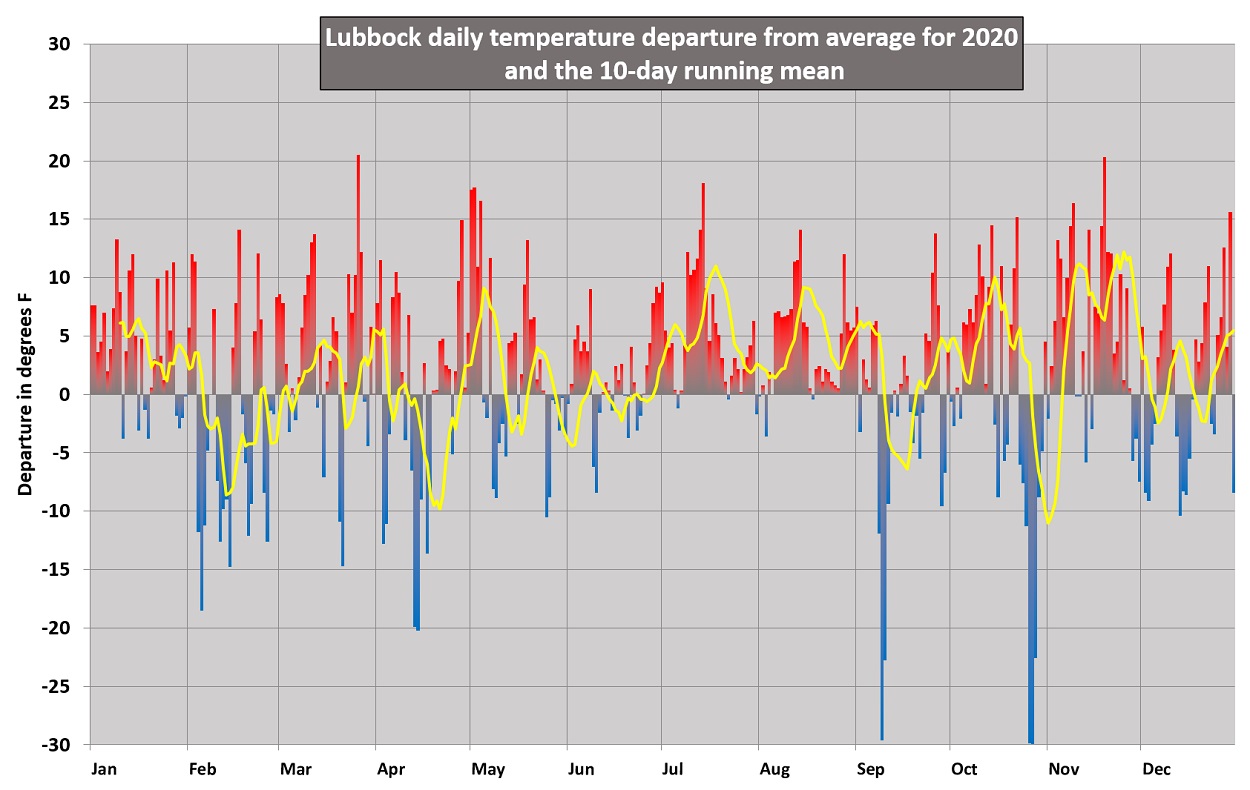
2020 will go down in the books as the 6th warmest and 11th driest year since records began in 1911 at Lubbock. Mean monthly temperatures were warmer than average for 9 months and cooler than average 3 months (February, September and October). The warmest months, with respect to average, were November (+5.3°F), July (+5.2°F), and January, March and August (all +4.2°F). The coolest months, with respect to average, were February (-1.9°F) and September (-1.6°F).
Precipitation was tough to come by in 2020. Eleven months recorded below average rainfall, with only March finishing above average. In a rarity, the wettest month of the year was March, tallying 2.37 inches of rain (1.27 inches above the monthly average). Only one other month, May, recorded over 2 inches of rainfall, just barely (2.06"), while 7 months measured under an inch of rainfall and 3 recorded less than a tenth of an inch. The year saw 2.7" of snow fall at Lubbock, including 1" in January, 1.1" in February and 0.6" in October. The Lubbock Airport recorded a total of 11.55 inches of precipitation for 2020, finishing 7.57 inches below average. Not surprisingly, no daily rainfall records were set in 2020 and only one day recorded an inch or more of rain, July 5th when 1.01 inches fell.
The hottest temperature in 2020 was 111°F, reached on July 14th. The high reached or exceeded 105°F on 6 other occasion: July 13th (110°F); August 14th (107°F); August 13th (107°F); July 11th (106°F); July 12th (105°F); and July 9th (105°F). In all, temperatures reached the triple digits on 29 occasions, well above the long-term average of 10. On the other side of the pendulum, the coldest temperature of the year was a chilly 13 degrees, experienced February 6th. Eight nights fell below 20°F for the entire year. Fifteen record highs were tied or set in 2020: 92°F on March 26th; 96°F on April 28th; 101°F on May 1st; 100°F on May 2nd; 110°F on July 13th; 111°F on July 14th; 107°F on August 13th; 107°F on August 14th; 103°F on August 28th; 100°F on September 26th; 98°F on October 10th; 96°F on October 11th; 97°F on October 14th; 89°F on October 22nd; and 88°F on November 4th. The 111°F also set an all-time record high for July, and tied for the 4th hottest day on record. In addition, 17 record high minimum temperatures were set or tied in 2020, including an all-time record high minimum of 86°F on June 14th. The low of 86°F shattered the previous record high minimum by 5 degrees (81°F on June 19, 2018). Five record lows were tied or set in 2020: 45°F on September 8th; 41°F on September 9th; 43°F on September 10th; 23°F on October 26th; and 22°F on October 27th. In addition, 5 record low maximum temperatures were set in 2020 within two cold stretches of mid-September and late October.
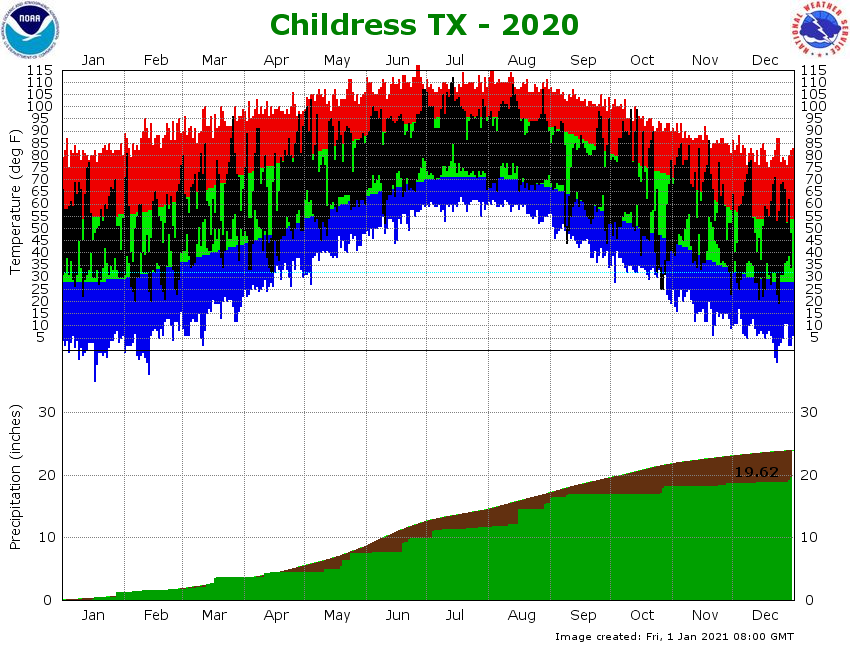
The upper section of the below graph shows the daily high and low temperature distribution for 2020 at Lubbock Preston Smith International Airport. A majority of the year yielded temperatures at or above average, with 9 of the 12 months finishing warmer than average. July and November were particularly warm when compared to average, concluding over 5 degrees above average. Temperatures definitely favored the high side of average through much of the middle of the year, giving an extra boost to the already hot time of the year. The coolest month, with respect to average, was February, which experienced a few cold air intrusions and finished 1.9 degrees below average. A couple of notable visits of unseasonably cool air occurred in mid-September and late October when temperatures were 20-30 degrees below average for 2-3 day stretches, while a few shots of cold air also occurred through the first half or so of April. The final week of the year concluded on the mild side, except for the final day, when temperatures were stuck in the 20s and 30s and a trace of snow fell.
The bottom section of the chart above shows how much rain accumulated through 2020. Lubbock finished with a grand total of 11.55 inches, over 7 inches below the 30-year average. The year began on an unsettled note, with several bouts of rain and snow through mid-March. In response, precipitation totals were running slightly above average through March. Thereafter, rainfall became inconsistent with no "big" rain events over Lubbock through the remainder of the year. Rainfall deficits gradually increased through the spring, growing further through the summer and fall. The final three months of the year combined brought less than an inch of rainfall
2020 snowfall tallied to 2.7 inches. The bulk of the snow fell at the beginning of the year with 1 inch falling on January 11th, 0.5 inches falling of February 5th and 0.6 inches falling from February 11th to the 12th. The latter part of the year was relatively dry, though it did feature a late October shot of cold air that was accompanied by freezing rain, sleet and snow. Lubbock officially recorded 0.6 inches of sleet and snow on October 27th. The snow/sleet in October was noteworthy in the fact that it was the 4th earliest measurable snowfall on record for Lubbock, trailing only October 24, 2019 (0.1"), October 21, 1911 (4.1") and October 17, 1999 (0.6"). The 2.7 inches of snow in 2020 ranks as the 25th lowest yearly snow total on record.
|
|
|
| JANUARY: |
| FEBRUARY: |
| MARCH: |
| APRIL: |
| MAY: |
| JUNE: |
| JULY: |
| AUGUST: |
| SEPTEMBER: |
| OCTOBER: |
| NOVEMBER: |
| DECEMBER: |


