|
Drought Intensifies Across West Texas |
||||||||||||||||||||||||||||||||||||||||||||||||
| After bouts of heavy precipitation during the spring and summer of 2010, dry weather has taken hold of the South Plains region through the winter and into this spring of 2011. Although winters in West Texas are often relatively dry, this stretch has drawn on longer than most. In fact, as of May 8rd, total yearly precipitation at Lubbock officially stood at 0.88 inches, or 2.86 inches below the average of 3.74 inches. | ||||||||||||||||||||||||||||||||||||||||||||||||
|
|
||||||||||||||||||||||||||||||||||||||||||||||||
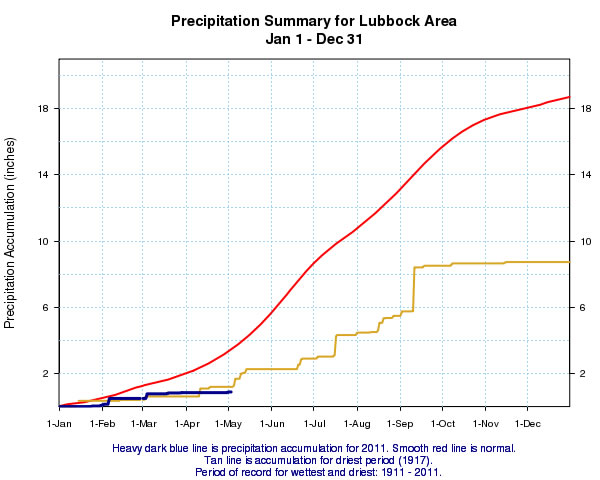
| Graph displaying the precipitation accumulation at Lubbock for 2011 (heavy blue line). Also displayed is the normal precipitation (red line) and the precipitation accumulation during the driest year on record in 1917 (tan line). | ||||||||||||||||||||||||||||||||||||||||||||||||
| The above graph illustrates how the rainfall deficit has grown through the first third of the year. The current yearly rainfall totals are actually below the pace of the driest year on record in 1917. This has led to an intensification of the drought across the area, fueled further by the above average temperatures this spring. Lubbock saw temperatures average over 5 degrees above normal in April, making it the 5th warmest April on record. This was on the heels of a March that was also well above normal. To view the latest drought statement issued by the Lubbock NWS CLICK HERE. | ||||||||||||||||||||||||||||||||||||||||||||||||
|
||||||||||||||||||||||||||||||||||||||||||||||||
|
The table above shows that the first four months of 2011 are tied for the 4th driest start to the year on record. This included the driest April on record, when no precipitation fell for the first time in the 100 years of records (many other Aprils did have less than 1/4 inch though). However, the right-most column does offer some hope, as many of those same years that started very dry were followed by near average to above average rainfall through the growing season (May - August, which averages 9.78 inches). In fact, the two driest starts to the year were followed by a relatively wet next 4-month period. Looking back even further, into late last year, we see that the recent November through April stretch was the driest such 6-month stretch on record, as the table below illustrates. Only 1996 was a close second. |
||||||||||||||||||||||||||||||||||||||||||||||||
|
||||||||||||||||||||||||||||||||||||||||||||||||
|
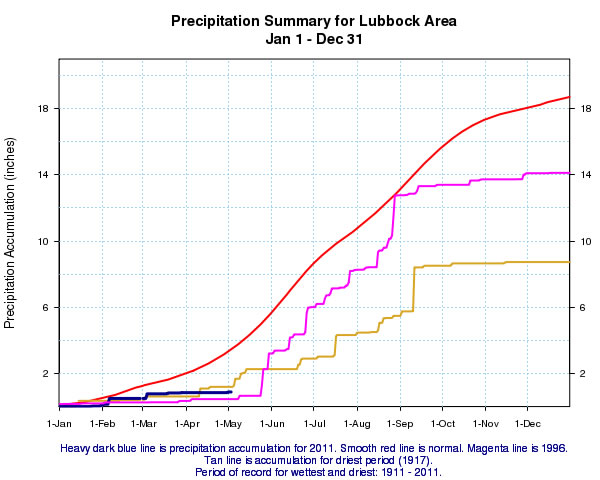
Looking a little closer at 1996, the below graph does show that after the very dry beginning to the year rain intensity and frequency increased dramatically from late May on through much of August before drying out again at the end of the year. The rainfall accumulation even approached average by late August before the regular precipitation shut off again to close out the year. |
||||||||||||||||||||||||||||||||||||||||||||||||
|
|
||||||||||||||||||||||||||||||||||||||||||||||||
| Graph displaying the precipitation accumulation at Lubbock for 2011 (heavy blue line). Also displayed is the normal precipitation (red line), the precipitation accumulation during the driest year on record in 1917 (tan line), and the precipitation accumulation in 1996 (magenta). | ||||||||||||||||||||||||||||||||||||||||||||||||
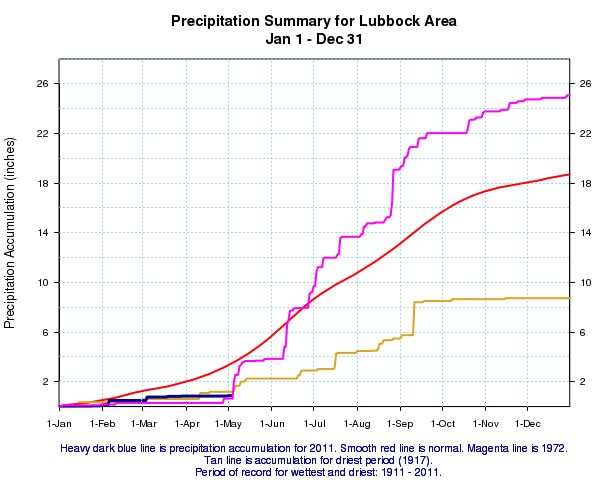
| If you are hoping for the rainfall to really turn on for the remainder of this year, 1972 offers the best climatological hope. After a dry start to 1972, rainfall really picked up in early May, with regular precipitation continuing on through the remainder of the year. By the end of 1972, the annual rainfall stood more than 6 inches above average. | ||||||||||||||||||||||||||||||||||||||||||||||||
|
|
||||||||||||||||||||||||||||||||||||||||||||||||
| Graph displaying the precipitation accumulation at Lubbock for 2011 (heavy blue line). Also displayed is the normal precipitation (red line), the precipitation accumulation during the driest year on record in 1917 (tan line), and the precipitation accumulation in 1972 (magenta). | ||||||||||||||||||||||||||||||||||||||||||||||||
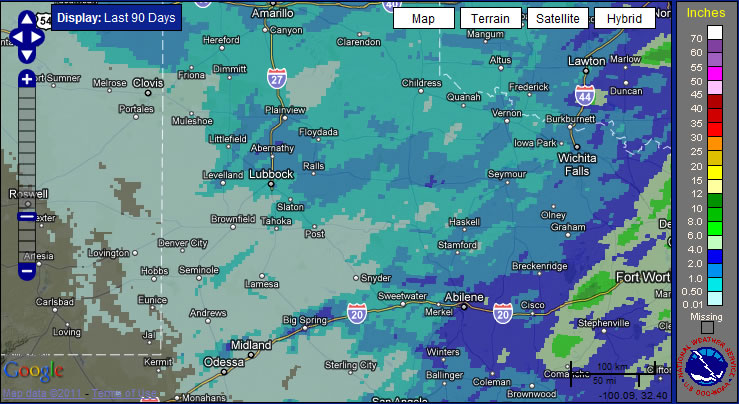
| The parched conditions haven't been confined to the Lubbock area. The below image depicts very low rainfall totals across all of West Texas over the past 90 days. Many locations south and west of Lubbock have seen even less precipitation in the last three months than Lubbock. | ||||||||||||||||||||||||||||||||||||||||||||||||
 |
||||||||||||||||||||||||||||||||||||||||||||||||
| Radar estimated (and bias corrected) rainfall over the past 90 days, ending on May 4, 2011. To view the latest analysis CLICK HERE. | ||||||||||||||||||||||||||||||||||||||||||||||||
| Not surprisingly, these very light amounts of precipitation so far in 2011 have resulted in large negative departures from the average, as shown below. Through early May, much of the region has seen rain totals of 25% or less of average, with pockets of little to no rainfall across the southwest South Plains. | ||||||||||||||||||||||||||||||||||||||||||||||||
|
||||||||||||||||||||||||||||||||||||||||||||||||
| Year to date precipitation departure from normal (left) and percent of normal (right) through May 4, 2011 for the South and Rolling Plains. Click on the images for a larger view. To view the latest analysis CLICK HERE. | ||||||||||||||||||||||||||||||||||||||||||||||||
|
It is difficult to accurately predict how the remainder of 2011 will play out with regards to precipitation at a single point, like Lubbock. However, the current long range forecast from the Climate Prediction Center (CPC) calls for a better chance than normal of a warmer and drier May than average for the South Plains area. Moving into the summer months, the forecast is for those warmer conditions to likely persist, though the chances of seeing near average summer rainfall returns to near normal. Time will tell. Before then, the ongoing warm and dry conditions, worsening drought and near record to record dry fuels, have also resulted in very favorable conditions for large and dangerous wildfires in the region this spring. Until we see meaningful and widespread rainfall, a good green-up and a decrease in the overall winds, the fire danger will continue to remain high to extreme. If you would like to read more detailed information on some of the wildfires we have seen already this year explore the following pages: The February 2011 Wildfires Page Now that we know it has been uncharacteristically dry over the last half a year or so, one may wonder what is the cause? Of course, this is always a difficult question to answer as the daily weather depends on many factors that change from day to day. Still, larger-scale weather patterns/forcing can dictate, at least to a degree, the the type of weather a region may be more favored to experience. Over this past fall and winter season (2010-2011), a moderate La Niña developed across the equatorial Pacific. The development of La Niña conditions often induces a weather pattern that results in warmer and drier weather over West Texas through the winter months, of which this past season was no exception. La Niña conditions were easing this spring and the forecast is for neutral conditions to return this summer. The combination of transitioning out of winter and the likely demise of La Niña make the future long-term forecast of precipitation trends less certain, given much weaker predictive signals. Since 1950, slightly over half of the summer months that occurred during neutral conditions saw precipitation totals above normal. So there does remain hope that rains will return more regularly over the coming months, with near or above average summer rainfall at least a 50/50 bet. In addition, two years that closely resemble the El Niño-Southern Oscillation (ENSO) pattern seen from 2010 to this point, and started very dry (1984 and 1996), did finish with summer rainfall near to above average. Still, the annual rainfall totals for both 1984 and 1996 finished over 4 inches shy of average. |
||||||||||||||||||||||||||||||||||||||||||||||||


