National Weather Service United States Department of Commerce
Tropical Rains Pound the South Plains Region, 1-4 July 2010
 Photograph of a flooded park in southwest Lubbock
Clifford H. Andrews Park (near Memphis and south Loop 289 in Lubbock) - photo courtesy Jason Jordan

The July 4th holiday weekend brought rounds of heavy rain that resulted in areas of flooding and flash flooding across portions of the South Plains and Rolling Plains. Over a four day period, from July 1st through the 4th, many locations from the southwest South Plains through the southeast Texas Panhandle and the entire Rolling Plains received over 3 inches of rain, with a swath of 5 to 10 inches plus from Terry County eastward through Lubbock, Lynn, Dickens, Garza and Kent Counties. The West Texas Mesonet site located 1 mile north of O’Donnell recorded a 4-day total of 10.24 inches of rain, much of which fell late on the 3rd (Saturday) and early on the 4th (Sunday). The Lubbock Airport officially recorded a 4-day total rainfall of 6.12 inches, and set daily rainfall records on the 2nd and the 3rd, when 2.19 inches and 3.27 inches were recorded, respectively.  Interestingly, 6.12 inches of rain already ranks as the 5th wettest July on record.  The wettest July occurred in 1976 when 7.20 inches fell.


Graphic displaying measured rainfall that fell between 1 July and 4 July 2010

The graphic above displays measured rainfall that fell between 1 July and 4 July 2010. Much of the rainfall fell between Saturday evening (3rd) and Sunday morning (4th). The rainfall data is courtesy of the Texas Tech West Texas Mesonet. Click on the image for a larger view.

The rounds of widespread heavy rainfall were a product of deep tropical moisture interacting with several slowly moving upper level disturbances that tracked overhead. The stage for heavy rainfall was initially set, in part by Hurricane Alex.  Alex came ashore late on 30th of June, about 100 miles south of Brownsville, Texas, as a strong category 2 tropical cyclone.   Alex weakened and eventually lost its identity as it tracked westward into the higher terrain of Mexico, but plentiful amounts of tropical moisture were brought northward into West Texas by southerly winds through much of the depth of the atmosphere. Once the moisture was in place, all that was needed was a trigger, which was supplied by several subtle, but efficient, upper level disturbances.


Regional radar loop displaying the heavy rain that was falling around Lubbock between 9:18 pm and 10:28 pm on 3 July 2010.

Regional radar loop displaying the heavy rain that was falling around Lubbock between 9:18 pm and 10:28 pm on 3 July 2010. To view a few other select radar loops taken throughout this wet period click on the desired time:  Late afternoon of Saturday, 3 July  -  Morning of Saturday, 3 July  -  Early evening of Friday, 2 July  -  Late afternoon of Friday, 2 July  -  Early evening of Thursday, 1 July

The first round of rain developed and moved northward into the Rolling Plains and southeastern South Plains late Thursday and early Friday, the 1st and 2nd of July, with scattered half inch to inch plus rain totals.  Another couple of rounds of moderate to heavy rainfall followed the next 24 hours, falling across the same area.  Rain totals of 2 to 5 inches were common through this period. The repeated rain began to cause flooding problems, mostly around playa lakes and other low lying and poor drainage areas across the central and southern South Plains. Then, to top it off, a more intense area of tropical rain developed during the evening of the 3rd and tracked slowly eastward, bringing copious amounts of precipitation across this same region.  Some locations saw another 5 to 10 inches plus with this final round of torrential rain, which resulted in many areas of flooding and flash flooding, especially across parts of Lynn, Lubbock and Garza Counties.


Satellite image of West Texas around midday on 3 July 2010
Image from the NASAS MODIS satellite around 1 pm Sat., July 3rd. The arrow in the lower right points to a swirl in the clouds which indicates a small-scale vortex which enhances upward motion and thunderstorm development. This vortex moved northeast across the South Plains Saturday evening and into the Rolling Plains early Sunday morning and was partially responsible for the heavy rainfall during that time. Click on the image for a larger view.

Numerous roads were inundated with water and many roads were closed. Swelling playa lakes flooded many cars, roads and homes, and several high water rescues occurred.  Portions of Lubbock, Post and Ransom Canyon were particularly hard hit. A stretch of Farm-to-Market Road 669 was washed out by flowing flood waters south of Post, and large stretches of Highway 380 on the Caprock west of Post were covered in water. Below are a few scenes of the flooding around south Lubbock.


Lakeridge Golf Course in Lubbock. Click on the image to enlarge it.
View of the Willie McCool and War Memorials at Huneke Park - click to enlarge the image
View of flooding along the access road of south Loop 289 - click to enlarge the image

Pictures of flooding in south Lubbock taken on the 3rd and 4th of July 2010. Click on each image to view a larger version.


As the heavy rain tapered off and shifted east Independence Day, the threat turned to river flooding. Water draining off the Caprock and into the Double Mountain Fork of the Brazos caused the river to rapidly rise above flood stage near Justiceburg, where it crosses under Highway 84. After the sharp rise, the river crested at 20.66 feet during the late afternoon, almost 2 feet above flood stage, before rapidly dropping that night. At its peak, the Brazos River briefly touched the I-beams of the Highway 84 Bridge, but it remained 2-3 feet short of flooding the highway itself.   All this water dumped into Lake Alan Henry, and pushed the lake nearly 10 feet above the operational spillway. This water eventually moved downstream, and the Brazos crested at 12.8 feet, almost 3 feet above flood stage, late Wednesday afternoon (July 7th) 10 miles south of Aspermont, where it crosses under Highway 83. The flooding was limited to minor lowland flooding along the north side of the bank of the river. Below are some images of the flooding around the southern South Plains.

The swollen Double Mountain fork of the Brazos flowing under the bridge near Justiceburg
The north fork of the Double Mtn Fork of the Brazos northeast of Post
Flooding along U.S. Highway 280 in western Garza County
Flooding along U.S. Highway 380 in eastern Lynn County
Pictures of the flooding in Garza and eastern Lynn Counties. Click on each image to view a larger version.


Below are a few interesting notes regarding this early July heavy rain event:

- Very little lightning was observed through the duration of the rain event. This is thanks, in most part, to the tropical nature of the event.  The atmosphere was extremely moist and relatively cool at ground level and very moist but relatively mild in the mid-levels.  The incredibly moist atmosphere and deep warm cloud layer was prime to produce very efficient rainfall.  However, the relatively slow cooling of the atmosphere with increasing height and resulting lack of strong instability was not conducive to produce strong updrafts and large amounts of graupel, which is critical to lightning production.  Thus, you get a lot of rain and little or no lightning.  

- Even through July has just begun, Lubbock is already threatening the monthly rainfall record.  This July currently stands as the 4th wettest on record, as of July 9th.  Below is a list the top 5 wettest Julys on record for the Lubbock Airport:

1976: 7.20”
1928: 6.78”
1911: 6.75”
2010: 6.35”
1914: 6.17”


- The couple of heavy rain events this year, including the one in mid-April, coupled with a wet start to the year overall have pushed the official rainfall total for the year at the Lubbock Airport to 20.73 inches through July 9th. This is 11.47 inches above the normal of 9.26 inches to this point. Interestingly, the yearly total already exceeds the average yearly precipitation of 18.69 inches.  The wettest year on record is 1941, when 40.55 inches fell.

- Though the South Plains region received a large amount of rain during this prolonged precipitation event, even heavier amounts of rain fell into parts of northeast Mexico, as the graphic below demonstrates.  The tremendous amount of runoff from all this rain was resulting in major flooding along the Rio Grande from Del Rio southward.


Graphic produced by NCEP that shows the approximate track of Alex, and also a rough estimate of how much rain fell in association with all the tropical moisture Alex pulled into the south-central U.S. and parts of Mexico. Click on the image for a larger view.

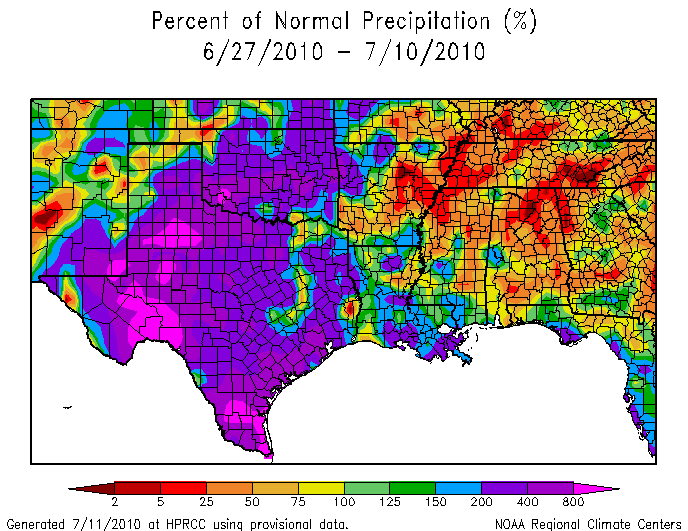
- Another way to put the rain into perspective is to look at the percent compared to normal.  The below map shows that most of Oklahoma and Texas saw well above normal during the two week span from late June through early July 2010.  Much of the South Plains and Rolling Plains received an astounding 400 to 800% or more of normal.  The exception was across the southwest Texas Panhandle and extreme northwest South Plains where totals were near or just slightly above average for the two week period.


Map displaying the percent of normal precipitation that fell in the two week period between June 27th and July 10th, 2010.  Click on the image for a larger view.
Map displaying the percent of normal precipitation that fell in the two week period between June 27th and July 10th, 2010.  Click on the image for a larger view.

- The below map also shows how much rain has fallen across the south-central United States this year, through July 12th, 2010, as a percent of normal.  The map also reflects that much of the western half of Texas, as well as South Texas, has recorded above normal to much above normal precipitation to this point.  Many locations over the South and Rolling Plains are running 1.5 to 3 times that of normal through the first half of the year.


Map displaying the percent of normal precipitation that has fallen for the year to date through July 12th, 2010.  Click on the image for a larger view.
Map displaying the percent of normal precipitation that has fallen for the year to date through July 12th, 2010.  Click on the image for a larger view.


For additional information on the South Plain's heavy rains, please visit the West Texas Mesonet summary for this event via this link: The South Plains Flood of 2010.