|
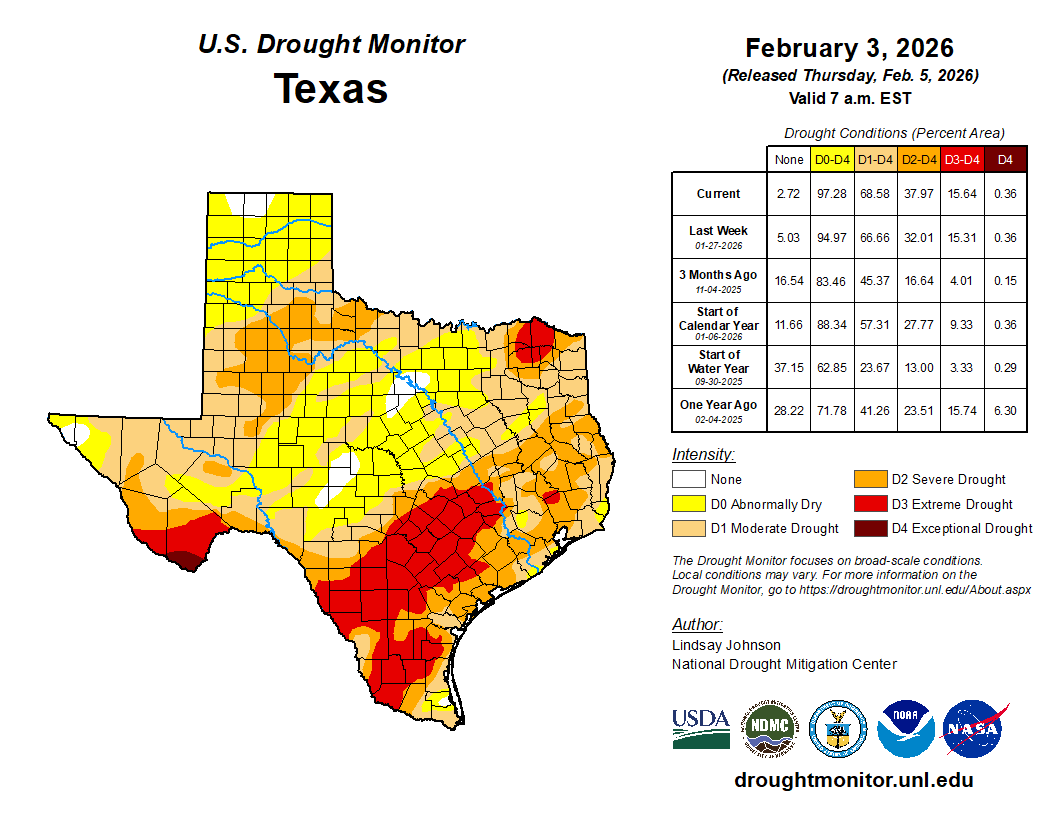
Drought Information for West Texas |
||
 |
||
| Click on the above image to go to the Drought Monitor webpage. | ||
|
|
||
| Recent Precipitation for Lubbock's County Warning Area | ||
| 7-day Precipitation | 7-day Percent of Normal | 7-day Departure from Normal |
| 14-day Precipitation | 14-day Percent of Normal | 14-day_Departure from Normal |
| 30-day Precipitation | 30-day Percent of Normal | 30-day_Departure from Normal |
| 60-day Precipitation | 60-day Percent of Normal | 60-day_Departure from Normal |
| 90-day Precipitation | 90-day Percent of Normal | 90-day_Departure from Normal |
| 180-day Precipitation | 180-day Percent of Normal | 180-day_Departure from Normal |
| 365-day Precipitation | 365-day Percent of Normal | 365-day_Departure from Normal |
 |
||
|
1 Month Standardized Precipitation Index, calculated by Climate Division. Similar calculations for longer periods of time can be found at: 2 Months; 3 Months; 6 Months; 1 Year; 2 Years; and 3 Years. Additional data can be obtained at: https://wrcc.dri.edu/Monitoring/spi_products.php. Another great precipitation and temperature plotting resource is: |
||
|
|
||
| Hydrologic Conditions | ||
 |
||
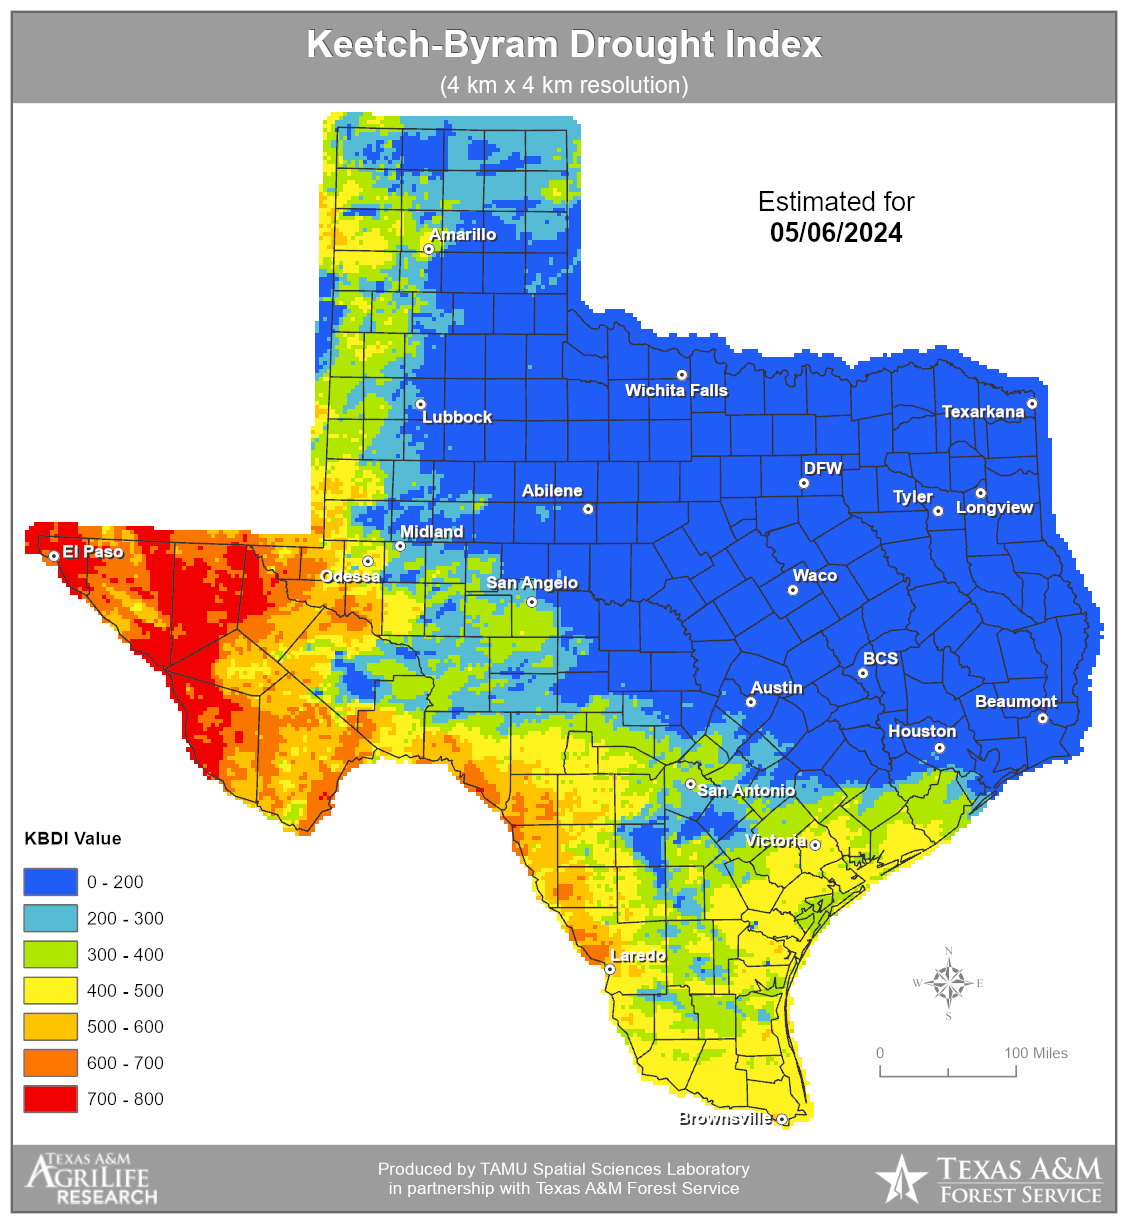
| Keetch-Bryam Drought Index (KBDI) | ||
| The KBDI is based on precipitation and soil moisture (measures moisture depletion from 0 [no moisture depletion] to 800 [absolutely dry]). Values of 600 to 800 are often associated with severe drought and increased wildfire potential. | ||
 |
||
| Palmer Drought Severity Index (PDSI) | ||
| The PDSI uses temperature and rainfall information in a formula to determine dryness. The Palmer Index is most effective in determining long term drought, a matter of several month, and is not as good with short-term forecasts (a matter of weeks). It uses a 0 as normal, and drought is shown in terms of minus numbers; for example, minus 2 is moderate drought, minus 3 is severe drought, and minus 4 is extreme drought. The Palmer Index can also reflect excess rain using a corresponding level reflected by plus figures; i.e., 0 is normal, plus 2 is moderate rainfall, etc. The advantage of the Palmer Index is that it is standardized to local climate, so it can be applied to any part of the country to demonstrate relative drought or rainfall conditions. The negative is that it is not as good for short term forecasts, and is not particularly useful in calculating supplies of water locked up in snow, so it works best east of the Continental Divide. | ||
| Additional soil moisture information can be found at the Climate Prediction Center. | ||
|
|
||
| Reservoir Levels (Water for Texas) | ||
| Lake Alan Henry | ||
| White River Lake | ||
| Mackenzie Lake | ||
| Lake Meredith | ||
|
|
||
| Agricultural Impacts from Drought | ||
| Texas A&M Texas Crop and Weather Report (search for the latest "Crop and Weather Report" on the page, which is usually found under the main headline of the article) | ||
| Texas and Southwest Cattle Raisers Association (may carry Texas A&M crop report, etc.) | ||
| USDA Weekly Weather and Crop Report (national summary) | ||
| Plains Cotton Cooperative Association Cotton Market Weekly | ||
| NASS Crop Progress Reports | ||
| U.S. Agriculture Commodities in Drought (maps, tables and time series) | ||
|
|
||
| Drought Mitigation Actions | ||
 |
||
| Texas Burn Ban Map | ||
| Water Restrictions in place? Must search local municipalities (Lubbock, Plainview, etc.). | ||
|
|
||
| National Drought Outlook | ||
 |
||
| U.S. Monthly Drought Outlook | ||
 |
||
| U.S. Seasonal Drought Outlook | ||
|
|
||
| Extended Temperature & Precipitation Outlook | ||
  |
||
| 6-10 day temperature (left) and precipitation (right) outlook | ||
 |
||
| 8-14 day temperature (left) and precipitation (right) outlook | ||
| Monthly and seasonal temperature and precipitation outlooks can be VIEWED HERE. | ||
|
|
||
| Fire Danger Hazard | ||
| South Plains (Caprock) Graph | Rolling Plains (Off Cap) Graph | |
| Energy Release Component (ERC) trend for the High Plains (left) and Rolling Plains (right). | ||
| Also, refer to the KBDI displayed in Hydrologic Conditions section. | ||

