 |
St. Patrick's Day Climatology |  |
|
Saint Louis, Missouri |
||||||||||||||||||||||||||||||||||||||||||||||||||||||
| Daily Records | Daily High Temperature | Daily Low Temperature | Daily Average Temperature | Daily Precipitation | Daily Snowfall | Morning Snow Depth | ||||||||||||||||||||||||||||||||||||||||||||||||
| Maximum Value |
83 (2011) | 59 (2012) | 70 (2012) | 1.34 (2012) | 2.5 (1893, 1949) | 7 (1960) | ||||||||||||||||||||||||||||||||||||||||||||||||
| Minimum Value |
24 (1906) | 10 (1900) | 19 (1906) | 0 | 0 | 0 | ||||||||||||||||||||||||||||||||||||||||||||||||
| Average Value |
55 | 36 | 46 | 0.11 | 0.1 | - | ||||||||||||||||||||||||||||||||||||||||||||||||
| Number of Occurrences |
- | - | - | 45 (≥ 0.01) | 10 (≥ 0.01) | 7 (≥ 1.0) | ||||||||||||||||||||||||||||||||||||||||||||||||
| Number of Occurrences |
- | - | - | 59 (≥ Trace) | 23 (≥ T) | 9 (≥ T) | ||||||||||||||||||||||||||||||||||||||||||||||||
|
Fun Facts!
|
||||||||||||||||||||||||||||||||||||||||||||||||||||||
|
Records: |
||||||||||||||||||||||||||||||||||||||||||||||||||||||
|
Columbia, Missouri |
||||||||||||||||||||||||||||||||||||||||||||||||||||||
| Daily Records | Daily High Temperature | Daily Low Temperature | Daily Average Temperature | Daily Precipitation | Daily Snowfall | Morning Snow Depth | ||||||||||||||||||||||||||||||||||||||||||||||||
| Maximum Value |
83 (1894) | 59 (2012) | 70 (1894) | 2.40 (2021) | 2.4 (1924) | 13 (1960) | ||||||||||||||||||||||||||||||||||||||||||||||||
| Minimum Value |
26 (1906) | 8 (1900, 1906) | 17 (1906) | 0 | 0 | 0 | ||||||||||||||||||||||||||||||||||||||||||||||||
| Average Value |
56 | 34 | 45 | 0.10 | 0.1 | - | ||||||||||||||||||||||||||||||||||||||||||||||||
| Number of Occurrences |
- | - | - | 38 (≥ 0.01) | 11 (≥ 0.1) | 6 (≥ 1.0) | ||||||||||||||||||||||||||||||||||||||||||||||||
| Number of Occurrences |
- | - | - | 56 (≥ Trace) | 21 (≥ T) | 14 (≥ T) | ||||||||||||||||||||||||||||||||||||||||||||||||
|
Fun Facts!
|
||||||||||||||||||||||||||||||||||||||||||||||||||||||
| Records: (1890-present) Temperature/Precipitation (1890-present) Snowfall (1893-present) Snow Depth |
||||||||||||||||||||||||||||||||||||||||||||||||||||||
|
Quincy, Illinois |
||||||||||||||||||||||||||||||||||||||||||||||||||||||
| Daily Records | Daily High Temperature | Daily Low Temperature | Daily Average Temperature | Daily Precipitation | Daily Snowfall | Morning Snow Depth | ||||||||||||||||||||||||||||||||||||||||||||||||
| Maximum Value |
79 (1966, 2012) | 58 (2012) | 69 (2012) | 1.74 (1951) | - | - | ||||||||||||||||||||||||||||||||||||||||||||||||
| Minimum Value |
26 (1993) | -2 (1906) | 15 (1906) | 0 | - | - | ||||||||||||||||||||||||||||||||||||||||||||||||
| Average Value |
52 | 32 | 42 | 0.07 | - | - | ||||||||||||||||||||||||||||||||||||||||||||||||
| Number of Occurrences |
- | - | - | 31 (≥ 0.01) | - | - | ||||||||||||||||||||||||||||||||||||||||||||||||
|
Fun Facts!
|
||||||||||||||||||||||||||||||||||||||||||||||||||||||
|
Records: |
||||||||||||||||||||||||||||||||||||||||||||||||||||||


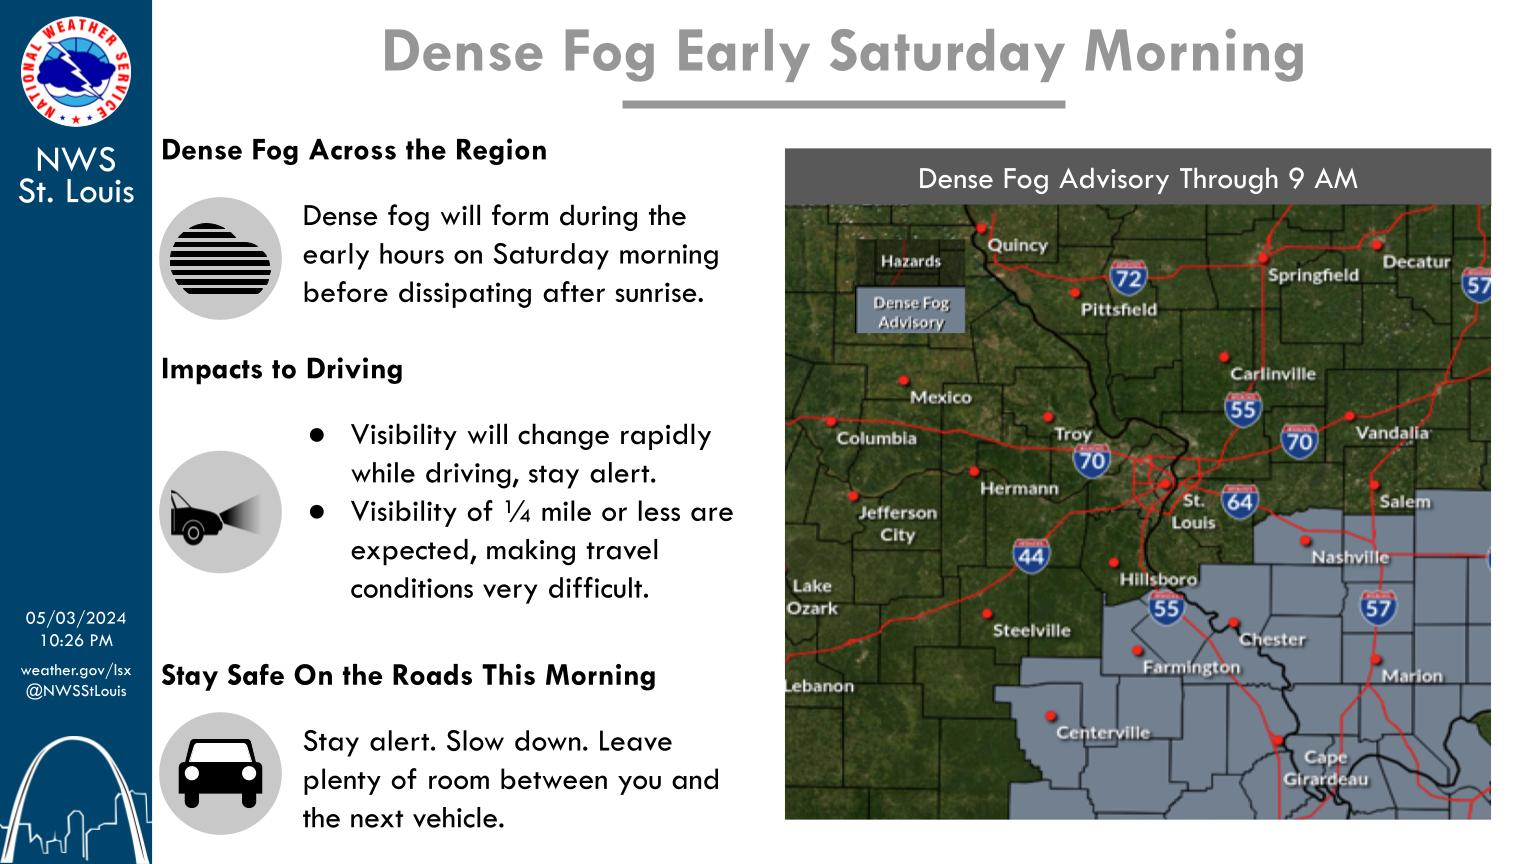 Weather Story
 Weather Map
 Local Radar