|
Group 1 Cases:
Low-level boundary intersecting the northern part of the larger convective line (Intensifying stage - or early stages of bow echo evolution)
(Updated info - December 2009)
|
|
(1) Thirteen of the forty-three cases
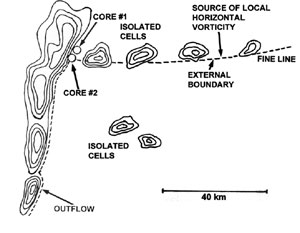
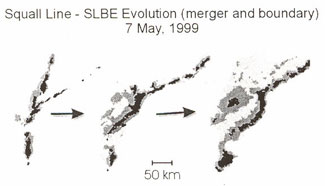
studied supported this type of storm conceptual model - reflectivity pattern shown below. Early documentation of storm mergers to nearly a solid line echo was shown by Rasmussen and Rutledge (1993). They described this stage as the "Internsifying Stage." We often observed the MARC velocity signature during this stage in the storm evolution (See the MARC website for more details). Our interest keys on the nearly solid line echo to early bowing. During this phase we have recorded the initial growth and early stages of tornadic and non-tornadic mesovortices along and downshear (east) of the heavier precipitation convective line. In some of our cases, witnesses have observed the tornado just downshear of the main reflectivity convective line or sometimes partially wrapped in the rainfall. Often to the northeast of our developing solid convective line, a narrow line of weak to strong isolated storms may be anchored along a surface boundary generated by a storm system downshear (east or northeast) and extend to the northern part of the linear convective line. One or two mesovortices during this phase may form in the vincinty of the intersection. Through recent numerical simulation work by Atkins and St. Laurnet (2009) they have shown this surface boundary - convective line intersection. More on this issue below. The time evolution of the overall reflectivity pattern described above has also been shown by a graphic created by Klimowski 2000 - 20th Conf. on Severe Local Storms (See Fig. 1 (right side). The three stages that Brian highlights shows the a developing nearly solid line echo with isolated cells extending to the east-northeast. Note the "kink" in the reflectivity pattern from the northeast band of broken cells to the northern part of the solid early bowing of the convective line (middle graphic). Some of our cases in this category collected showed similar reflectivity characteristics to Brian's squall line - bow echo (SLBE) evolution shown below. |
|
|
|
|
Fig 1 - Conceptual Model for Group 1 cases during the 'Intensifying Stage" of QLCS evolution across Mid-Mississippi Valley region (left); and Klimowski's conceptual model for Squall Line - Bow Echo (SLBE) (merger and boundary) (right side). Klimowski et al. 2000
|
|
- Nine cases occurred in the late afternoon or evening hours.
- Four cases occurred during the early to mid morning.
|
|
 From Atkins et al. 2006 From Atkins et al. 2006
|
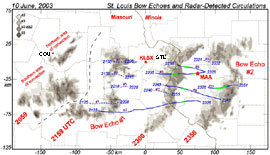
| Fig. 2: Radar reflectivity data from KLSX radar at 2059, 2159, 2300 and 2356 UTC 10 June 2003. Solid and thick-dashed lines represent the locations of radar-detected tornadic and non-tornadic mesovortices, respectively. Start and end times (UTC) for all mesovortices are also shown. Thick solid lines along the tornadic mesovortex path represent the location of observed tornadic damage. Thin-dashed lines are county boundaries. The long-dashed line separates the 2059 and 2159 UTC radar data. (From Atkins et al. 2005). MWR (Click on image for a larger image). |
|
a) Reflectivity and Doppler velocity characteristics
A bow echo system moved across parts from eastern Missouri through south-central Illinois during the late afternoon of 10 June 2003. This convective system occurred during the Bowecho and MCV experiment (BAMEX) covering much of the middle United States. The 10 June 2003 St. Louis Bow Echo shown above (Fig.2) by Atkins et al. (2005) revealed a four stage evolution of the bow echo system. The early stages shows two clusters of thunderstorms over central Missouri at 2059. One cluster of storms were located southeast of the Columbia Missouri Airport (COU) while the second cluster was south of Jefferson City Missouri (JEF). Around 2159 (UTC) (all times UTC). isolated cells form along a surface convergence boundary between the northern cluster and a developing bow echo to the south.. These cells rapidly merged, intensifying the system cold pool and formed to a nearly linear convective line at 2300. A few weak intensity mesovortices formed with the northern cluster at 2159 while one non-tornadic and one-tornadic mesovortex formed with the developing bow echo to the south (Bow Echo #1).
Between 2230 and 2300 we observe the formation of a nearly solid convective line echo (Intensifying Stage). Two small bowing segments have formed within the larger convective line. A strong low-level reflectivity gradients extended along the leadirng edge of the line indicating a strong updraft-downdraft interface. Aloft, the beginning's of the mesoscale Rear Inflow Jet (RIJ) was revealed by SRM Doppler velocity data from near the back edge of the convective line and developed rearward with time (not shown).
Between 2235 and 2245, the first three of five mesovortices (MV 6, 7, and 8) formed along the QLCS during this period
from southern St. Louis County and south into Jefferson County Missouri. Two of the three MVs spawned tornadoes over far western part of St. Clair County Illinois (MV 6 - 7 km just south of downtown St. Louis and the second near the Monroe - St. Clair County line). A fourth strong mesovortex formed at 2256 just east of downtown St. Louis, spawned a tornado (high end EF1) near Caseyville Illinois (approx 9 km east of downtown STL). This tornadic vortex was located in the vicinity of a reflectivity inflection point over at the northern part of one of the two smaller bowing segment and a solid convective line extending to the northeast. Based on witnesses descriptions, the tornado associated with MV 9 was partially rain wrapped. The mesovortices appeared to form just behind the surface gust front in a they traveled from St. Louis and Jefferson Counties into St. Clair county IL. (All of this was occurring during peak rush hour in the downtown St. Louis area). MV 6 formed just north of the apex of the small northern bowing segment within the larger line and spawned two tornadoes. MV 9 formed formed near the reflectivity inflection point over the northern part of St. Louis City and spawned a tornado (high-end EF 1) near and west of Caseyville Illinois. Ray Wolf (SOO WFO DVN) and our group have documented non-supercell tornadoes to occurr near these reflectivity inflection points or where a surface boundary intersects the northern part of the convective line.
Recently, Atkins and St. Laurent (2009) have shown a different tornado-genesis mechanism in constrast to work completed by Trapp and Weisman (2003) in mesovortex formation. They showed that the northerm members individually as well as a northern member associated with couplets were cyclonic while the southern member was anticyclonic. Simulations completed by Trapp and Weisman (2003) showed a reverse pattern with couplet pairs in which the southern member was cyclonic and the northern member was anti-cyclonic.
|
|
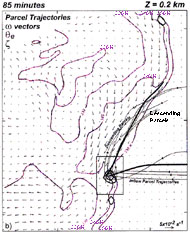 From Atkins and St. Laurent 2009 From Atkins and St. Laurent 2009
|
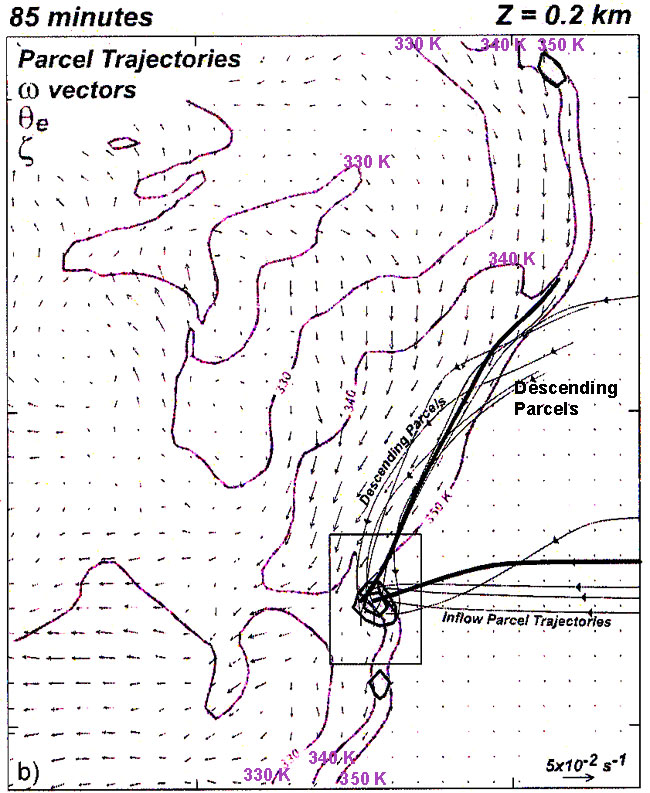
| Fig. 3. Analysis of mesovortex genesis during the cellular - early bowing phases (90 minutes) into the simulation performed by Atkins and St. Laurent (2009). Air parcel trajectories projected at 0.2 km are shown in solid black lines. The vector field is hortizontal vorticity. (Click on image for a larger image). |
During the later part of 2008 and early 2009, Atkins and St. Laurent completed a number of simulations focusing on the mesovortex-genesis associated with convective line from the cellular to early bowing stages of a bow echo. Figure 3 revealed a cyclonic vortex from the cellular stage evolving into the early bowing stages. The convective cell shown above is loacted over the southern part of the developing convective line. The mesovortex was embedded in updraft air along the gust front. The early stages of a low-level mesovortex (cell to early bowing) is located along the gradient of theta-e. Air feeding into a mesovortex was coming from both high theta-e inflow from the east and north northeast and lower theta-e air behind the gust front. To further support this claim backward parcel trajectories were computed for populating the mesovortex at 85 minutes into the simulation. Many of the parcels were coming from the north-northeast just behind the gust front and some were coming from the east. The descending parcels from the north acquired positive streamwise vorticity before they entered the mesovortex. Positive tilting of hortizontal streamwise vorticity generated weak positive vertical vorticity. The weak positive vertical vorticity was then amplified through vortex stretching by the updraft along the gust front after 83 minutes into the simulation. Their simulation output showed that inflow parcels from the east encountered tilting at 77 minutes into the simulation. These parcels also contained positive streamwise horizontal vorticity. However their magnitudes were much smaller than the descending parcels. Positive tilting of the inflow parcels after 77 minutes into the simulation produced positive vertical vorticity that was amplified through vortex stretching after 79 minutes. The smaller magnitudes of the horizontal vorticity field within the inflow region compared to the descending parcels moving along and just behind the gust front revealed that descending low theta-e parcels from the north appeared to be more important in generating the low-level mesovortex through titiing of horizontal streawise vorticity. This more details on this part of the simulation is shown from (Atkins and St. Laurent 2009 MWR).
Webpage Under Construction.
In eleven of the thirteen events, isolated to scattered convective cells appeared to be anchored to a surface boundary. The surface boundary may be , reflectivity fine line, or surface boundary generated by a downshear MCS or supercell is oriented orthogonal and intersects the northern part of the larger quasi-linear convective system. The area of isolated to scattered cells extending east or east-northeast signifies the probable location of the surface boundary. However, in two of the thirteen cases, there was no discernible radar reflectivity feature which suggested the presence of a surface boundary.
- Several cases showed the presence of strong low-level reflectivity gradients along the leading edge of the larger convective line indicating the location of the convective line's organized updraft-downdraft region.
In all twelve cases, the first reports of damaging winds occurred south of the surface boundary -convective line intersection (just preceding bowing of the larger convective line). The MARC velocity signature was identified in the "pre-bowing stage" in nine of the ten cases studied as much as 15 to 20 minutes in advance of early bowing. The MARC velocity signature was detected mainly south of the intersection where the overall convective line showed nearly linear characteristics. Highest MARC values were observed between the 3.5 and 5.0 km layer. This type of reflectivity pattern is similar to observations documented by Klimowski (2000), Przybylinski and DeCaire (1985) and Smith (1989).
Studies completed by Klimowski et al. 2000 showed that either a linear convective line or the early stages of bow echo evolution can form into two classifications, 1) Linear line to Squall Line Bow Echo (SLBE) or Bow Echo Complex (BEC). Twenty-six of the fourty-two cases fell into this category. In a number of cases across the northern and central High Plains, a surface boundary extended east or east-northeast from the convective line similar to what we observed in our Group 1 cases. Damaging winds occurred frequently along the bow south of the surface boundary. Sixteen of the forty-two cases evolved from a linear convective line to SQBE. In this group a surface boundary as absent. This type of evolution is similar to numeical simulation results shown by Weisman (1993).
Other Examples |
(a)
|
(b) 
|
|
Fig. 2 - (a) Planview reflectivity image (0.5° slice) at 2303 UTC 2 July 1992 from WFO LSX. (b) Planview
reflectivity image (0.5° slice) at 0402 UTC 25 May 2004. Check out 25 May 2004 case below under Case Studies. . (Click on image for a larger image).
Another example of bow echo - surface boundary intersections occurred outside the WFO LSX County Warning Area (CWA) over central Oklahoma on 5-6 September 1992. The surface boundary or outflow from the north intersected the northern part of a bow echo where there was a weak reflectivity notch. Stumpf and Burgess (1993) used dual-Doppler analysis to chart the tracks of four misocyclones (M1 through M4) from west of Norman through the Norman OK area (Fig. 4a). From Fujita (1981) a misoscale vortex would be classified of having a core diameter between 0.04 - near 4 km, while a mesovortex core diameter would be at or greater than 4 km. Recently Trapp and Atkins (2008) redefine the mesovortex as a vortex which ascends and grows upscale with time. This would include misovortices and mesovortices from Fujita's earlier definition. .
|
|
a.  b. b.
|
| Fig 3. (a) Radar map depicting dual Doppler analysis domain (25 x 25 km box) over central Oklahoma where Norman OK is located over the eastern part of the box. Cimarron (CIM) and Twin Lakes (KTLX) represents respective radar locations. The X's depicts the location of radar truthed misocyclones (M1, M2, M3, and M4). (b) Surface mesoscale analysis and KTLX reflectivity at 0541 UTC for the 0.5° slice. Shown are loactions of M1 and M3 (as large and small misocyclones respectively) and gust front boundaries. Reflectivity contours are 0, 15, 30, and 45 dBZ. (Courtesy of Don Burgess and Greg Stumpf - 1993). (Click on image for a larger image). |
|
Three of the four misocyclone tracks were associated with wind damage. Wind damage was associated with M1, while damage was not reported with M2. Both M3 and M4 traveled through the Norman OK area and produced individual swaths of damage. Figure 3b shows that M3 was located in the reflectivity notch and the intersection of a southward moving east-west surface boundary and the eastward moving gust front associated with the bow echo. The damage swath of M3 ended about 1 km east of OU Research Park while M4 continued to produce damage through the city of Norman to four miles east of Norman OK. Of the four misovortices, M4 did exhibit some rotational damage characteristics compared to the other three. A ground survey was conducted while no areal survey was completed with case. It is interesting to note that the misovortices in this case extended to a height of around 2.5 km. Recent studies have shown that moderate to strong mesovortices (Atkins et al 2004; Atkins et al. 2005; Przybylinski et al. 2000); Przybylinski et al. 2006) can extend to heights of 5 to 6 km if not greater at times.
b) Mesovortex Location and Characteristics
- In our study we found that QLCS tornadoes (F0 - F2 damage) were correlated with mesovortex cores 2 and 3 in one case, core 3 in a second case and mesovortex cores 2, 3 and 4 in two other cases. These mesovorticies formed at low-levels from just north of the apex of the bowing segment to the northern end of the bowing structure.
You may ask the question what is a mesovortex and how does it differ from mesocyclones in supercells. Mesovortices often form along the leading edge of a convective line at low-levels (0.5 - 2.0 km layer) mainly during the early stages of a bow echo where crosswise vortex lines are tilted upward by convective-scale downdrafts (Trapp or Weisman 2003 - Part 2). In supercells the origins of mesocyclones forms at mid-level beginnings. Numerical simulations shown by Trapp and Weisman revealed downward tilting of the vortex lines will result in a cyclonic member south of the region of downdraft air and a anticyclonic member north of the region of downdraft air. Nolan Atkins and I have studied Doppler velocity data at ranges within 100 km from a number of cases and was unable to find the anticyclonic member. Recent numerical simulations completed by Atkins and St. Laurent 2009, have shown that a region of a updraft along the leading edge of the linear to bowing convective line where vortex lines are tilted upward stretched. In Atkin's simulation parcels may originate from the east of the convective line or even north of a northeast-southwest surface boundary. In this case streamwise vorticity may play a role north of the surface boundary. The parcels along the boundary are never stretched. Atkin's numerical simulation shows parcels slightly descending towards the cyclonic vortex core which is on the cooler and north side of the region of updraft air. A weak anticyclonic member may show up on the southside of the region of updraft air.
- Moderate Shear ( 15 m s-1 and greater - within the 0-3 km layer) / high CAPE was present in all four cases.
- In the remaining 6 cases studied, two or three mesovortices were documented along the cyclonic shear side of the bow (from the apex northward). Similar to above, Core #3 formed as much as 5 to 10 minutes after the initial indentification of Core #2. Of these 6 cases tornadoes (EF0 - EF2) occurred in two cases. The tornadoes were correlated with mesovortex core #2 (northern end of the bowing structure) in one case and cores #2 and #3 in a second case. In the remaining four of the six cases there was an absence of any tornadic activity.
- In nearly all of the cases, mesovortex core 3, and subsequent mesovortex cores moved in the direction of the bow echo and did not merge with the larger northern line-end vortex. This is similar to results shown by Atkins et al. (Mon. Wea. Rev. Vol 132 2004).
In 9 out of 12 cases, the first and second mesovortices (Cores 1 and 2) formed in the vicinity of or just south of the surface boundary - convective line intersection. In 7 of the 10 events, isolated cells were in the vinicity of the surface boundary were present. In a number of these cases Cores 1 and 2 formed at or just south of the intersection just after merger between the isolated cells and larger convective line (preferred region of enhanced low-level convergence - vertical stretching of the updrafts). In two other cases, Cores 1 and 2 formed near the vicinity of a fineline - convective line intersection (no apparent cells mergers were noted). In the remaining case, the first and second core formed in the vicinity of a warm frontal boundary (no isolated cells or fine lines were documented).
- In 4 of the 10 cases studied, numerous convective-scale (gamma-scale) vortices (4 or more cores) were documented along the cyclonic shear side of the bow (from the apex northward). Core #3 and subsequent mesovortices formed as much as 5 to 15 minutes after the initial identification of Core #2. However, there in one case, a cyclonic mesovortex also formed south of the apex of the bow.
|
|
c) Mesovortex Trend Info
- Non- descending characteristics.
- Core #2 - over the northern part of the convective line (but southeast of Core #1) revealed significantly stronger Vr shears, greater depths, non-descending characteristics, and longer lifetimes compared to Core #1. This core rapid ascends with height while the strongest rotation remains at low-levels (lowest 2 - 3 km) within the first 20 to 25 minutes of the mesovorticies lifetime. The strength of the low-level rotation often intensifies during this period and Vr magnitudes may exceed 25 m s-1. The mesovortex may reach heights exceeding 8 km. Core #2's lifetime will often exceed 60 minutes (2 cases - 70 minutes). Tornadogenesis frequently occurs during just prior to the mesovortex reaching its greatest height while low-level rotation is strongest during this time.
- Core #3 and subsequent cores - (near or north of the apex - along the cyclonic shear side of the bow) also revealed mainly 'non-descending characterisitcs' and displayed similar Vr magnitudes and nearly equal depths to mesovortex core #2. However, many of these mesovortex cores revealed shorter lifespans compared to Core #2. In two cases, where mesovortex cores #3 and #4 were tornadic, the location of these circulations appeared to be similar to the location of mesovortices shown in numerical simulations by Trapp and Weisman (2000) (QLCS tornadoes).
- Our studies showed that strong mid-level rotation found in supercells was absent during t he early stages of mesovortex cores #2, #3, and #4. In many cases, the strongest rotation was found within the lowest 2 - 3 km during the later part of the organizing stage and into the mature stage of the circulation's lifespan.
- In some cases, our investigations also showed that once Core #2 evolved into the Mature Stage (MS) of mesovortex evolution, the circulation appeared to enhance the flow , around the southern periphery of the vortex, resulting in line acceleration and potential enhanced wind damage just south and southeast of Core #2's track. Similar observations were shown in mesovortex cores #3 and #4.
- In two of the four cases documented when numerous cores were present, tornadoes (F0 - F2) occurred during the very early stages of mesovortex evolution (mainly with Cores 3 and 4), and during the later part of the mesovortex core's Organizing Stage (OS) (just preceding the core's greatest depth Cores #2, 3 and 4)). In the other two cases tornadoes (F0 - F1) occurred during the later part of the Organizing Stage (OS) and or early part of the Mature Stage (MS). Core #1 - northern most vortex generally showed weaker magnitudes of Rotational Velocities (Vr) and shallow depths compared to Core #2 which was located east or southeast of the first core. Core #1 often showed
|
|
Case Examples (click on dates for summary of case):
2 July 1992 Bow Echo
29 June 1998 Derecho
29 June 1998 Line-end Vortex Evolution
24 May 2004 QLCS (WES case)
|
|
Case #
|
1
|
2
|
3
|
4
|
5
|
6
|
7/BE1
|
7/BE2
|
8
|
9
|
10
|
|
|
Y
|
Y
|
Y
|
Y
|
|
Y
|
|
|
|
Y
|
|
|
Shear
0-5 km
|
19
m/s
|
11
|
17
|
13
|
19
|
15
|
11
|
|
19
|
20
|
21
|
|
Shear
0-3 km
|
18
m/s
|
09
|
13
|
06
|
13
|
14
|
07
|
|
15
|
17
|
17
|
|
ML
CAPE
|
4500
J/Kg
|
3600
|
3500
|
3750
|
4500
|
3400
|
4300
|
|
3300
|
2675
|
3400
|
|
Circ #1
|
D
|
ND
|
D
|
D
|
D
|
D
|
D
|
D
|
D
|
D
|
D
|
|
|
ND/
T
|
D
|
ND
|
ND
|
ND
|
ND/
T
|
ND
|
ND
|
ND/
T
|
ND/
T
|
ND/
T
|
|
Circ #3
|
ND/
T
|
|
ND
|
D
|
ND/
T
|
|
|
ND
|
|
ND/
T
|
D/T
|
|
Circ #4
|
D
|
|
|
|
D
|
ND/
T
|
|
|
|
|
|
|
|
Table 1 - Group 1 QLCS events
|
|
Comparison of mesovortex characteristics for 10 QLCS cases (Group 1 events). D signifies descending mesovortex, ND represents Non-descending mesovortex, and T = Tornado occurrence.
|
|
Table 1 shows that all of the tornadic bow echo cases occurred in moderate to strong shear environments with ML CAPE values generally exceeding 3000 J/Kg. Case #9 is an event which occurred in April while all of the other cases occurred from the later part of May through August. Case #3 is the only case where tornadoes were absent in the presence of moderate shear and high CAPE values.
|
d) Comparisons between supercell and QLCS mesovortices
Comparisons between the characteristics of mesocyclones associated with traditional / mini- supercells (Burgess et al. 1982; Burgess et al. 1995) and mesovortices with convective lines were completed. From studies completed in the 1970s Burgess and others has shown that mesocyclone evolution associated with supercells (traditional and mini-supercells) can be divided into three stages:
Organizing Stage (OS)
Mature Stage (MS)
Dissipating Stage (DS)
In our study, we compared at this time the OS and MS of 1st and 2nd core mesovortices associated with bow echoes in Group 1 events to Burgess's data set. Mesovortices in our data set were sampled within 150 km of the WSR-88D. Mesocyclones for min-supercells were sampled within 98 km of the radar.
|
|
|
|
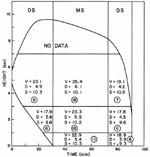
Fig 3 -Traditional supercell mesocyclone characteristics averaged for height and stage of evolution: a) Organizing Stage (OS); b) Mature Stage (MS); and c) Dissipating Stage (DS). Characteristics of rotational velocities (V) in m s-1, core diameter (D) in km and shear (S) in 10-3 s-1 units.Circled values are number of cases used in each average (from Burgess et al. 1982).(Click on image for a larger image)
|
|
Tables similar to Burgess's et al. (1995) study, were constructed. Comparisons between the two data sets were completed and are shown below.
|
|
Organizing Stage
|
|
|
Organizing Stage
|
OS Vr (m/s)
|
OS Dia (km)
|
Tornadoes
(Yes/No)
|
|
1st Core
|
16.0
|
4.8
|
No
|
|
2nd Core
|
17.4
|
5.5
|
Yes (5/10 cases)
(6) F0/F1
|
|
|
Table 2 - Above - Characteristics of 1st and 2nd core mesovortices (10 cases) associated with Group 1 QLCS events. Vr represents the magitude of Rotational Velocities.
|
|
Organzing Stage
|
OS Vr (m/s)
|
OS Dia (km)
|
|
Mini Supercell
|
13
|
3.9
|
|
Traditional
|
20
|
5.4
|
|
|
Table 3 - above - Results from Burgess's study (Including Traditional / Mini Supercells) (Burgess et al. 1995).
|
Mature Stage |
|
Mature
Stage
|
MS (Vr) m/s (L)
|
MS Dia (km) L
|
MS (Vr) (m/s)
|
MS Dia (km)
|
Circ Depth (km)
|
Circ Lifespan
|
Tornadoes
|
|
1st Core
|
17
|
7.75
|
17.4
|
7.1
|
5.3
|
22.2
|
0
|
|
2nd Core
|
18.4
|
7.8
|
18.0
|
8.3
|
7.9
|
55
|
4(F0) /3 (F1) /1 (F2)
|
|
|
Table 4 -Characteristics of 1st and 2nd core mesovortices (10 cases) associated with Group 1 QLCS events. (MS Low (L) - represent 0.5° slice). L represents 0.5° slice.
|
|
Mature Stage
|
MS (Vr) (m/s ) L
|
MS Dia (km) L
|
MS (Vr) m/s
|
MS Dia (km)
|
Circ Depth (km)
|
|
Mini
|
15
|
3.5
|
17
|
3.7
|
4.5
|
|
Traditional
|
23.0
|
5.4
|
25.0
|
6.0
|
9.2
|
|
|
Table 5 - Results from Burgess's et al study (Including Traditional / Mini Supercells).
(Burgess et al. 1995)
|
|
e) Preliminary Findings
a. When comparing Group 1 - 1st and 2nd core mesovortices during the OS, the 2nd cores revealed stronger rotational velocities (Vr) at low-levels and throughout the depth of the vortex (see Table 2a). Second core circulations exhibited slightly larger diameters compared to first core diameters.
b. In comparing 2nd core Vr magnitudes during the OS between our data set and Burgess's results, 2nd core circulations with convective lines exhibited overall weaker Vr values compared to Vr magnitudes associated with traditional supercells. 2nd core diameters associated with convective lines were slightly larger compared to traditional supercell core diameters. Remember the strongest rotation associated with 2nd core mesovortices with convective lines nearly remains below 3 km and the vortex deepens with time. Tornadogenesis often occurrs just prior to the time of greatest vortex depth and strongest rotation at low-levels.
c. When comparing Group 1 - 1st and 2nd core mesovortices during the Mature Stage (MS), 2nd core circulations revealed stronger Vr (at low-levels and overall depth) compared to 1st cores. This is why tornadogenesis would have a higher probability of occurrence with second and successive cores compared to 1st core circulations. During the early part of the MS, 1st and 2nd core diameters were quite similar. However, in many cases, 2nd core mesovortices often grew upscale and obtained larger diameters compared to their first core counterparts.
d. When comparing 2nd core mesovortices associated with convective lines to traditional supercell mesocyclones, 2nd cores Vrs were weaker at low-levels and overall depth. Additionally, convective line 2nd core diameters were larger compared to traditional supercell mesocyclone core diameters.
e. When comparing overall core depth, traditional supercell cores exhibited slightly higher depths compared to convective line 2nd core mesovortices.
|
Return to QLCS Introduction |


 Weather Story
 Weather Map
 Local Radar