Through the first three weeks of July 2011, as of the morning of the 21st, only 0.45” of rain had been recorded at O’Hare Airport. Had July ended with no additional rainfall, this would have been the third driest July in about 140 years of record keeping at Chicago.
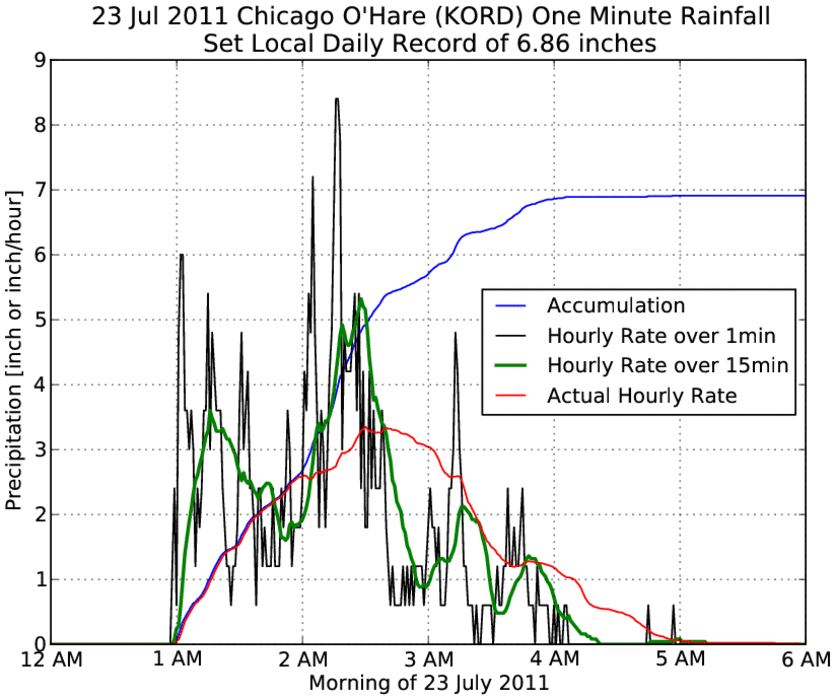
A brief summary of facts regarding the record rainfall measured on Saturday, July 23:
A Wet...Wet...Wet July
Despite a dry start to the month, July 2011 has moved into the record books as the wettest July on record and one of the wettest months ever on record for Chicago. For Chicago, July 2011 was the 7th all-time wettest month on record.
The so-called “Ring of Fire” pattern (figure 1), which was responsible for the heat and rain, occurs when an extension of the Bermuda High, a semi-permanent region of high pressure over the Atlantic Ocean, becomes anchored across the southern or southeastern United States.
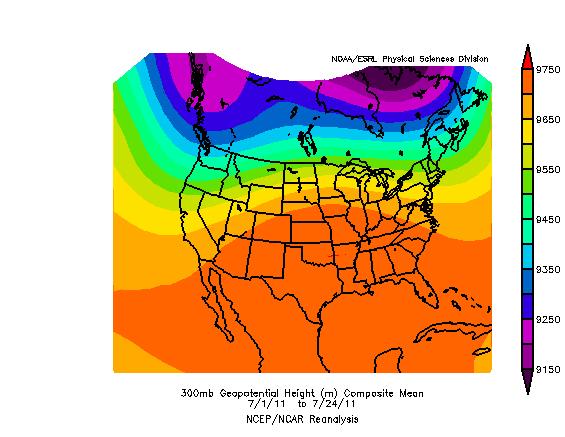
Figure 1: 300mb Geopotential Height Composite for July 1st to July 24th 2011 showing upper level high anchored across the southern United States.
This high pressure is also reflected at the surface (Figure 2) across the southeastern United States with a quasi-stationary frontal boundary lingering along the northern periphery of the high. While areas south of this frontal boundary baked under intense heat, moisture from the Gulf of America wrapped around the high, pooling along the frontal boundary, setting the stage for periods of record setting rainfall. July 22nd and 23rd alone saw 8.41 inches of rainfall in Chicago, which includes a single day record for July 24th of 6.86 inches.

Figure 2: Composite Mean Sea Level Pressure (MSLP) for July 1st to July 24th 2011 showing a ridge of high pressure extending from the Southwestern United States.
As the quasi-stationary frontal boundary pushed up against the ridge of high pressure and was held up, it took on a west to east orientation. Steering winds become aligned parallel to the front, meaning that thunderstorms that develop on the boundary then move east (slowly at times due to the weak winds aloft) along the boundary. The sounding from Davenport, IA during the evening of July 23rd in figure 3 shows this setup. Notice the weak winds in the column, only about 50kts at 200mb. The steering winds, which can be approximated by the 850-300mb mean wind, were nearly westerly, parallel to the frontal boundary as analyzed in Figure 5. Also notice the very high precipitable water values of nearly 52mm, or just over 2 inches, indicative of the high amount of moisture in the atmosphere.

Figure 3: 00Z Sounding from July 24th at Davenport, IA.
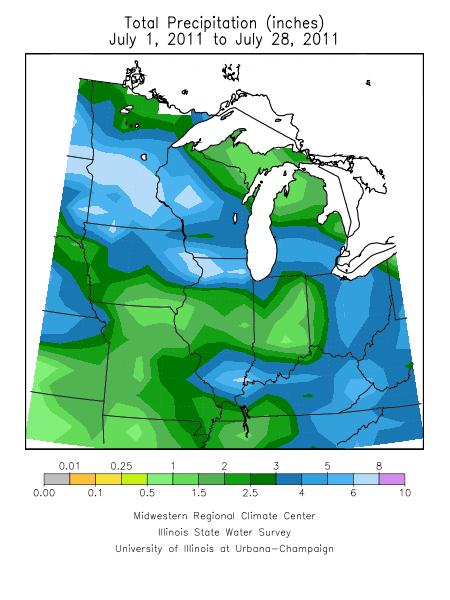
Figure 4: Rainfall totals from July 1st to July 28th 2011 (From Midwest Regional Climate Center)

Figure 5: 00Z Surface Analysis from July 24th.

