Overview
Several rounds of showers and thunderstorms affected the area on June 21st and June 22nd. The greatest impact was locally heavy rainfall with a few locations seeing in excess of 4 inches of rain for the 2 day period. The heaviest rainfall amounts were across portions of Berrien County where Stevensville reported storm total amounts in excess of 5 inches. In addition, a weak tornado occurred just south southeast of Van Wert, OH on the evening of June 22nd.Tornadoes:
|
Tornado - 5 miles SSE of Van Wert, OH
Track Map  
Downloadable KMZ File |
||||||||||||||||
The Enhanced Fujita (EF) Scale classifies tornadoes into the following categories:
| EF0 Weak 65-85 mph |
EF1 Moderate 86-110 mph |
EF2 Significant 111-135 mph |
EF3 Severe 136-165 mph |
EF4 Extreme 166-200 mph |
EF5 Catastrophic 200+ mph |
 |
|||||
Flooding
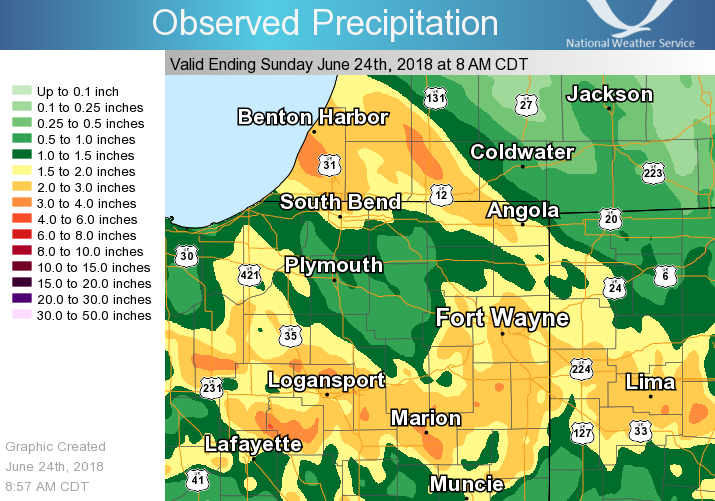
Multi-day rainfall amounts across the area ranged anywhere from around 1 inch to locally 5 inches. A few sites experienced minor river flooding including at Decatur, IN. Localized flooding occurred due to slow storm movements, and a few instances of cells training over the same locations.
Rainfall/River Response
 |
 |
 |
| Radar estimated rainfall from evening of June 21st to evening of June 222nd |
3 day Rainfall Totals
|
Heavy rainfall resulted in sharp river rises at Decatur, IN and minor flooding |
Photos & Video:
This section will be updated soon.
 |
 |
 |
 |
| Many crops were knocked over as a result of the winds from the tornado in Van Wert. (Courtesy: Van Wert EM RIck McCoy) |
Sometimes it's easier to see the extent of the damage and get a better idea of the cause from a drone above. You can see the turning of the winds better in this image than the one to the immediate left. (Coutesy: Van Wert EM Rick McCoy) |
A majority of the damage from this tornado was in a crop field, but it did eventually reach a small forested area and knocked over these trees. (Courtesy: Van Wert EM Rick McCoy) |
This photo comes from Brock A Profit via Twitter. |
Storm Reports
PRELIMINARY LOCAL STORM REPORT...SUMMARY
NATIONAL WEATHER SERVICE NORTHERN INDIANA
1028 AM EDT SUN JUN 24 2018

..TIME...   ...EVENT...      ...CITY LOCATION...     ...LAT.LON...
..DATE...   ....MAG....      ..COUNTY LOCATION..ST.. ...SOURCE....
            ..REMARKS..

1154 PM     HEAVY RAIN       BENTON HARBOR           42.12N 86.45W
06/22/2018  M4.00 INCH       BERRIEN            MI   TRAINED SPOTTER

            TRAINED SPOTTER REPORTS 4 INCHES OF RAIN IN
            48 HOURS; 1.1 INCHES OF RAIN IN THE LAST 24
            HOURS.

0700 PM     HEAVY RAIN       2 SE BLUFFTON           40.72N 85.15W
06/22/2018  M2.03 INCH       WELLS              IN   PUBLIC

            TODAY'S STORM TOTAL. FLOODED ROADWAYS.

0651 PM     TORNADO          2 NW JONESTOWN          40.80N 84.55W
06/22/2018                   VAN WERT           OH   EMERGENCY MNGR

            EF-0 TORNADO OCCURRED NEAR INTERSECTION OF
            WREN-LANDECK/MENDON ROADS. WINDS ESTIMATED
            55-60 MPH, PATH LENGTH 1 MILE, PATH WIDTH
            180 YARDS.

0605 PM     FLASH FLOOD      BLUFFTON                40.75N 85.17W
06/22/2018                   WELLS              IN   TRAINED SPOTTER

            REPORTS OF 6-8" WATER FLOWING ACROSS ROADS
            IN DOWNTOWN BLUFFTON. CARS STRANDED ON WILEY
            RD. MAN HOLE COVERS LIFTED OFF OF CITY
            STREETS. STATE ROAD 1 IN BLUFFTON IS BEING
            CLOSED NEAR HOSPITAL DUE TO HIGH WATER.

0500 PM     HEAVY RAIN       GEORGETOWN              41.73N 86.23W
06/22/2018  M3.40 INCH       ST. JOSEPH         IN   PUBLIC

            STORM TOTAL RAINFALL OVER PAST 2 DAYS.

0232 PM     FLOOD            4 SSW FLINT             41.64N 85.15W
06/22/2018                   STEUBEN            IN   TRAINED SPOTTER

            WATER COVERING SEVERAL COUNTY ROADS WEST OF
            ANGOLA.

0100 PM     FLOOD            3 W SILVER LAKE         41.64N 85.12W
06/22/2018                   STEUBEN            IN   TRAINED SPOTTER

            WATER COVERING ROADS ON COUNTY ROAD 250S
            BETWEEN COUNTY ROADS 700W AND 800W.

0915 AM     HEAVY RAIN       2 N WOODBURN            41.16N 84.85W
06/22/2018  M2.25 INCH       ALLEN              IN   TRAINED SPOTTER

            RAINFALL SINCE LATE YESTERDAY AFTERNOON.

1051 PM     HEAVY RAIN       1 NNE STEVENSVILLE      42.03N 86.52W
06/21/2018  M3.70 INCH       BERRIEN            MI   TRAINED SPOTTER

            STORM TOTAL SINCE 9AM.

1011 PM     HEAVY RAIN       GEORGETOWN              41.73N 86.23W
06/21/2018  M1.90 INCH       ST. JOSEPH         IN   PUBLIC

            STORM TOTAL SINCE 11AM.

0800 PM     FLOOD            WALLEN                  41.17N 85.17W
06/21/2018                   ALLEN              IN   FIRE DEPT/RESCUE

            ROADWAY FLOODED WITH APPROX 3" OF WATER.

0733 PM     FLOOD            1 W WALLEN              41.16N 85.19W
06/21/2018                   ALLEN              IN   PUBLIC

            WATER OVER ROADWAY.

0725 PM     FLOOD            BERTRAND                41.77N 86.25W
06/21/2018                   BERRIEN            MI   BROADCAST MEDIA

            HIGH WATER ABOUT 8" DEEP ON ROAD.

0715 PM     FLOOD            2 E INDIAN VILLAGE      41.71N 86.19W
06/21/2018                   ST. JOSEPH         IN   BROADCAST MEDIA

            PARKING LOT FLOODED. FEW INCHES DEEP OF
            WATER.

0657 PM     FLOOD            3 NW FORT WAYNE         41.10N 85.19W
06/21/2018                   ALLEN              IN   BROADCAST MEDIA

            FLOODING OVER ROAD.

0629 PM     FLOOD            3 E STEVENSVILLE        42.01N 86.48W
06/21/2018                   BERRIEN            MI   PUBLIC

            WATER OVER THE ROAD.

0611 PM     FLOOD            1 SE INDIAN VILLAGE     41.71N 86.22W
06/21/2018                   ST. JOSEPH         IN   BROADCAST MEDIA

            WATER OVER ROADWAY.

0459 PM     FLOOD            3 WNW BERRIEN SPRINGS   41.97N 86.40W
06/21/2018                   BERRIEN            MI   BROADCAST MEDIA

            REPORT OF ROADWAY FLOODED OVER AS WELL AS
            OFFICE IN BUILDING FLOODED.


&&

$$
Environment
 |
 |
 |
| Figure 1, 5:00 PM EDT 22 June 2018: The surface map above shows a surface low with associated warm and cold front over east-central Indiana. Heavy rainfall fell near and along these surface features This warm front was also a key forcing mechanism for the tornado near Van Wert, OH. | Figure 2, 7:00 PM EDT 22 June 2018: The green lines on this image show the heights of the LCL (Lifting Condensation Level). The LCL is an estimate of cloud base height. Over northern Indiana and northwest Ohio, the LCLs are near 500 meters (~1,600 feet). This is rather low. Low LCLs are favorable for tornadic development. | Figure 3, 7:00 PM EDT 22 June 2018: The red lines on this map show the amount of CAPE (Convective Available Potential Energy) that was available. An area of 1,000 j/k was available along and south of the surface warm front. This modest value was enough to support some thunderstorms. |
 |
 |
|
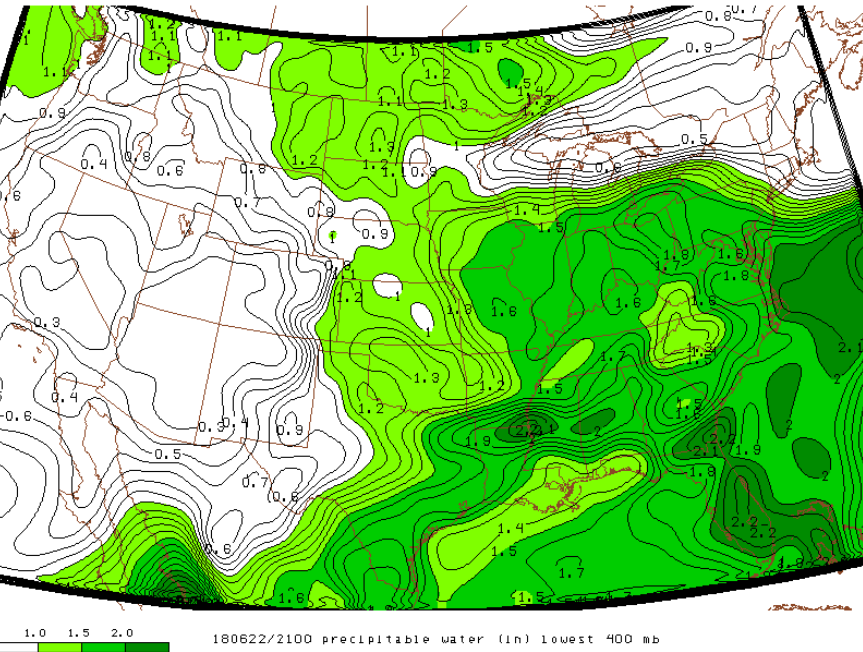
| Figure 4, 7:00 PM EDT 22 June 2018: In northwest Ohio, there was about 10-15 knots (12-17 mph) of wind shear in the lowest 1 km of the atmosphere. In this example, shear measures the difference between the surface wind and the wind at 1-km above the ground. These values are modest as well, but were capable of producing a tornado. | Figure 5, 5:00 PM EDT 22 June 2018: Precipitable water values over our area ranged from 1.5-1.1.7 inches. This measures the amount of available water within a column of the atmosphere. These values are above the normal ~1.0 inch for this date, which helped promote heavy rainfall. |
 |
Media use of NWS Web News Stories is encouraged! Please acknowledge the NWS as the source of any news information accessed from this site. |
|

