Overview
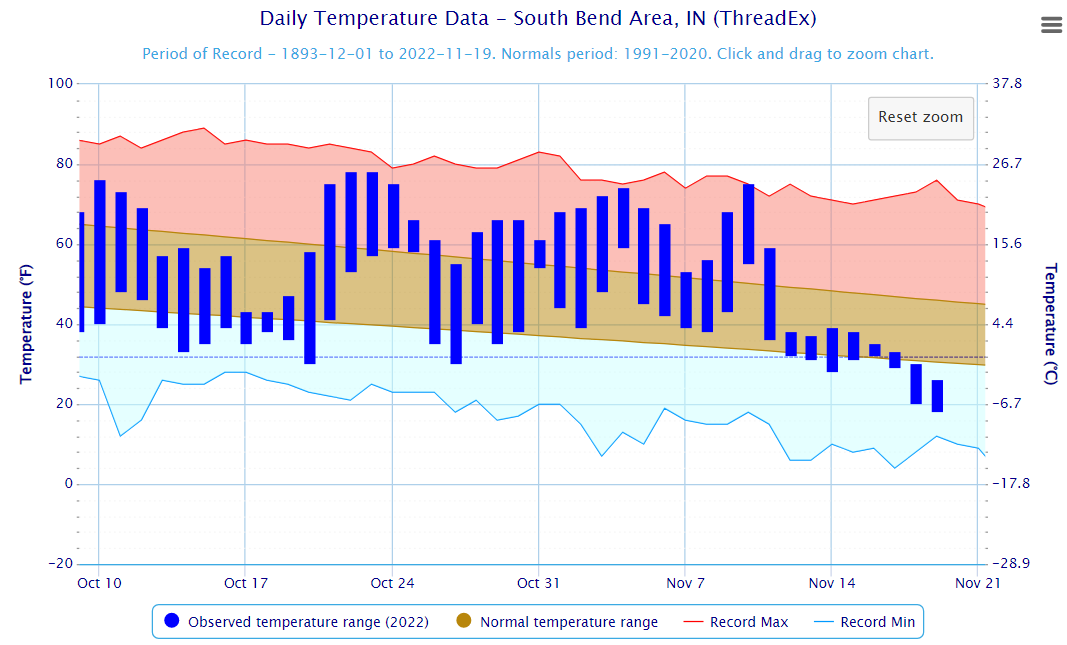
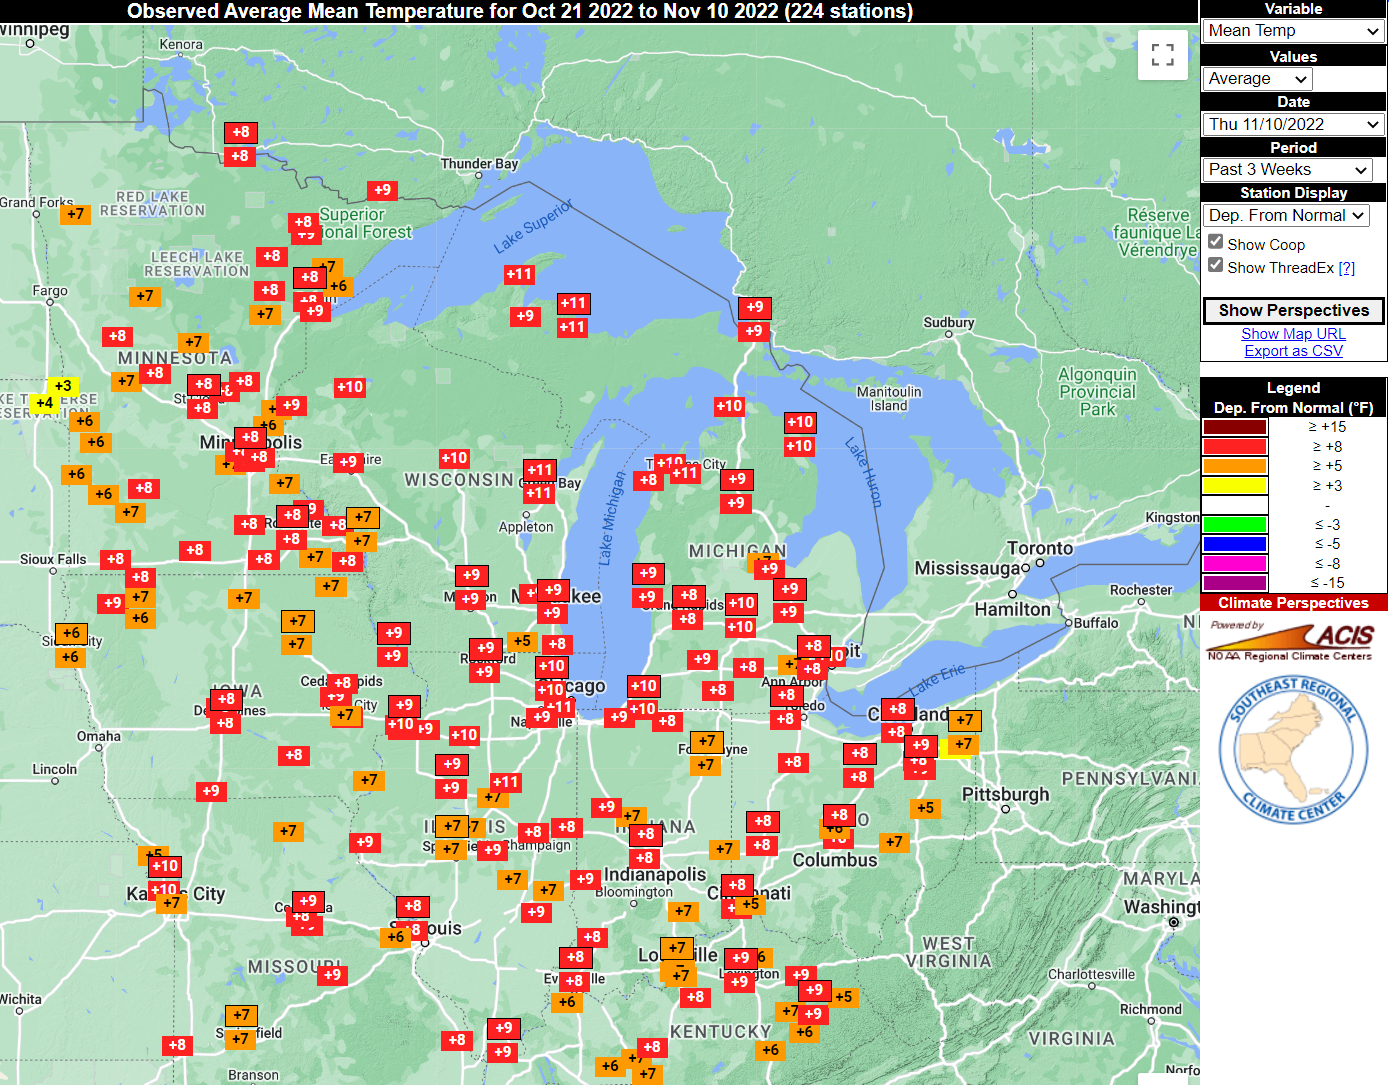
After observing a top-four warmest start to November, cold air came crashing in. Just over 30 inches of snow fell at South Bend, IN from the 12th through the 20th. Similar snow totals were observed in southwest Michigan.
Fast Facts:
A couple of records were set or tied at South Bend this month. Below are the records by date:
Snow
A strong cold front moved through on the night of November 10th. Light lake effect snow showers followed in its wake. However, as temperatures continued to plummet aloft, lake effect snow became well organized on the 12th and 13th. High pressure over southwest Indiana on the evening of the 13th provided a break in the snow. Another surface low moved through the Great Lakes region on the 15th and in its wake, Lake Effect snow resumed. In the days that followed, steady westerly wind (becoming northwest at times) continued to promote lake effect snow.

PUBLIC INFORMATION STATEMENT
NATIONAL WEATHER SERVICE NORTHERN INDIANA
1204 PM EST SUN NOV 20 2022

...SNOWALL REPORTS (TOTAL SNOWFALL) FROM NOV 15-NOV 20...

LOCATION                     AMOUNT    TIME/DATE       LAT/LON

...INDIANA...

...ALLEN COUNTY...
FORT WAYNE 4.1 NE            2.3 IN    0700 AM 11/20   41.12N/84.90W
FORT WAYNE 1.6 S             2.0 IN    0700 AM 11/20   41.05N/85.14N
WOODBURN 2.8 WSW             1.8 IN    0700 AM 11/20   41.12N/84.91W
FORT WAYNE INTL ARPT         1.6 IN    0700 AM 11/20   40.99N/85.18W

...ELKHART COUNTY...
WAKARUSA 3.0 WSW             9.6 IN    0700 AM 11/20   41.56N/85.88W
GOSHEN 1.2 SW                9.6 IN    0700 AM 11/20   41.57N/85.85W
ELKHART 2.4 NNE              2.9 IN    0700 AM 11/20   41.57N/85.99W

...GRANT COUNTY...
SHAMROCK LAKES 3 NNW         1.4 IN    0700 AM 11/20   40.45N/85.45W

...HUNTINGTON COUNTY...
HUNTINGTON 1.2 ENE           1.3 IN    0700 AM 11/20   40.89N/85.48W

...JAY COUNTY...
PORTLAND 5.4 SW              1.2 IN    0700 AM 11/20   40.39N/85.06W

...KOSCIUSKO COUNTY...
LEESBURG 6.7 ESE             2.3 IN    0700 AM 11/20   41.31N/85.72W
NWS NORTHERN INDIANA         2.1 IN    0700 AM 11/20   41.36N/85.70W
LEESBURG 0.1 WNW             1.8 IN    0700 AM 11/20   41.33N/85.85W
MILFORD 0.9 N                1.2 IN    0700 AM 11/20   41.42N/85.85W
WARSAW 3 SE                  1.0 IN    0700 AM 11/20   41.21N/85.80W

...LA PORTE COUNTY...
LA PORTE 1.6 SW              7.9 IN    0700 AM 11/20   41.59N/86.73W

...MARSHALL COUNTY...
PLYMOUTH 2.5 WSW             5.2 IN    0700 AM 11/20   41.33N/86.36W

...MIAMI COUNTY...
DENVER 1.3 NE                0.6 IN    0700 AM 11/20   40.88N/86.06W

...NOBLE COUNTY...
KENDALLVILLE 4.5 NW          2.5 IN    0700 AM 11/20   41.50N/85.31W

...ST. JOSEPH COUNTY...
SOUTH BEND INTL APRT         22.7 IN   0700 AM 11/20   41.71N/86.25W
MISHAWAKA 3.9 ENE            20.7 IN   0700 AM 11/20   41.68N/86.10W
GRANGER 1.8 ENE              16.4 IN   0700 AM 11/20   41.75N/86.11W
SOUTH BEND 3.3 SE             9.7 IN   0700 AM 11/20   41.63N/86.23W
SOUTH BEND 4.6 SE             3.6 IN   0700 AM 11/20   41.62N/86.23W

...STEUBEN COUNTY...
ANGOLA 4.5W                   2.9 IN   0700 AM 11/20   41.63N/85.09W
HUDSON 4.6 N                  2.8 IN   0700 AM 11/20   41.60N/85.09W
ANGOLA 2.5 N                  2.5 IN   0700 AM 11/20   41.70N/84.99W
HAMILTON 1.7 E                0.6 IN   0700 AM 11/20   41.53N/84.89W

...WHITLEY COUNTY...
COLUMBIA CITY 4.6 S           3.3 IN   0700 AM 11/20   41.09N/85.47W
COLUMBIA CITY 0.5 WSW         2.1 IN   0730 AM 11/20   41.16N/85.49W


...MICHIGAN...

...BERRIEN COUNTY...
NILES 2.7 W                  14.7 IN   0700 AM 11/20   41.84N/86.30W
BUCHANAN 1.4 ESE             11.0 IN   0700 AM 11/20   41.82N/86.34W
ST. JOSEPH 2.8 SSE            4.4 IN   0700 AM 11/20   42.06N/86.47W

...CASS COUNTY...
NILES 3.5 E                  17.0 IN   0700 AM 11/20   41.84N/86.18W

...HILLSDALE COUNTY...
HILLSDALE 2.5 ESE             1.7 IN   0700 AM 11/20   41.91N/84.59W

...ST. JOSEPH COUNTY...
THREE RIVERS 2.4 NE           8.5 IN   0700 AM 11/20   41.97N/85.60W

...OHIO...

...ALLEN COUNTY...
LIMA 2.7 NE                   1.2 IN   0700 AM 11/20   40.77N/84.08W

...HENRY COUNTY...
MCCLURE 3.4 SSE               1.2 IN   0700 AM 11/20   41.33N/83.91W
NAPOLEON 4.5 NNW              0.7 IN   0700 AM 11/20   41.46N/84.15W
NAPOLEON 0.6 WSW              0.4 IN   0700 AM 11/20   41.39N/84.14W

...PUTNAM COUNTY...
OTTAWA 1.0 N                  0.7 IN   0700 AM 11/20   41.04N/84.04W

OBSERVATIONS ARE COLLECTED FROM A VARIETY OF SOURCES WITH VARYING
EQUIPMENT AND EXPOSURES. WE THANK ALL VOLUNTEER WEATHER OBSERVERS
FOR THEIR DEDICATION. NOT ALL DATA LISTED ARE CONSIDERED OFFICIAL.
Photos & Video
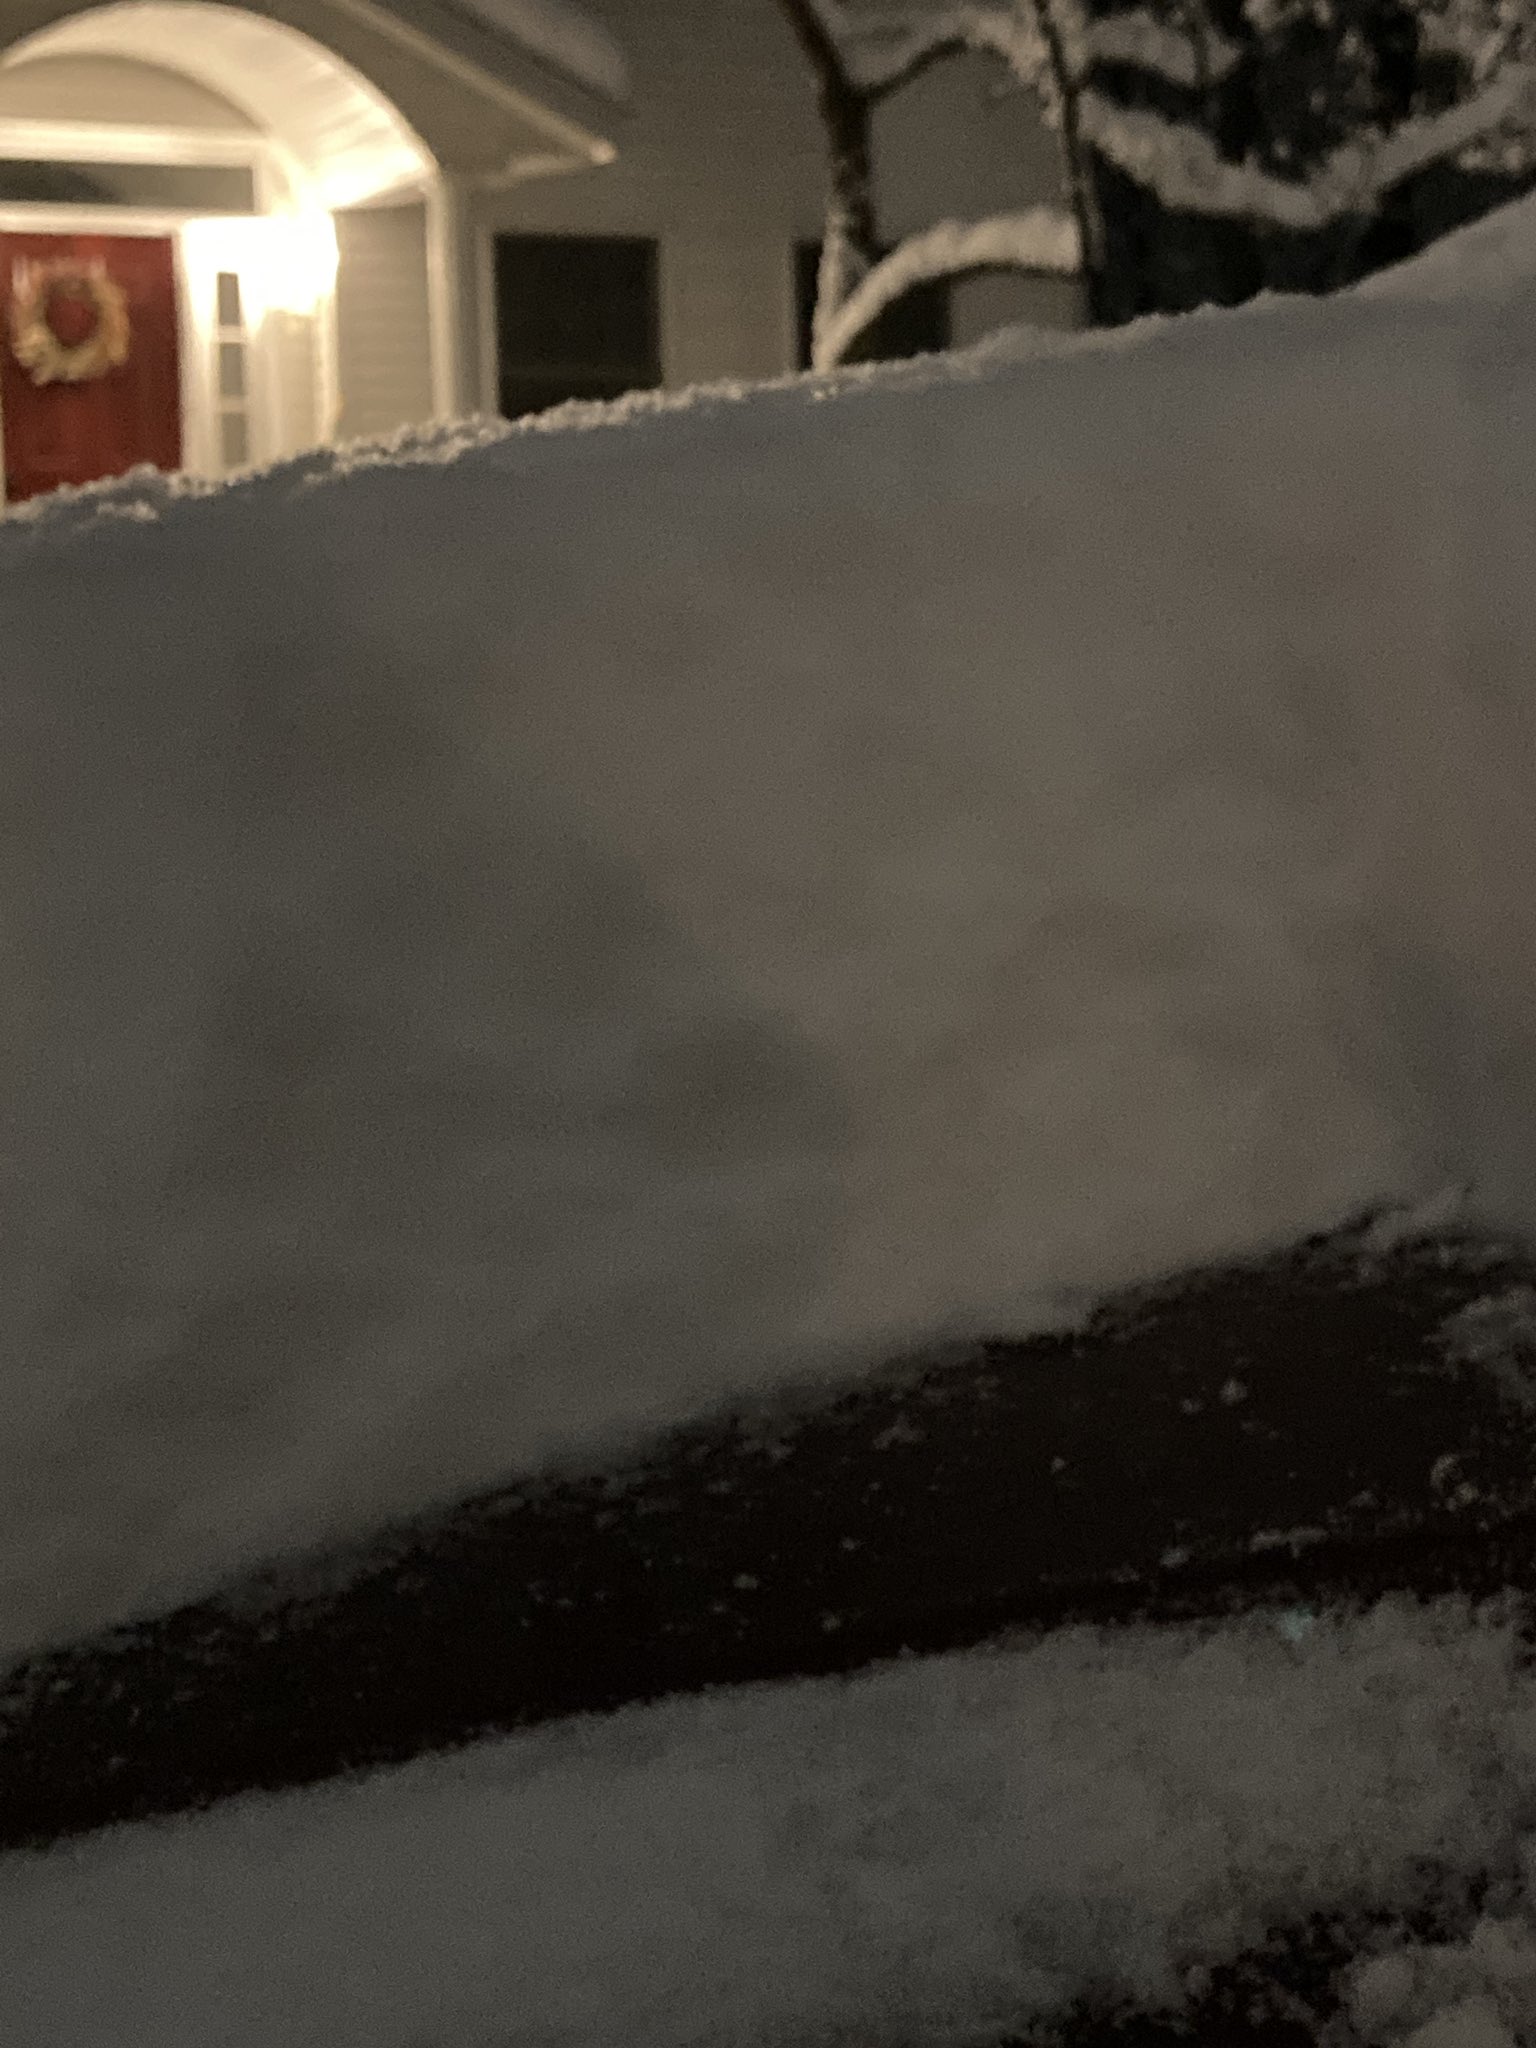 |
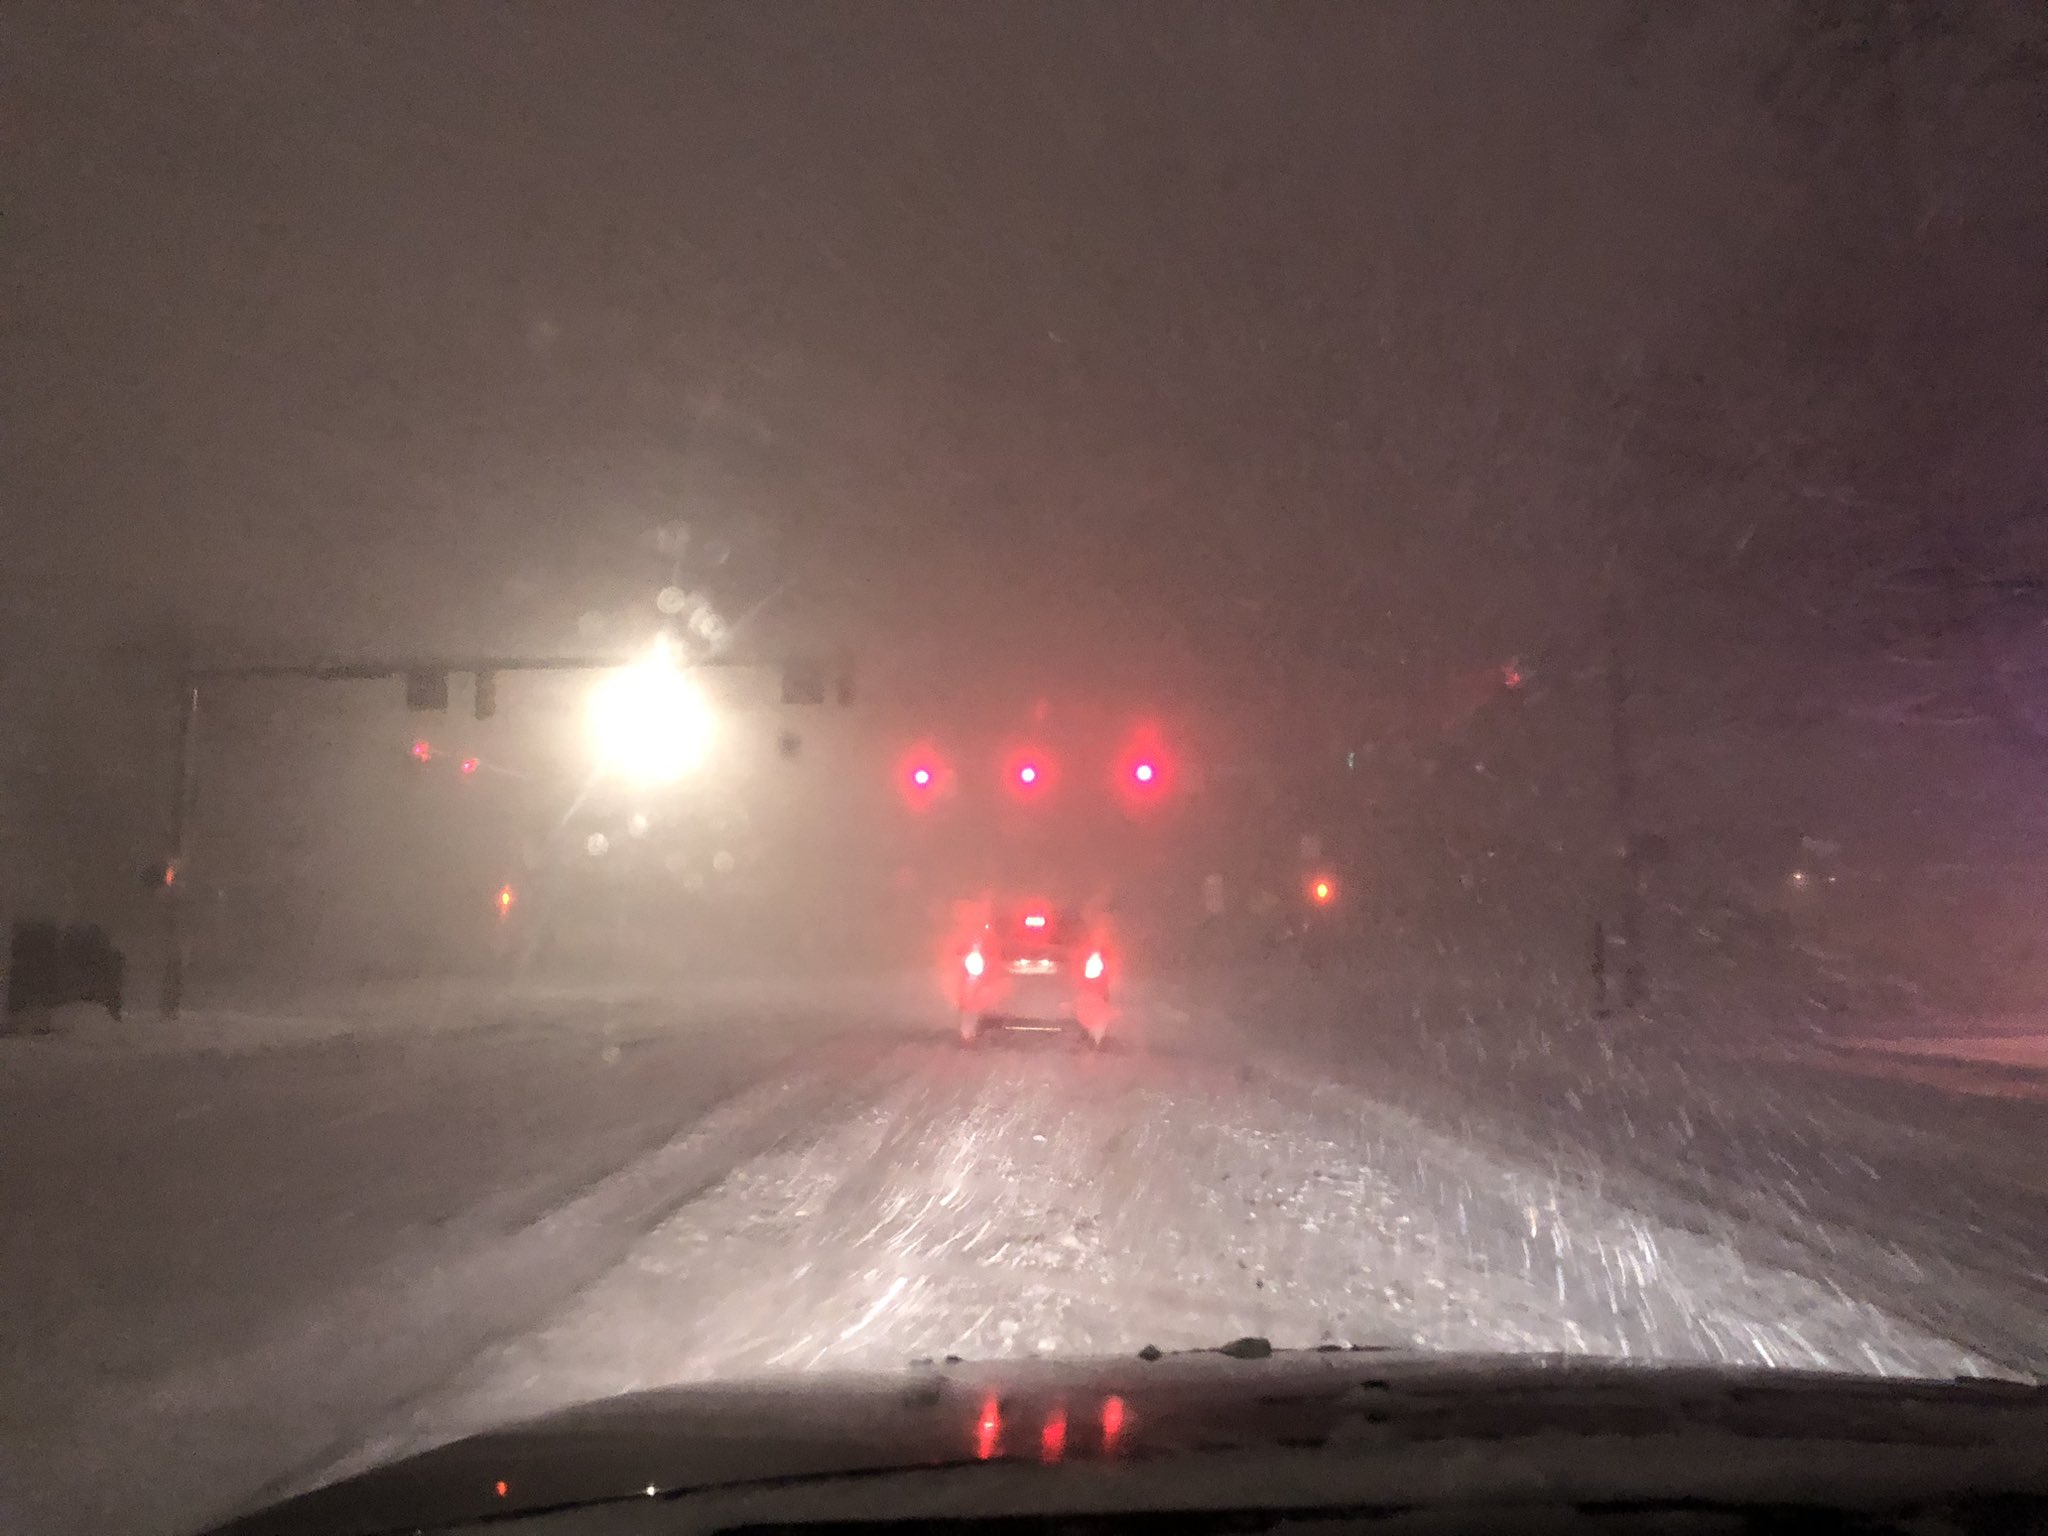 |
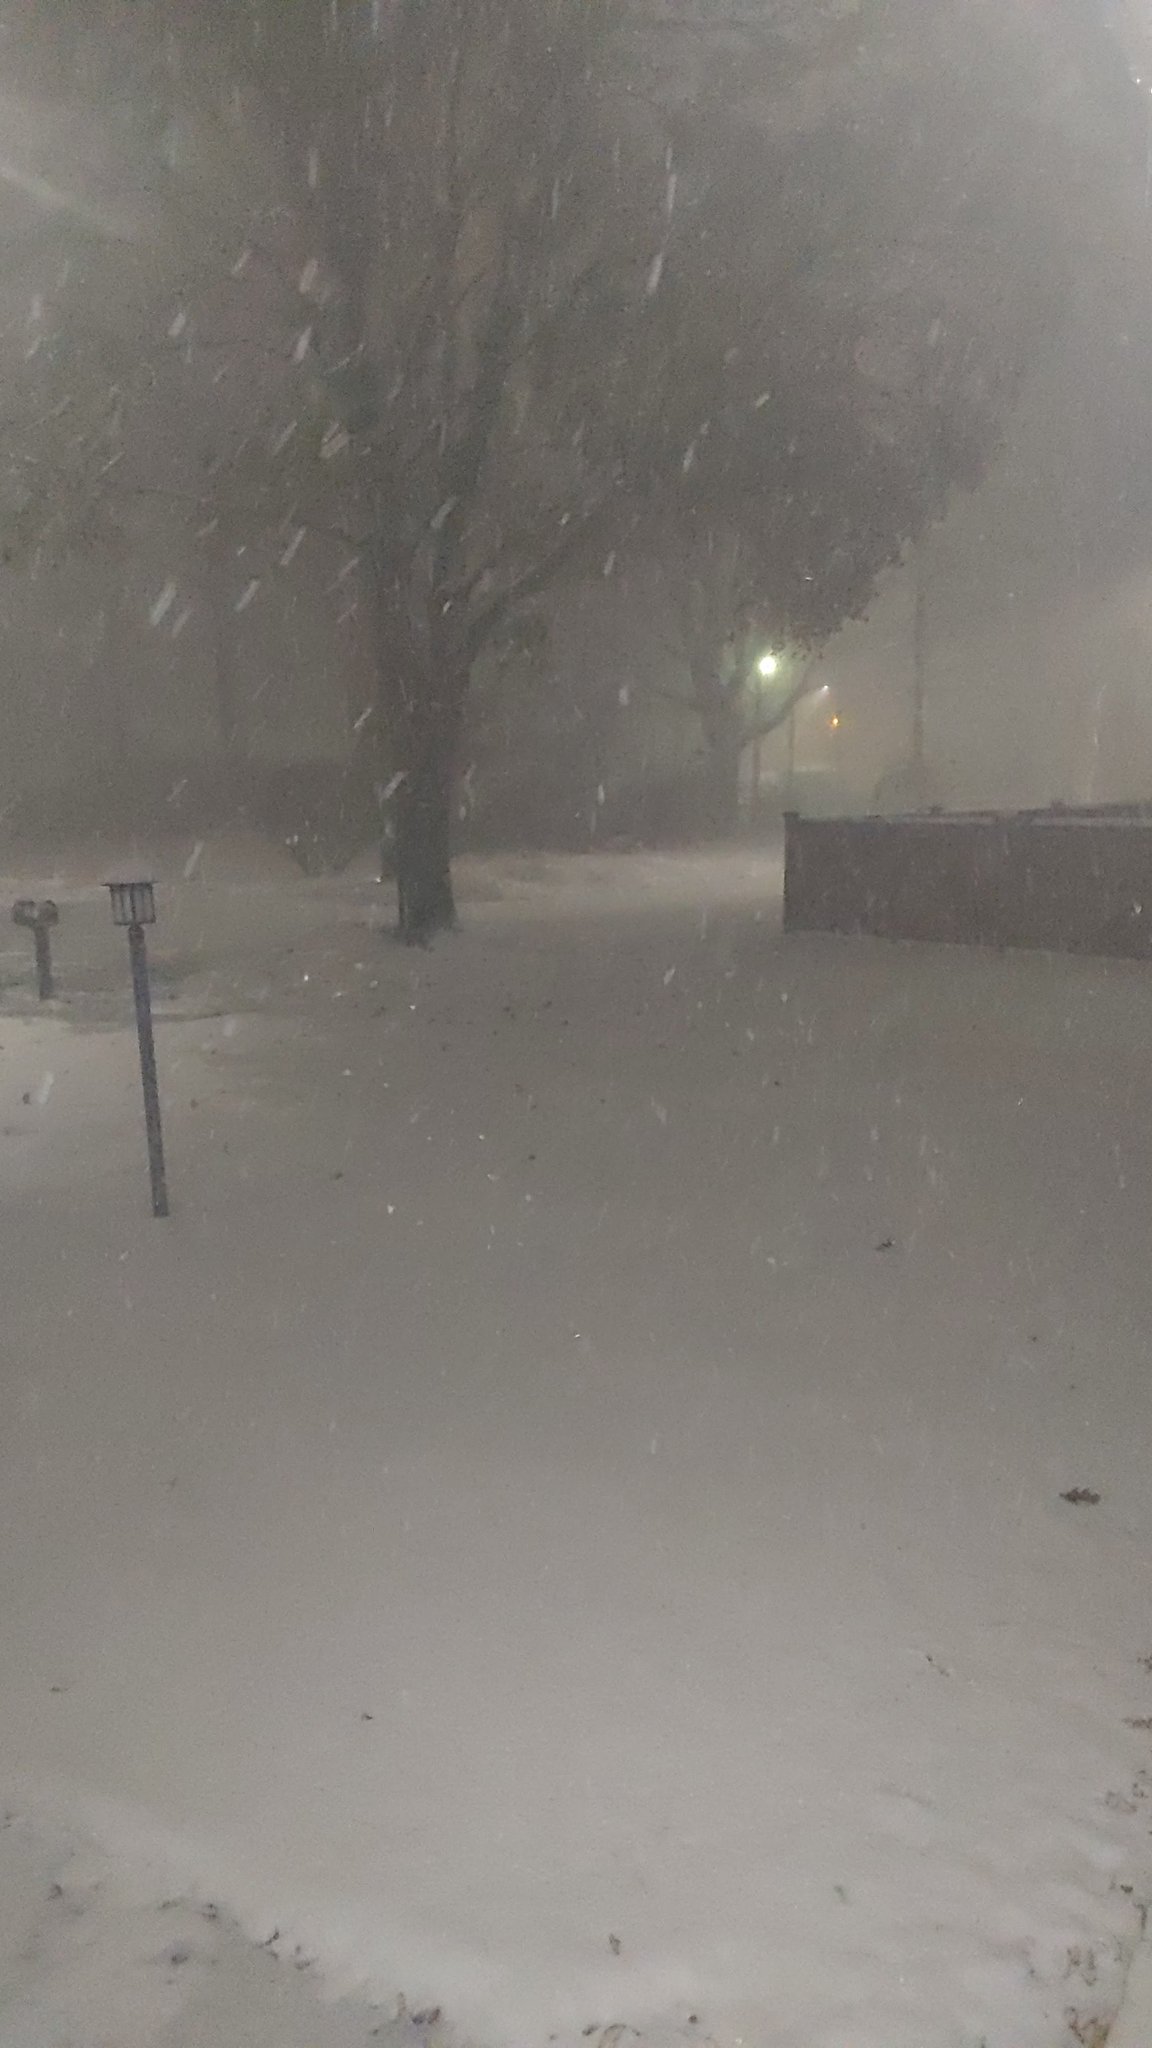 |
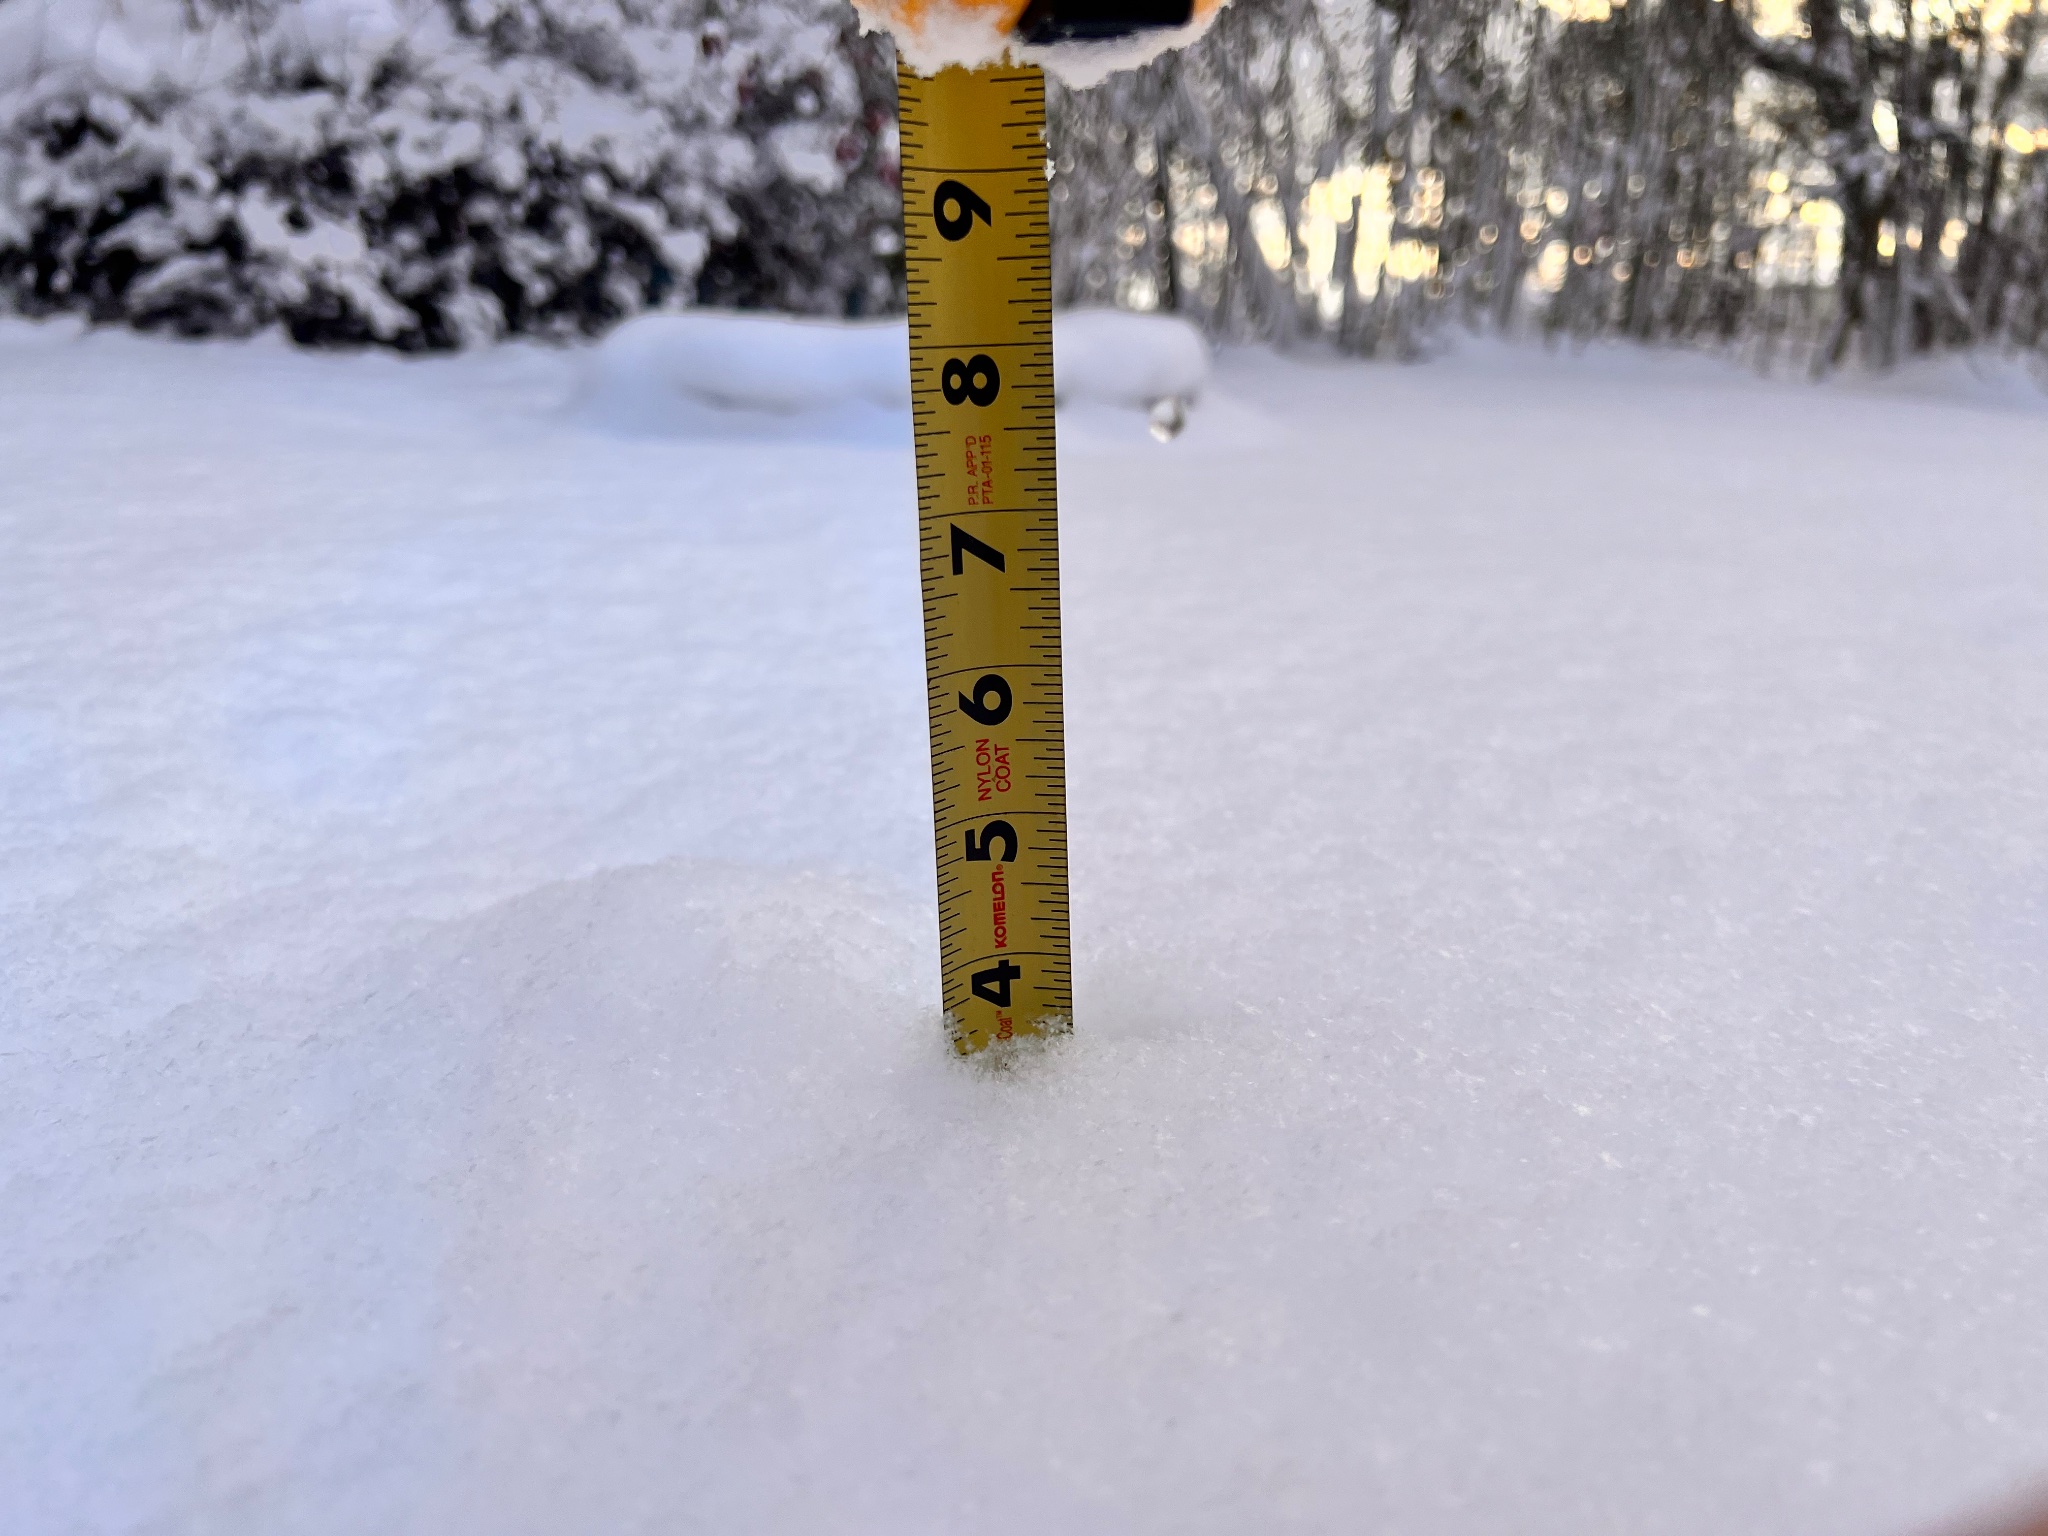 |
| Heavy snow accumulations in Granger, IN November 19-20th Photo courtesy of Luke Abbott |
Heavy bands of snow produced dangerous driving conditions in South Bend, IN November 19th-20th. Photo courtesy of Dave Caulfield |
Moderate snow accumulations from Elkhart, IN November 19th-20th. Photo courtesy of Jose Del Cid |
Moderate snow accumulations from Elkhart, IN November 19th-20th. Photo courtesy of Shanye East |
Radar
 |
 |
 |
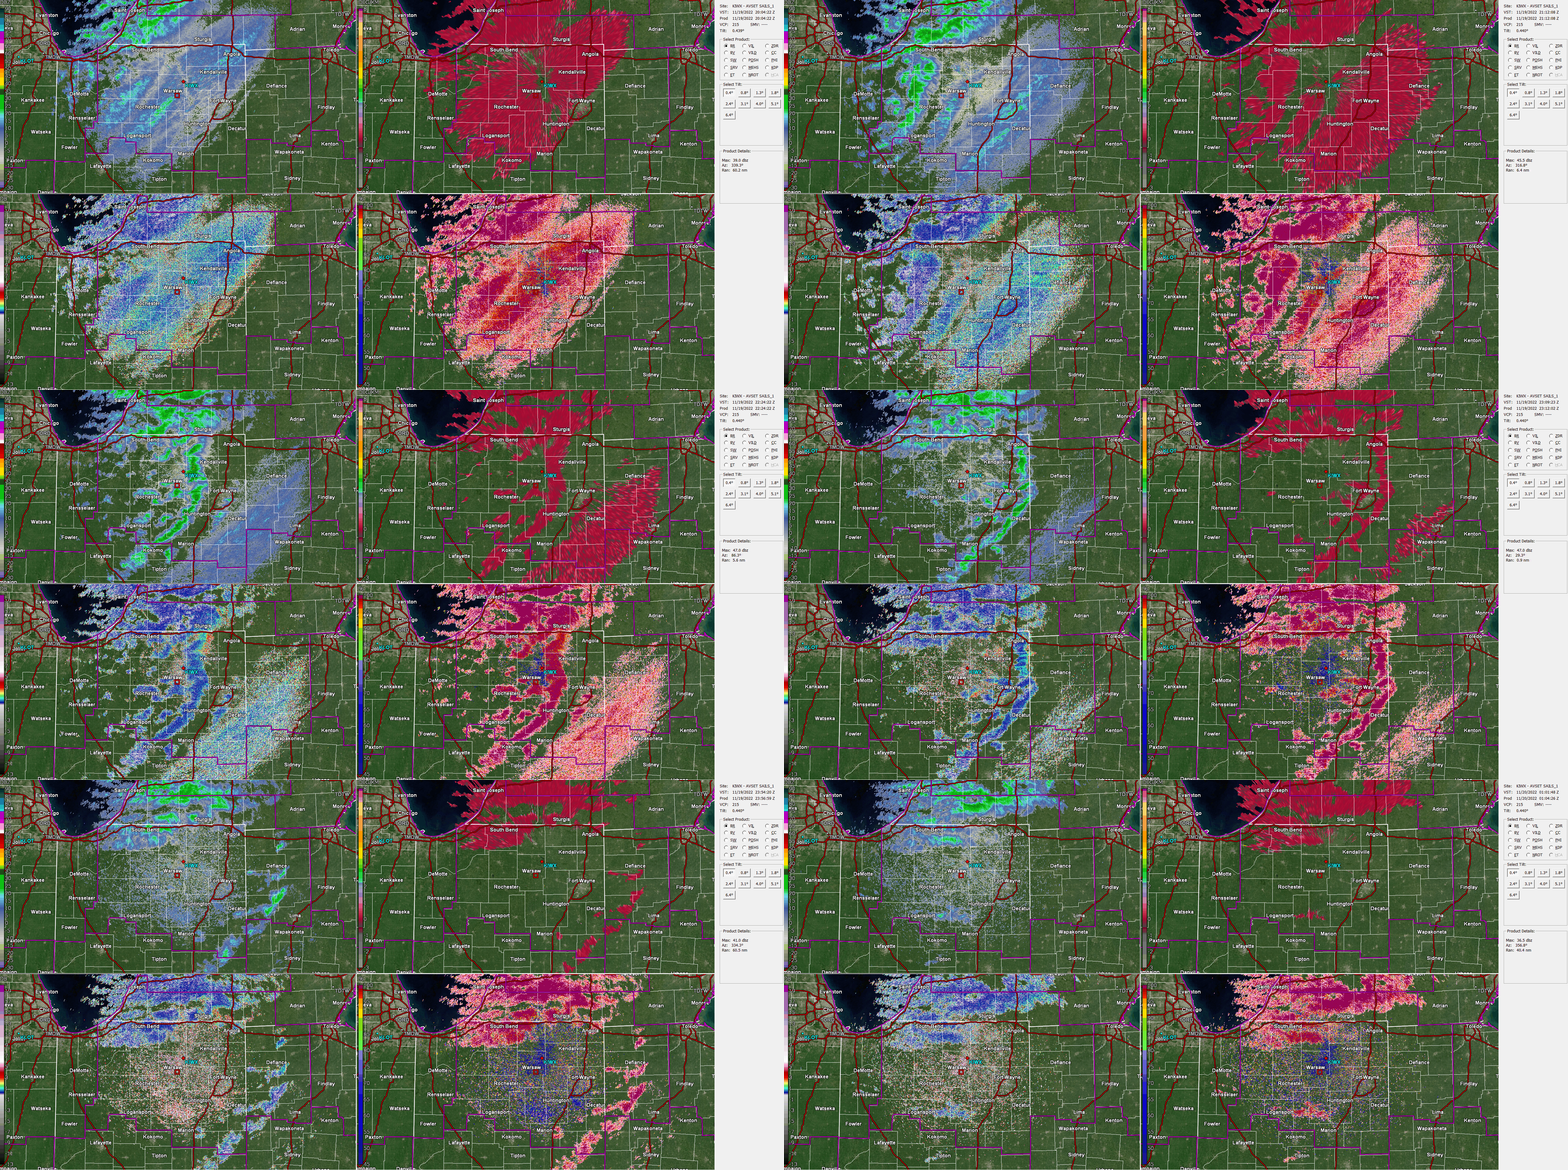 |
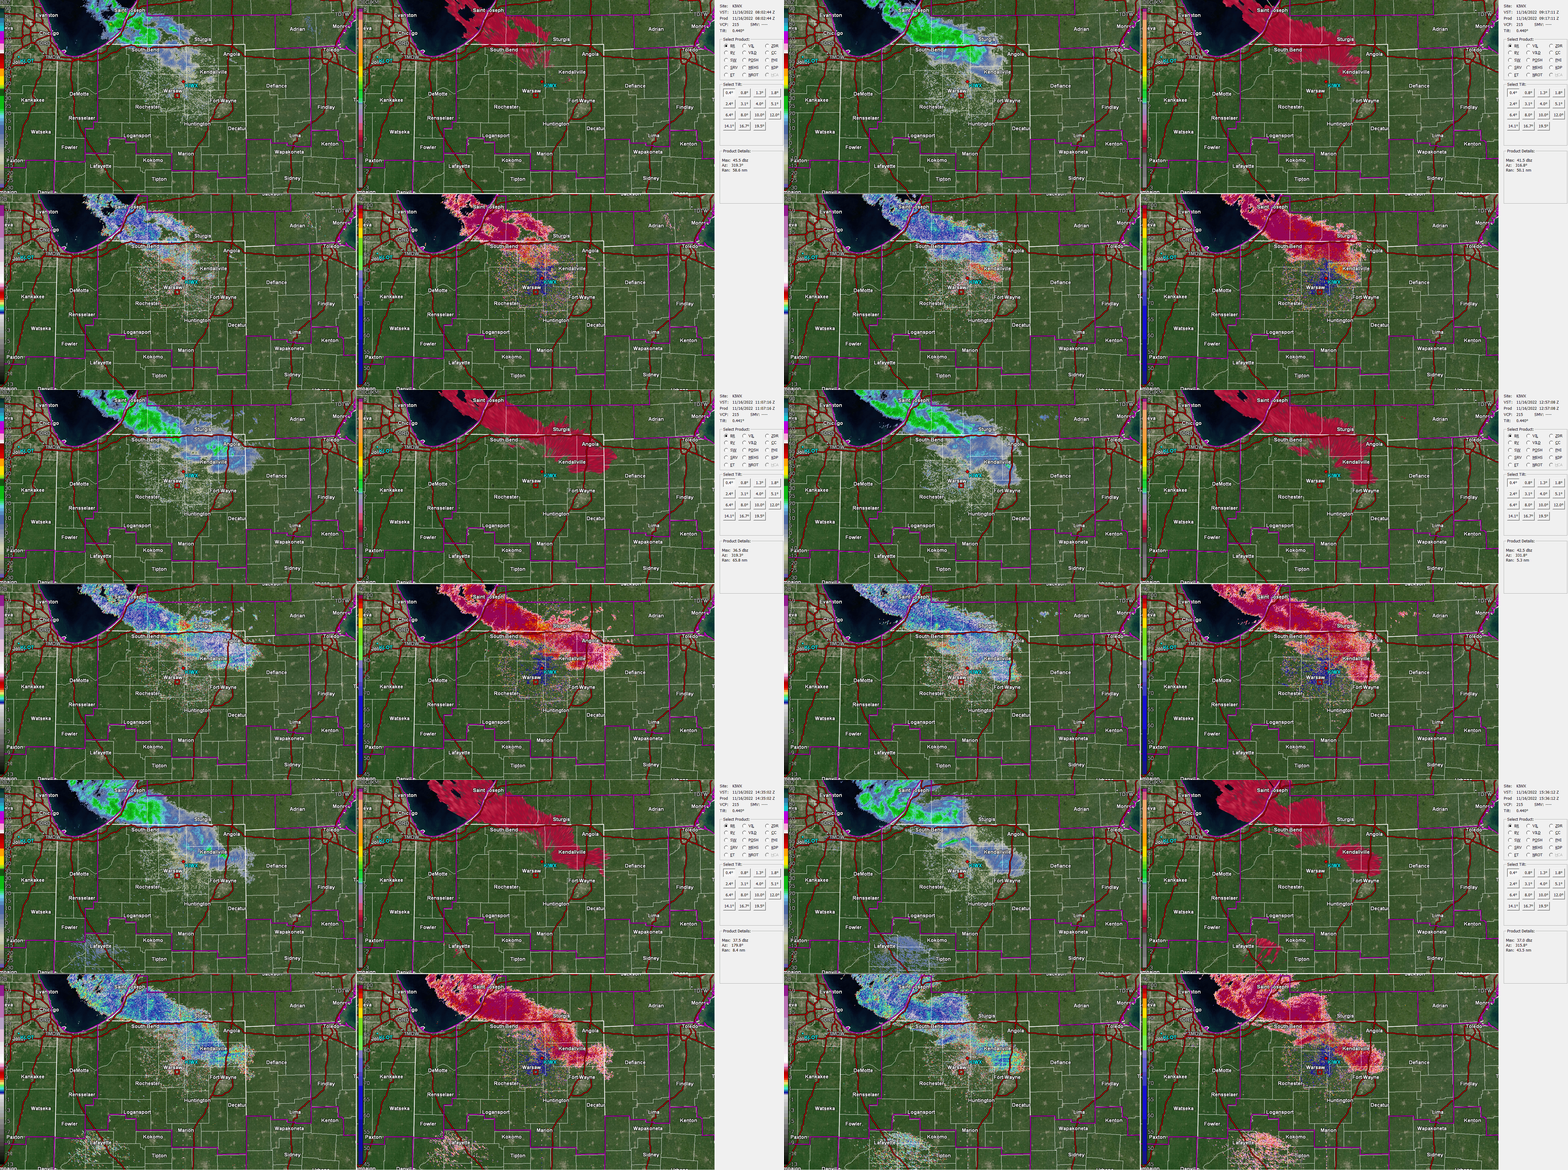
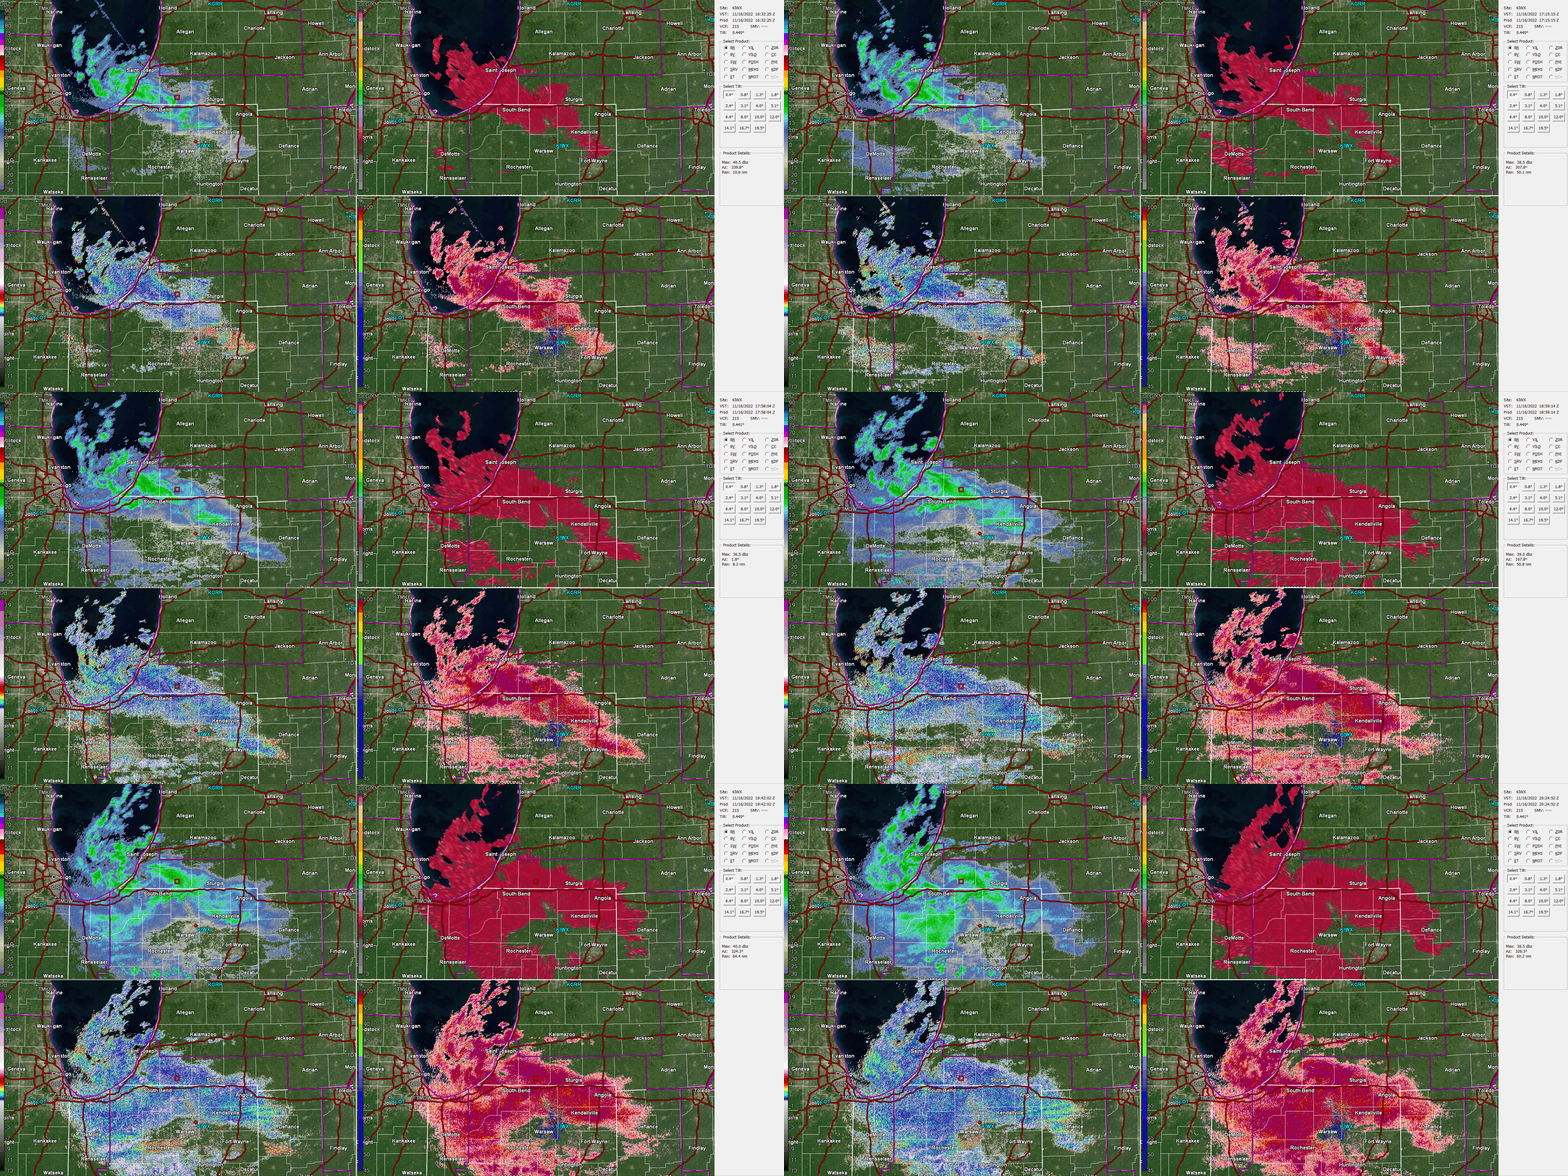
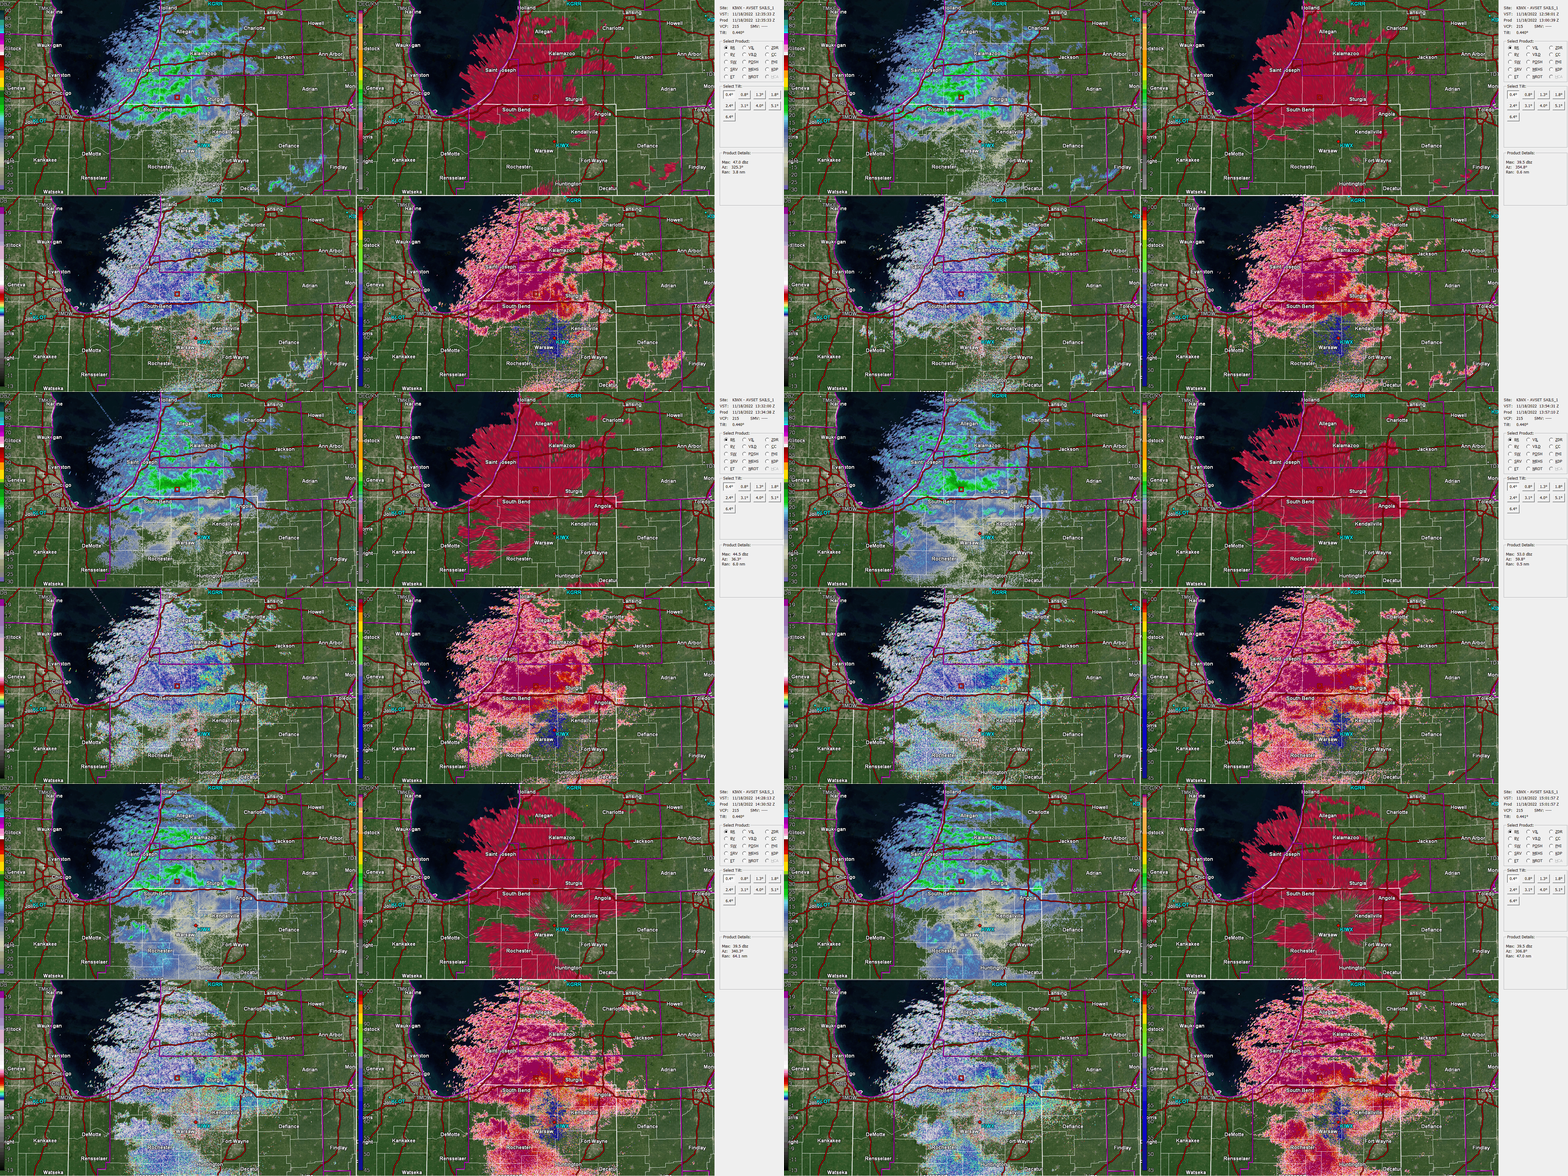
| Persistent banding occurred on Nov 16th allowing for heavy accumulations in Berrien and Cass counties Michigan. | A mesolow moved off Lake Michigan into the forecast area on Nov 16th. These often provide heavy snow as they move onshore. | A return to persistent banding in Berrien and Cass counties Michigan allowed for continued piling up of snow in that area on Nov 18th. | A line of briefly intense snow showers moved through the area during the afternoon of Nov 19th. Gusty winds between 30 and 40 mph combined with these snow showers to reduce visibility and bring quick snow accumulations as they went through. |
Wind Reports
PUBLIC INFORMATION STATEMENT
NATIONAL WEATHER SERVICE NORTHERN INDIANA
529 PM EST SUN NOV 20 2022

...HIGHEST WIND REPORTS FROM NOVEMBER 19...

LOCATION                     SPEED     TIME/DATE       LAT/LON

...INDIANA...

...ALLEN COUNTY...
FORT WAYNE INTERNATIONAL AP  39 MPH    0556 PM 11/19   40.98N/85.18W
2.9 S WALLEN (INDOT)         32 MPH    0849 PM 11/19   41.17N/85.09W

...CASS COUNTY...
WALTON                       31 MPH    0601 PM 11/19   40.66N/86.22W
LOGANSPORT                   30 MPH    0755 PM 11/19   40.72N/86.37W

...DE KALB COUNTY...
AUBURN DEKALB C              30 MPH    0615 PM 11/19   41.30N/85.07W

...ELKHART COUNTY...
GOSHEN                       38 MPH    0538 PM 11/19   41.53N/85.78W

...FULTON COUNTY...
ROCHESTER                    32 MPH    1035 PM 11/19   41.07N/86.18W

...GRANT COUNTY...
REXFORD                      35 MPH    0527 PM 11/19   40.59N/85.67W
GAS CITY                     35 MPH    0629 PM 11/19   40.48N/85.55W
GRANT COUNTY MUNICIPAL APT   33 MPH    0615 PM 11/19   40.48N/85.68W

...HUNTINGTON COUNTY...
HUNTINGTON                   41 MPH    0618 PM 11/19   40.83N/85.53W
MARKLE                       31 MPH    0843 PM 11/19   40.82N/85.41W

...JAY COUNTY...
PORTLAND                     31 MPH    0701 PM 11/19   40.43N/85.03W

...KOSCIUSKO COUNTY...
WARSAW MUNI                  32 MPH    0615 PM 11/19   41.27N/85.83W

...LA PORTE COUNTY...
MICHIGAN CITY KMGC           33 MPH    0915 PM 11/19   41.70N/86.82W
PINNEY PURDUE AGRICULTURAL C 32 MPH    0530 PM 11/19   41.45N/86.93W
LA PORTE                     31 MPH    0635 PM 11/19   41.57N/86.73W

...MARSHALL COUNTY...
PLYMOUTH SITE KC65           30 MPH    0655 PM 11/19   41.37N/86.30W

...MIAMI COUNTY...
GRISSOM AFB PERU             33 MPH    0612 PM 11/19   40.63N/86.15W
SANTA FE                     31 MPH    0529 PM 11/19   40.64N/85.99W
AMBOY                        31 MPH    0630 PM 11/19   40.59N/85.98W

...NOBLE COUNTY...
KENDALLVILLE                 35 MPH    1055 PM 11/19   41.47N/85.25W

...ST. JOSEPH COUNTY...
SOUTH BEND INTERNATIONAL AP  38 MPH    0952 PM 11/19   41.70N/86.32W

...STEUBEN COUNTY...
ANGOLA                       30 MPH    1035 PM 11/19   41.63N/85.08W

...WABASH COUNTY...
SOMERSET                     31 MPH    0540 PM 11/19   40.66N/85.81W

...WELLS COUNTY...
MARKLE                       30 MPH    0620 PM 11/19   40.86N/85.32W
OSSIAN                       30 MPH    0640 PM 11/19   40.84N/85.10W

...WHITLEY COUNTY...
NORTHEAST PURDUE AGRICULTURA 30 MPH    0630 PM 11/19   41.11N/85.40W
4.5 S COLUMBIA CITY          30 MPH    0745 PM 11/19   41.09N/85.47W

...MICHIGAN...

...BERRIEN COUNTY...
BENTON HARBOR                47 MPH    0608 PM 11/19   42.13N/86.42W
2.0 W SPINKS CORNERS (MAWN)  36 MPH    0700 PM 11/19   42.08N/86.36W
2.2 W BERRIEN SPRINGS (MAWN) 33 MPH    0900 PM 11/19   41.94N/86.38W
EAU CLAIRE                   32 MPH    0939 PM 11/19   41.99N/86.27W

...BRANCH COUNTY...
COLDWATER                    30 MPH    0535 PM 11/19   41.92N/85.03W

...OHIO...

...ALLEN COUNTY...
LIMA                         40 MPH    0739 PM 11/19   40.70N/84.02W
LIMA 1 N                     38 MPH    0545 PM 11/19   40.78N/84.12W
BLUFFTON                     31 MPH    0950 PM 11/19   40.89N/83.89W

...DEFIANCE COUNTY...
INNOVATIVE AG MNGT, HICKSVIL 35 MPH    0635 PM 11/19   41.37N/84.65W
DEFIANCE                     35 MPH    0650 PM 11/19   41.33N/84.43W

...FULTON COUNTY...
WAUSEON                      31 MPH    0735 PM 11/19   41.62N/84.13W

...PUTNAM COUNTY...
OTTAWA                       43 MPH    0715 PM 11/19   41.03N/83.98W
KALIDA                       35 MPH    0545 PM 11/19   40.98N/84.20W

...VAN WERT COUNTY...
VAN WERT                     46 MPH    0700 PM 11/19   40.85N/84.48W

OBSERVATIONS ARE COLLECTED FROM A VARIETY OF SOURCES WITH VARYING
EQUIPMENT AND EXPOSURES. WE THANK ALL VOLUNTEER WEATHER OBSERVERS
FOR THEIR DEDICATION. NOT ALL DATA LISTED ARE CONSIDERED OFFICIAL.

$$
Environment
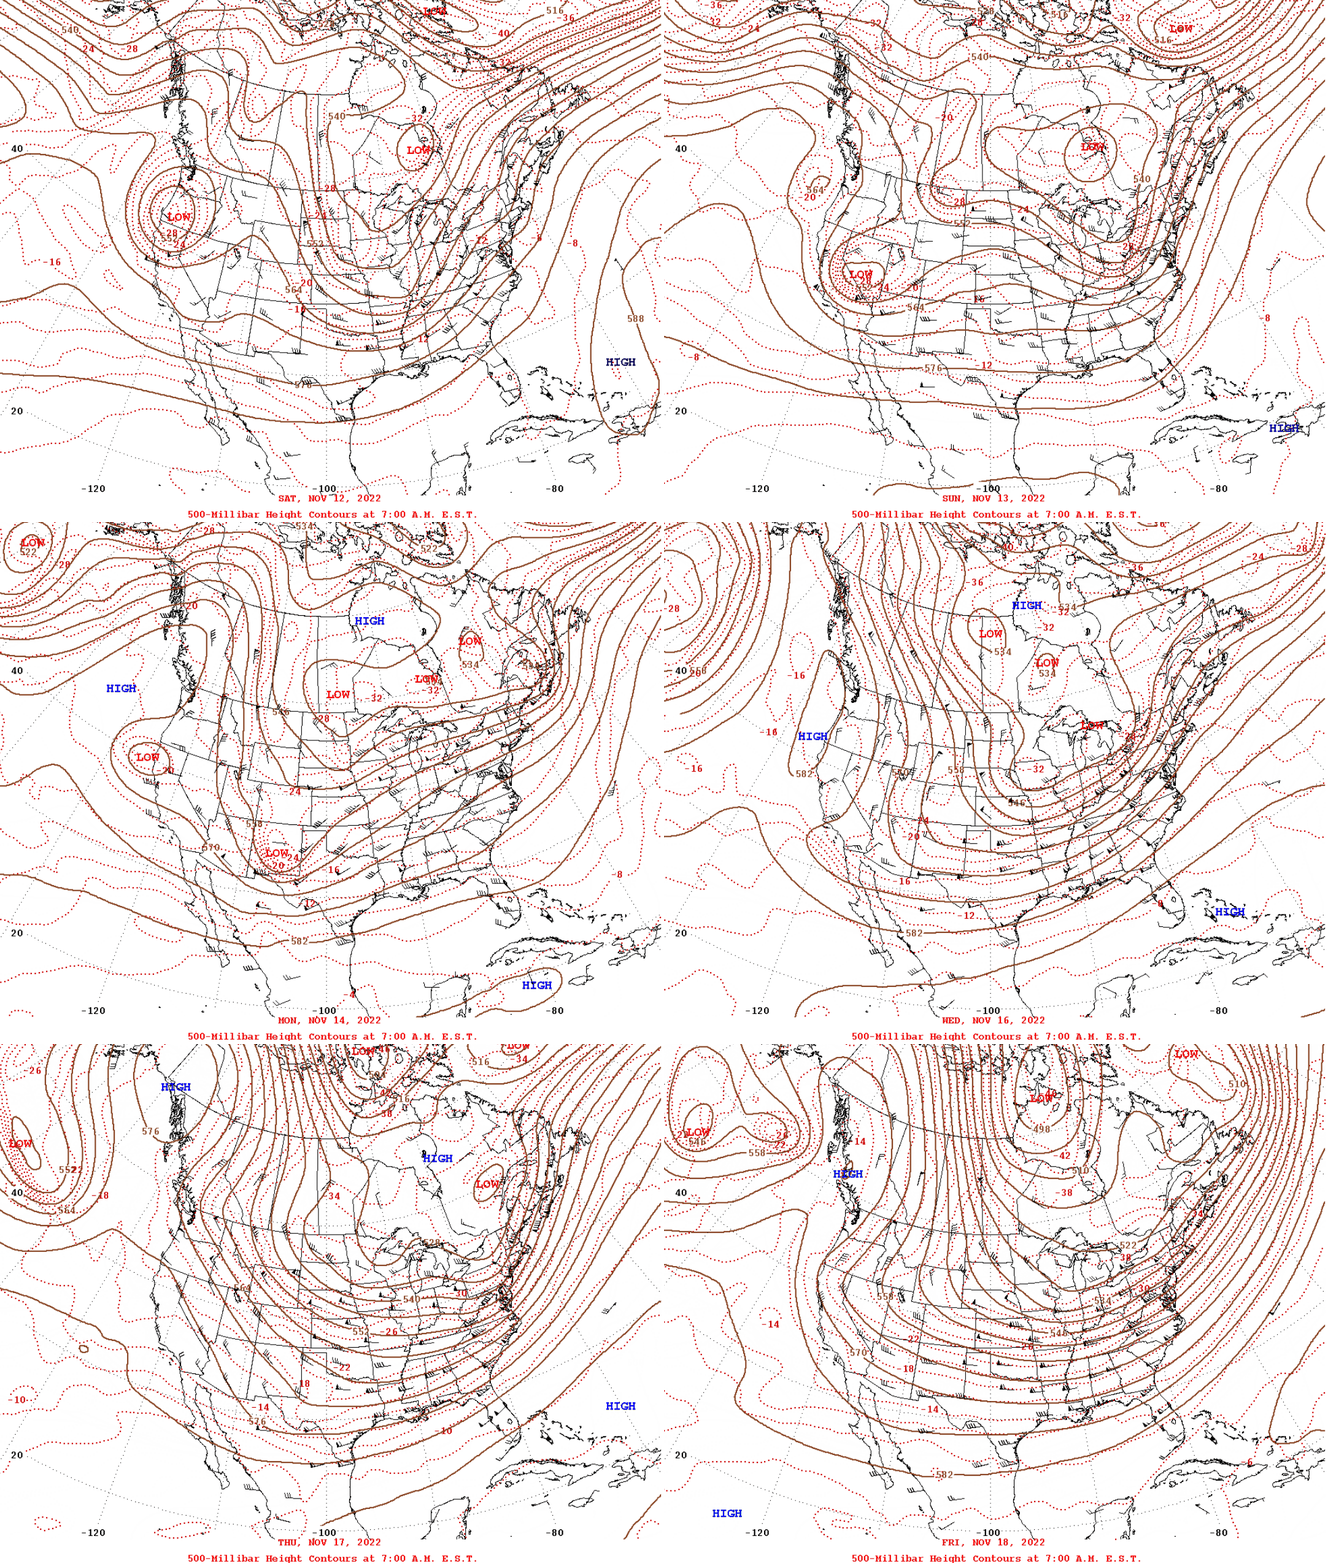
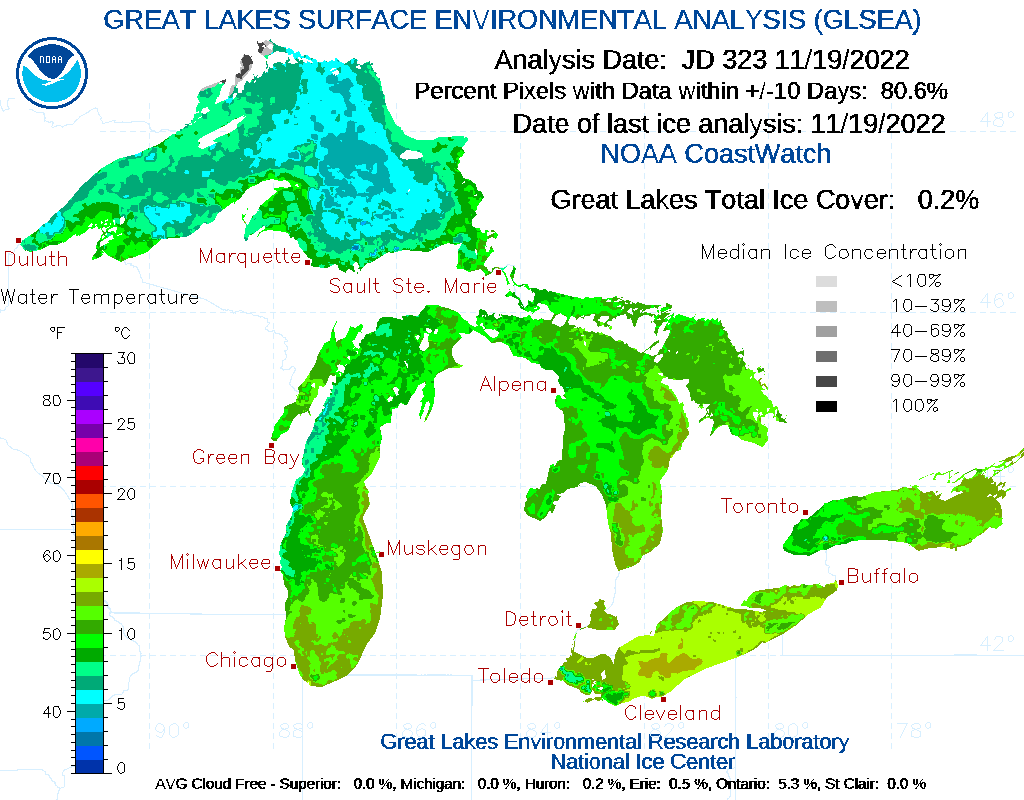
Broad cyclonic flow and unseasonably cold air mass resulted in an extended period of conditions favorable for lake effect snow showers. This cold air aloft and frontal forcing also was conducive for bursts of heavier snow even outside of lake effect areas.
 |
 |
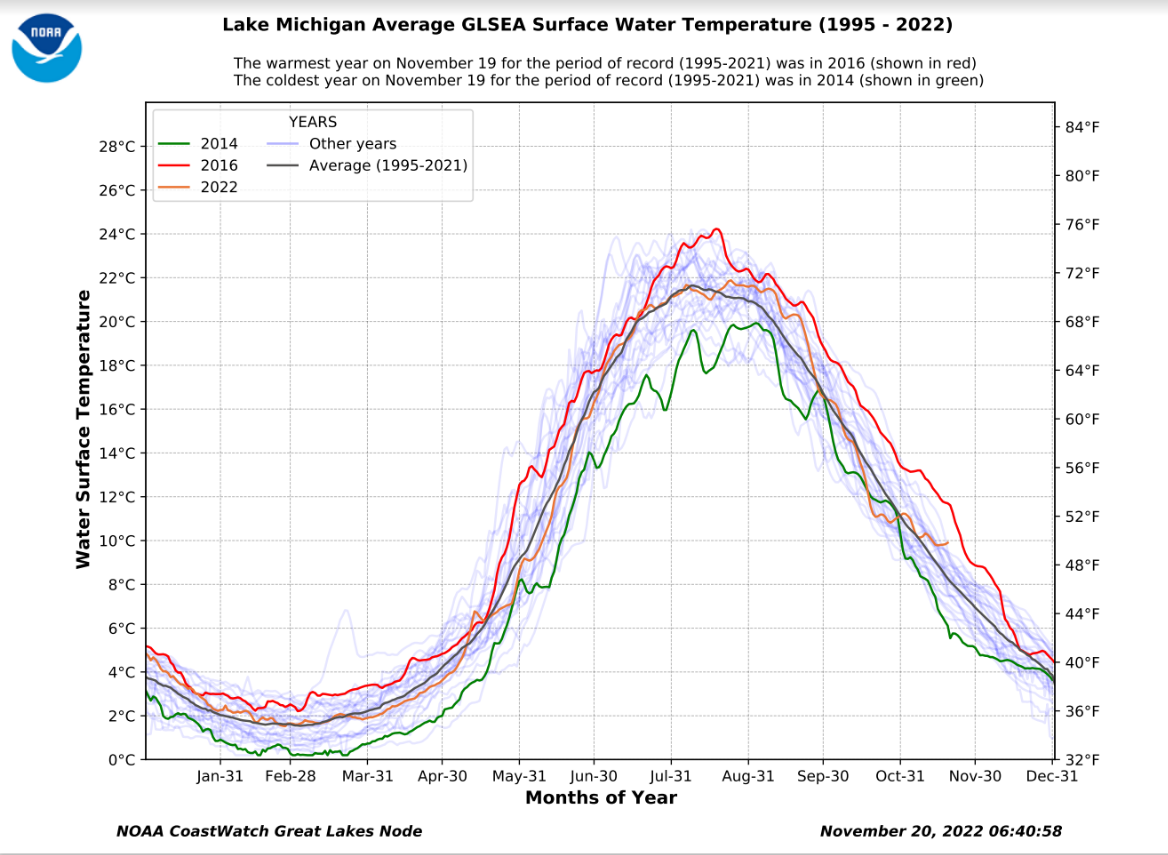 |
| Figure 1: 500mb chart from November 12-18th. A low (trough) was a regular occurence in the vicinity of James Bay. This provided the cold air and cyclonic flow necessary for lake effect snow in our area. | Figure 2: GLSEA lake water temperature analysis indicating relatively warm water temperatures across southern Lake Michigan (45-50 deg F). Cold air flowing over warmer lake waters in a major ingredient for heavy lake effect snow. | Figure 3: A look at normal Lake Michigan water temperatures through the year. Notice how the curve for 2022 indicates above normal lake temperatures developing over the past month. |
.
 |
 |
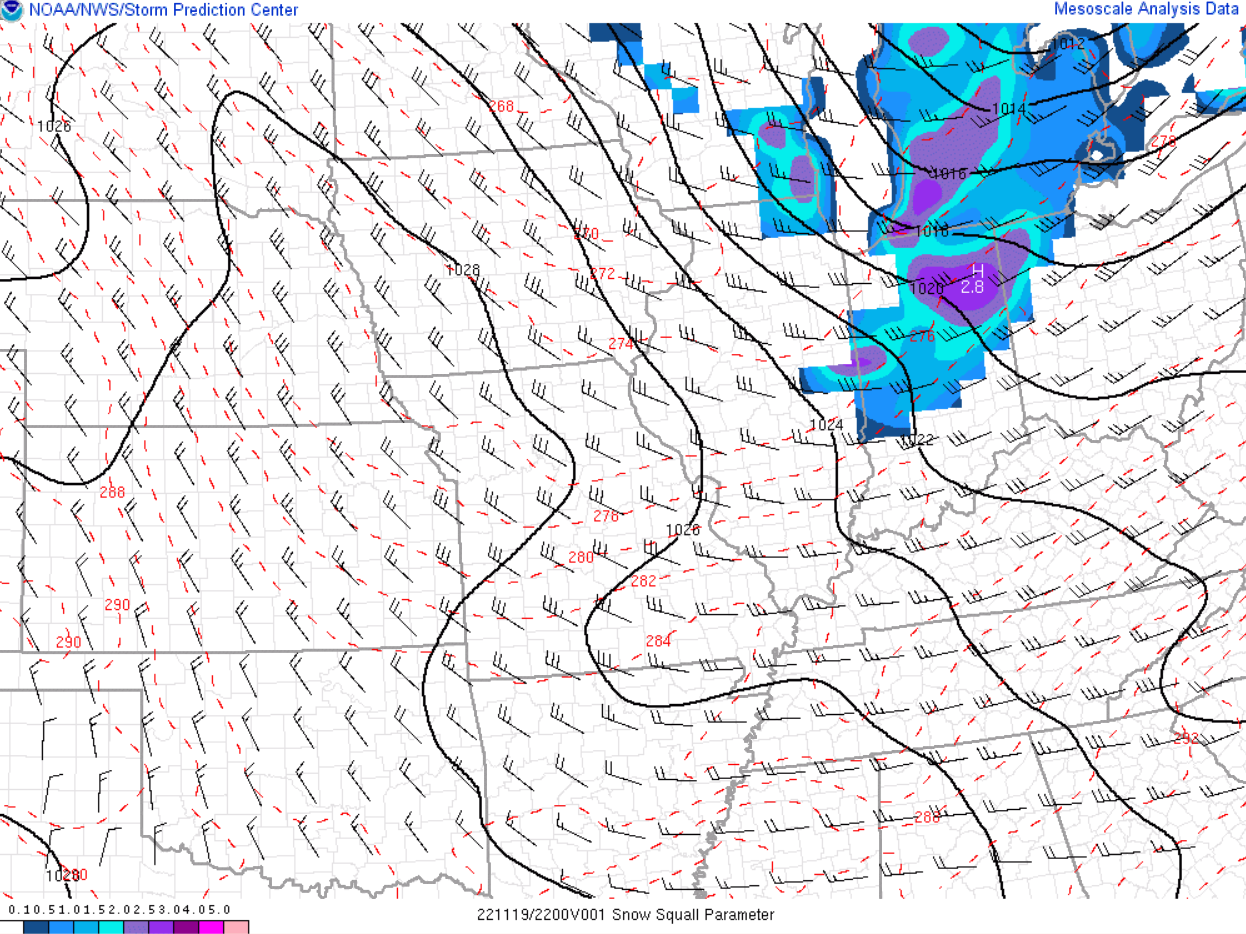 |
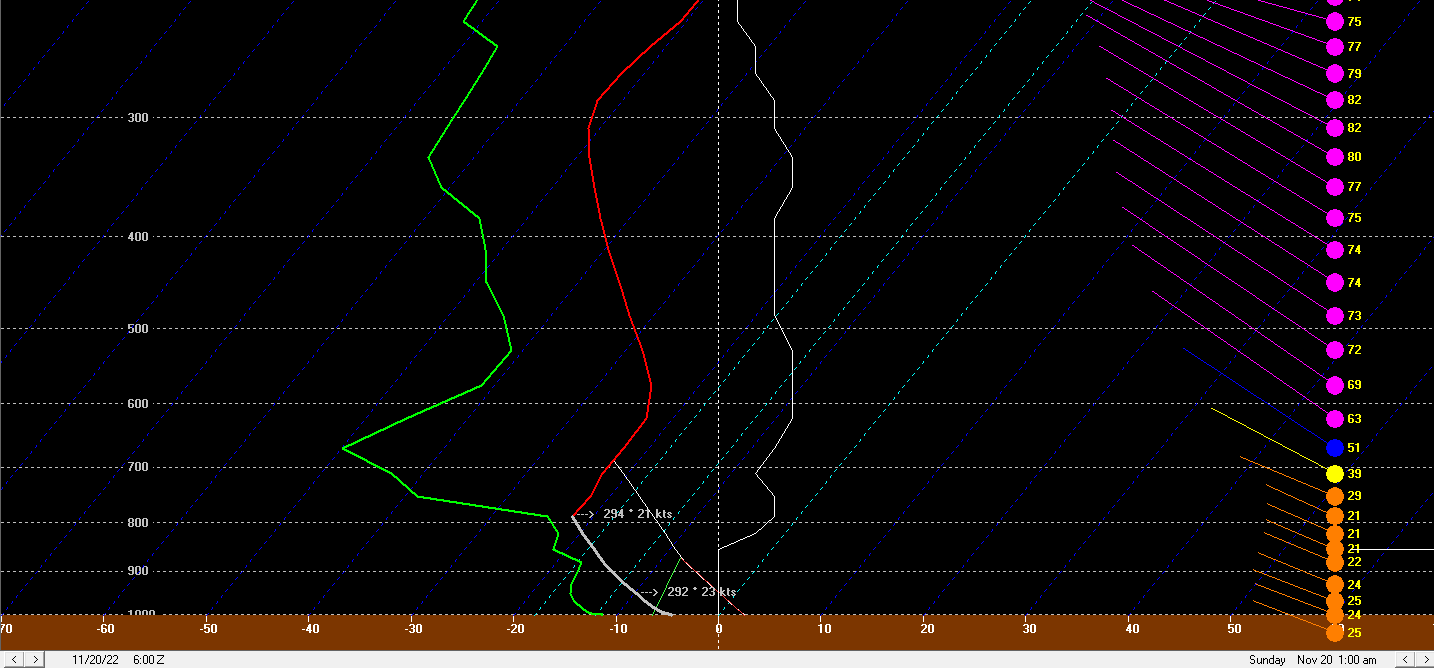
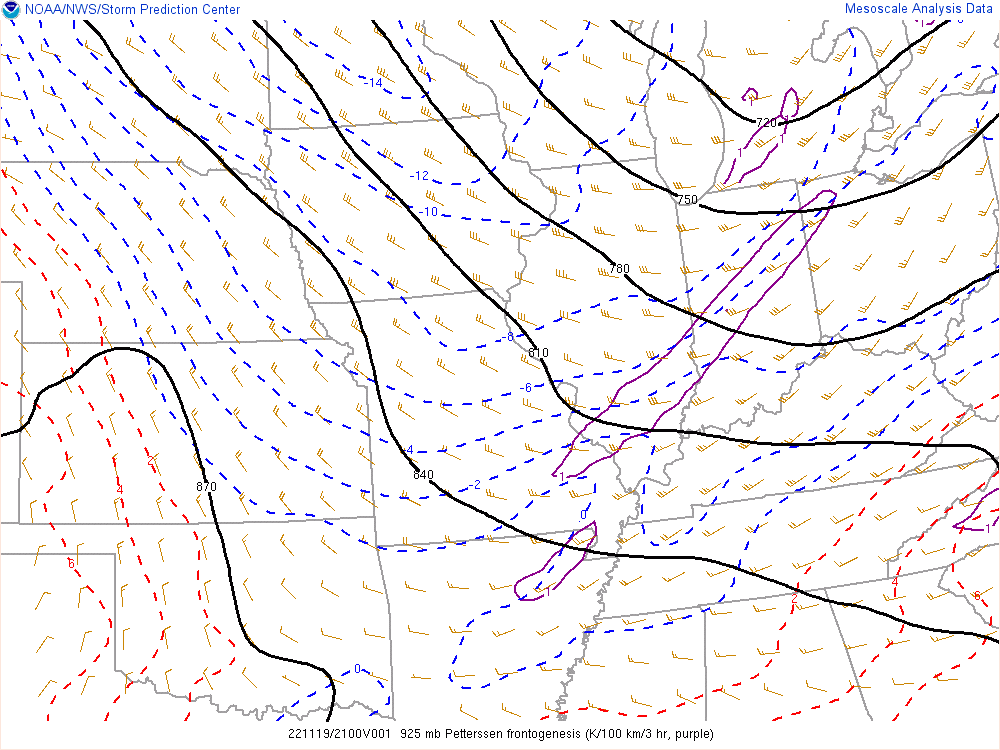
| Figure 4: An analysis of sounding for point over southern Lake Michigan (mid-lake) valid at 1am November 20th. Steep low level lapse rates below 800 mb led to robust convective response with the lake effect snow showers. | Figure 5: In addition to a favorable lake effect snow shower setup, a disturbance and reinforcing cold front provided low level frontogenesis forcing (map above 925 mb frontogenesis valid at 5pm ET November 19th) that led to favorable conditions for snow squalls (see Fig 6). | Figure 6: RAP analysis valid at 5pm ET November 19th of the Snow Squall Parameter. Values over 1 generally indicate conditions favorable for snow squalls that can result in rapid reductions in visibility and very hazardous travel conditions. |
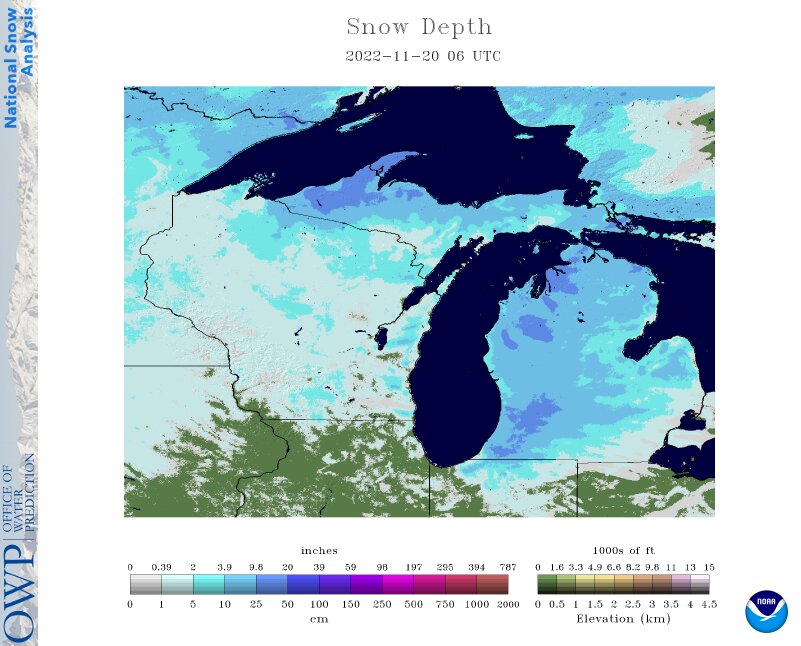 |
| Figure 7: Latest analysis of snow depth from the National Operational Hydrologic Remote Sensing Center, valid at 1 am November 20th, 2022. Extensive snow cover exists due to the prolonged period of favorable lake effect snow shower setup. |
Additional Information
The Forecast
 |
 |
 |
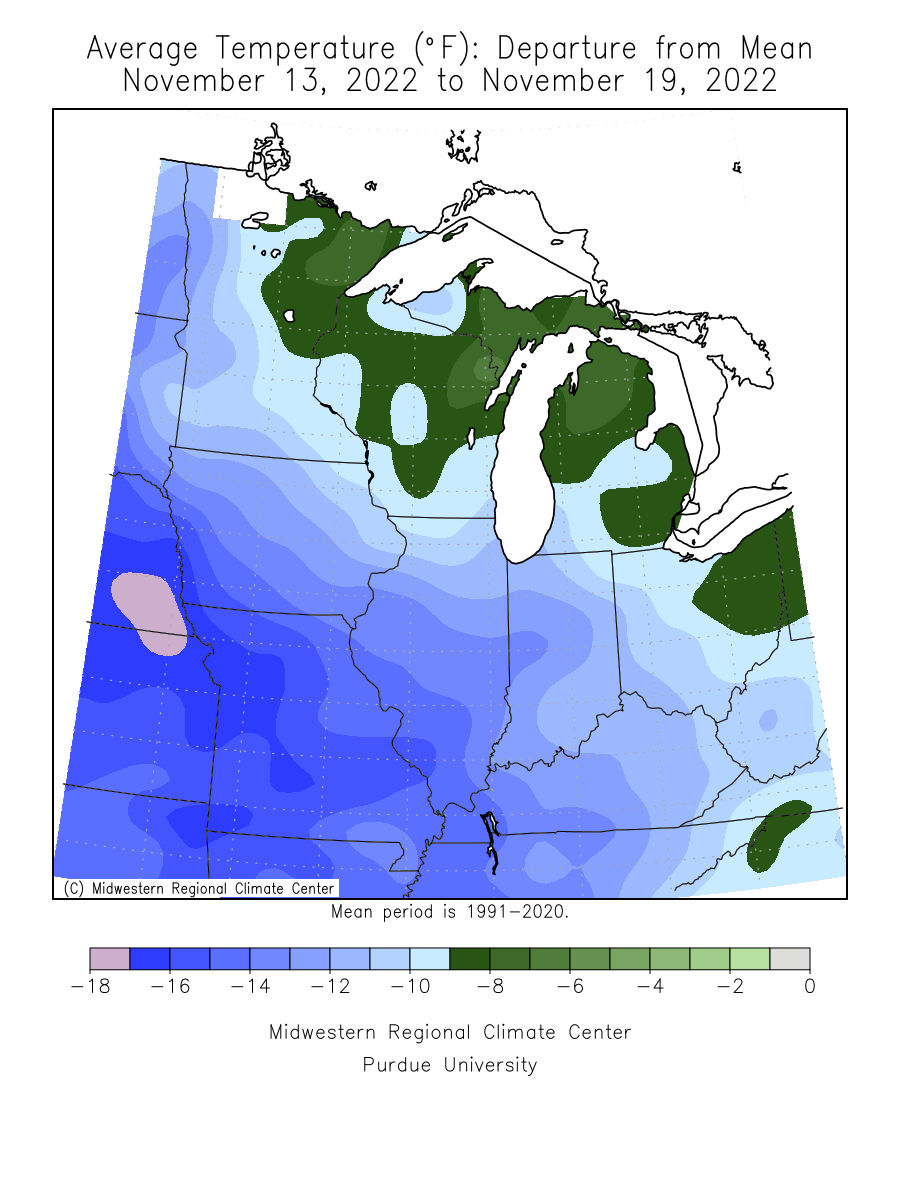 |
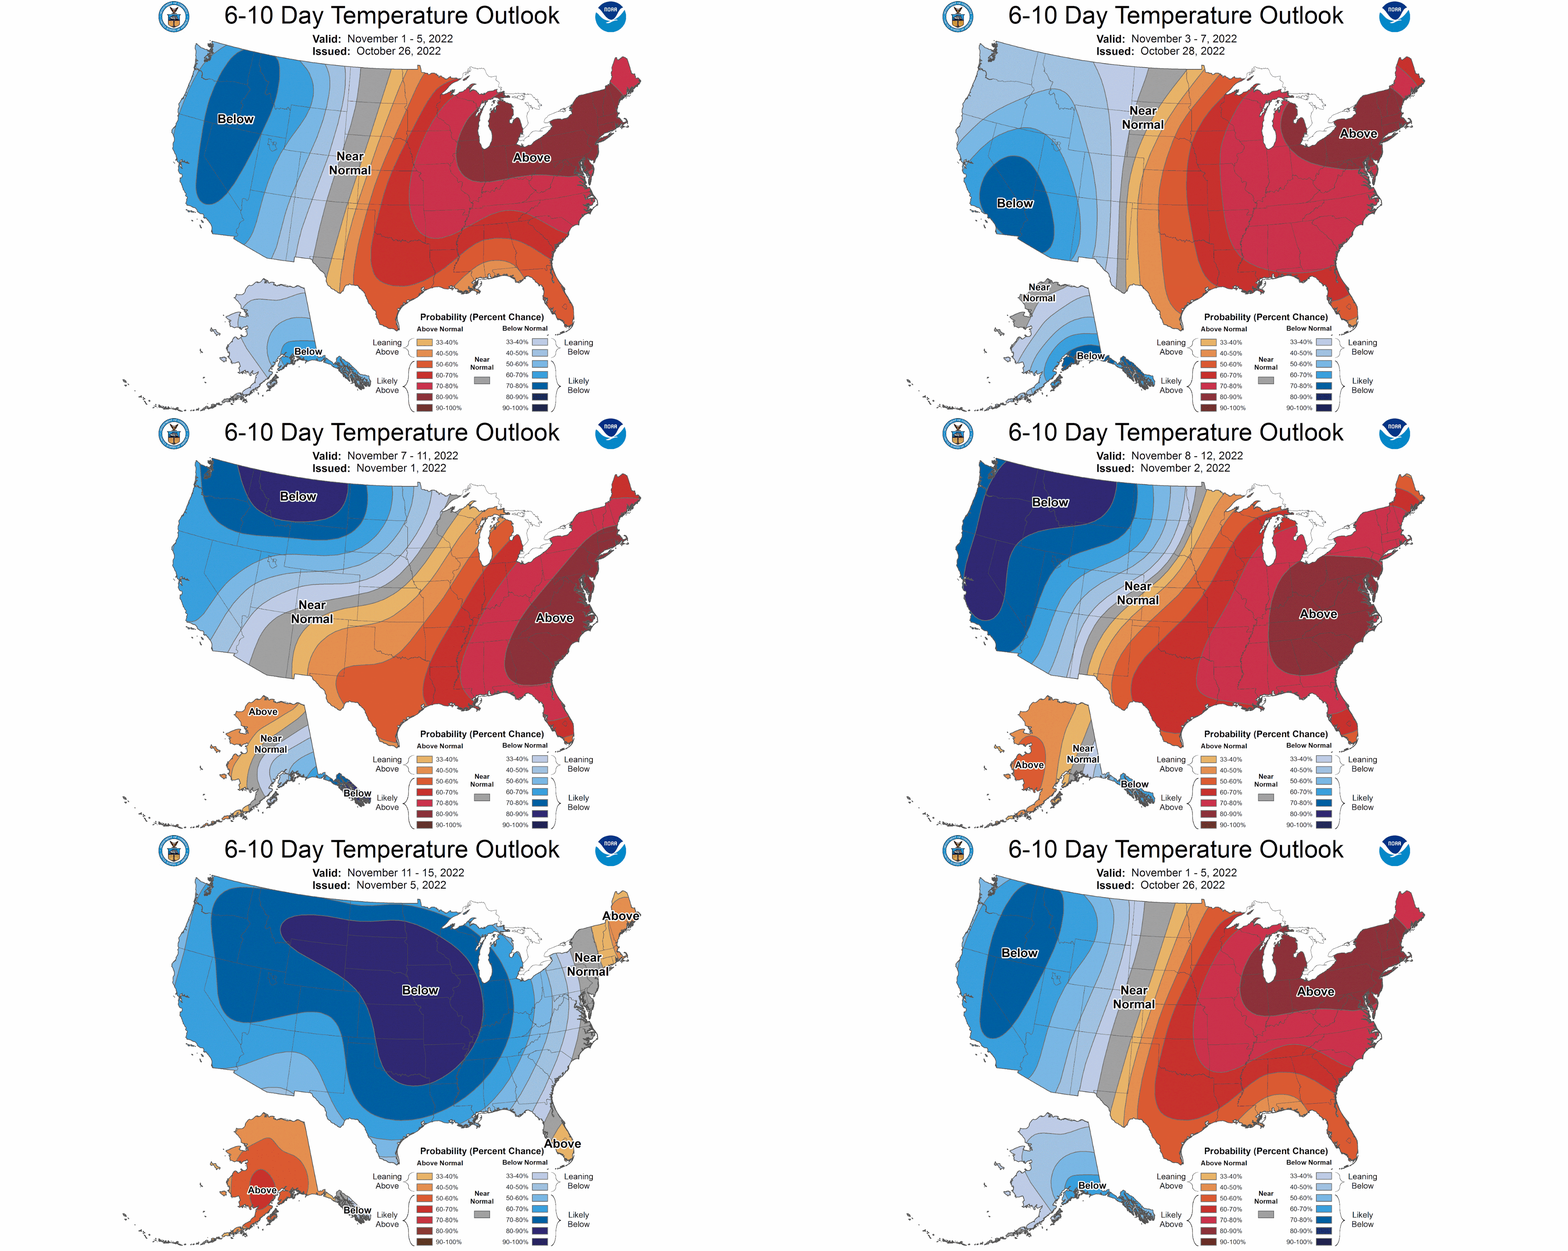
| These are the Climate Prediction Center's 6-10 Day Outlooks. The maps shown were issued about every two days from October 26th through November 5th. Notice how for the forecast period at the start of November, odds favored above normal temperatures in our area. This quickly changed as the forecast period became mid-November and colder than normal temperatures were favored. | South Bend temperature ranges showing how back and forth our highs and lows have been for a little over the past month. Temperatures within the red background are above normal, those in the blue are below normal, and those in the brown are around normal. (Photo courtesy of ACIS data) | Individual average mean temperature departure from normal values showing just how warm the period from late October to early November was for the Midwest. (Photo courtesy of SERCC) | Average temperature departure from normal during mid November as a result of the cold air outbreak. This was in contrast to early November and late October. (Photo courtesy of MRCC) |
 |
Media use of NWS Web News Stories is encouraged! Please acknowledge the NWS as the source of any news information accessed from this site. |
 |