Overview
|
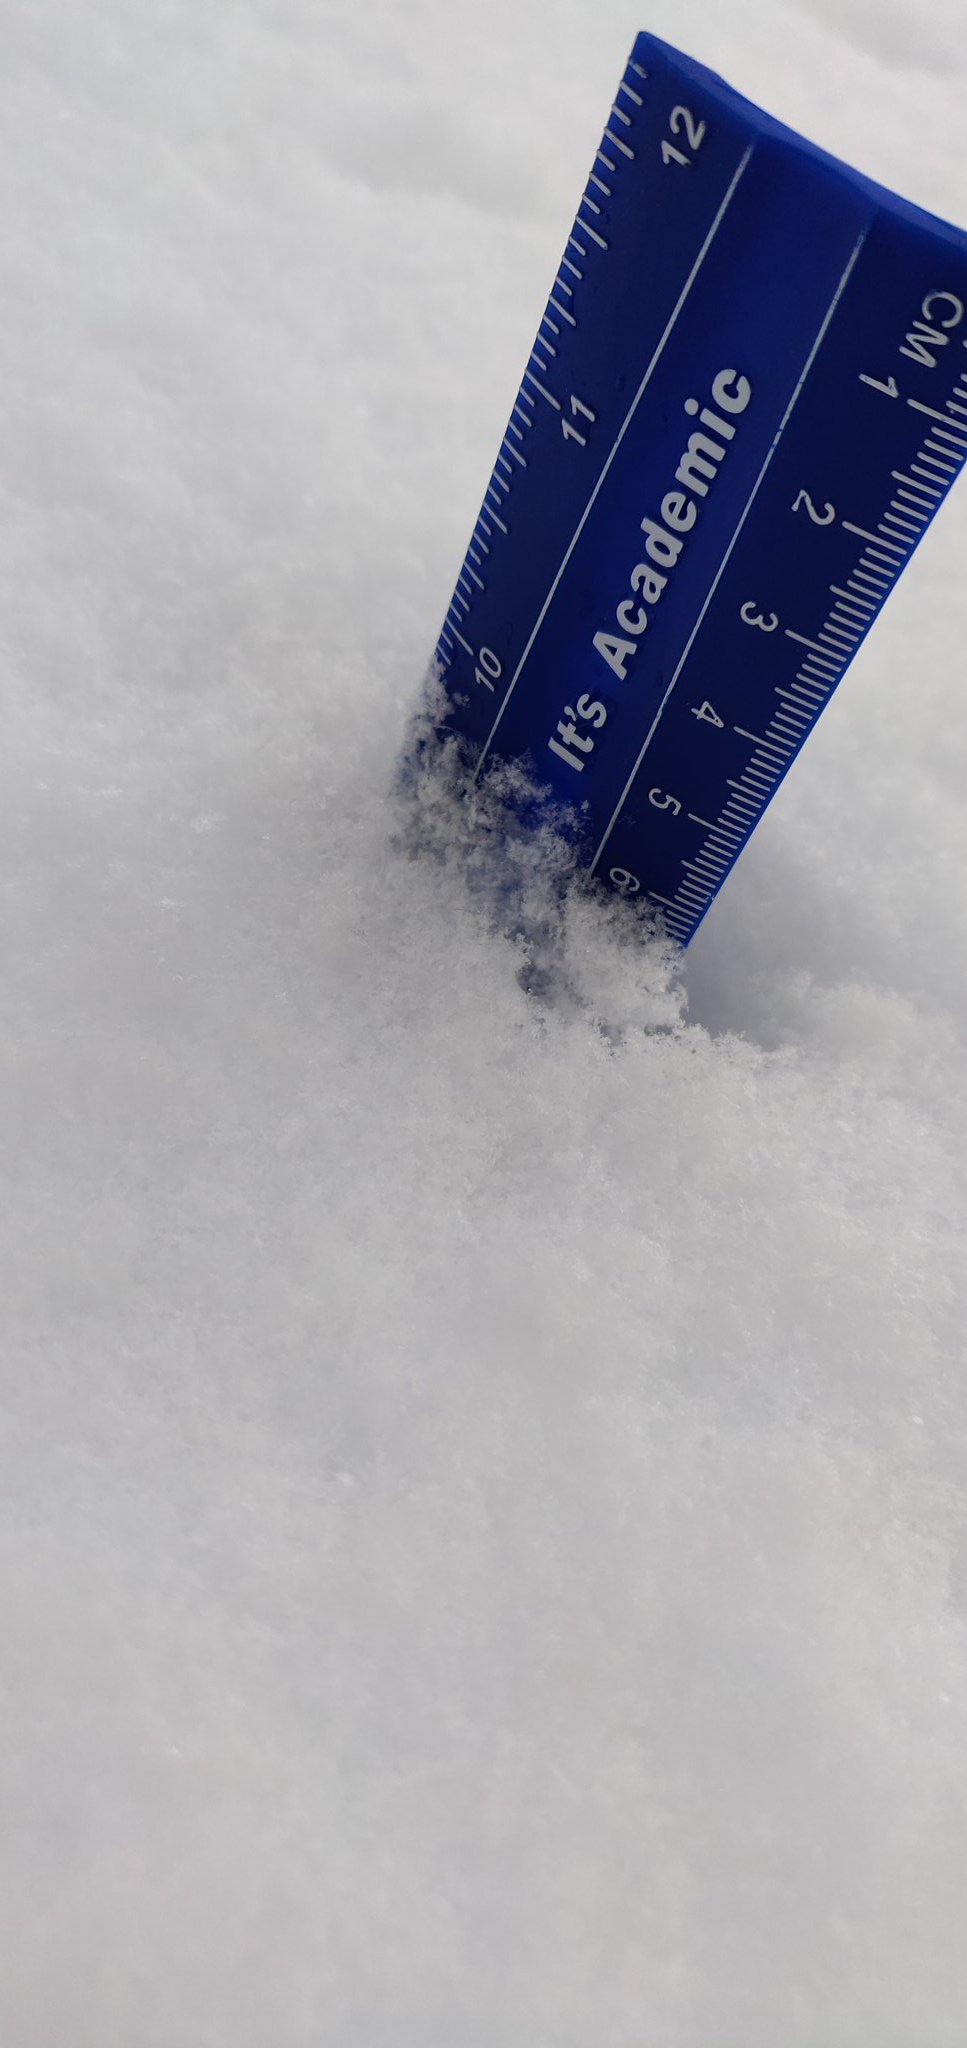
This is a summary of the lake enhanced snowfall event that began November 11th and continued through the early evening hours on November 12th, 2019. Thank you to those who submitted snowfall reports, photos, and videos. |
 Lake effect snow band over NWS Northern Indiana (IWX) on Nov. 12, 2019. |
Snow
The greatest snow totals from the event (see map below) were in areas that received a combination of system snow and lake effect snow. Totals ranged from a maximum of 12 to 18 inches in northwest Indiana and southwest lower Michigan, to lesser amounts of 2 to 6 inches in other portions of northern Indiana and northwest Ohio. The event started out with system snow on the 11th, then quickly transitioned to lake effect snow through the 12th as much colder air infiltrated the region behind the low. Snow showers ended in the early evening hours on November 12th as winds became more southwesterly and drier air moved in, essentially "turning off" the lake effect. For a list of specific snow totals across the area, see the "Storm Reports" tab.
 |
| Storm Total Snow Map from 7 pm EST November 10th, 2019 through 7 pm EST November 12th, 2019. Includes COOP/CoCoRaHS reports only. Spotter reports are not included (NWS Northern Indiana). |
Photos
Here are a few photos from the event. Thank you to those who sent them in-we greatly appreciate it.
 |
 |
 |
 |
| 2N North Webster, IN on Nov 12th (NWS Northern Indiana-IWX) |
Goshen, IN on Nov 12th (PJ Wolf/@GHSWeather) |
1NE Moscow, MI on Nov 11th (Scott Taylor) |
Goshen, IN on Nov 12th (PJ Wolf/@GHSWeather) |
 |
 |
 |
 |
| Near North Webster, IN on Nov 12th (Megan Dodson) |
Goshen, IN on Nov 12th (Nathan S) |
US 30 near Larwill, IN on Nov 12th (Tyler Elzey) |
Goshen, IN on Nov 12th (Nathan S) |
Radar
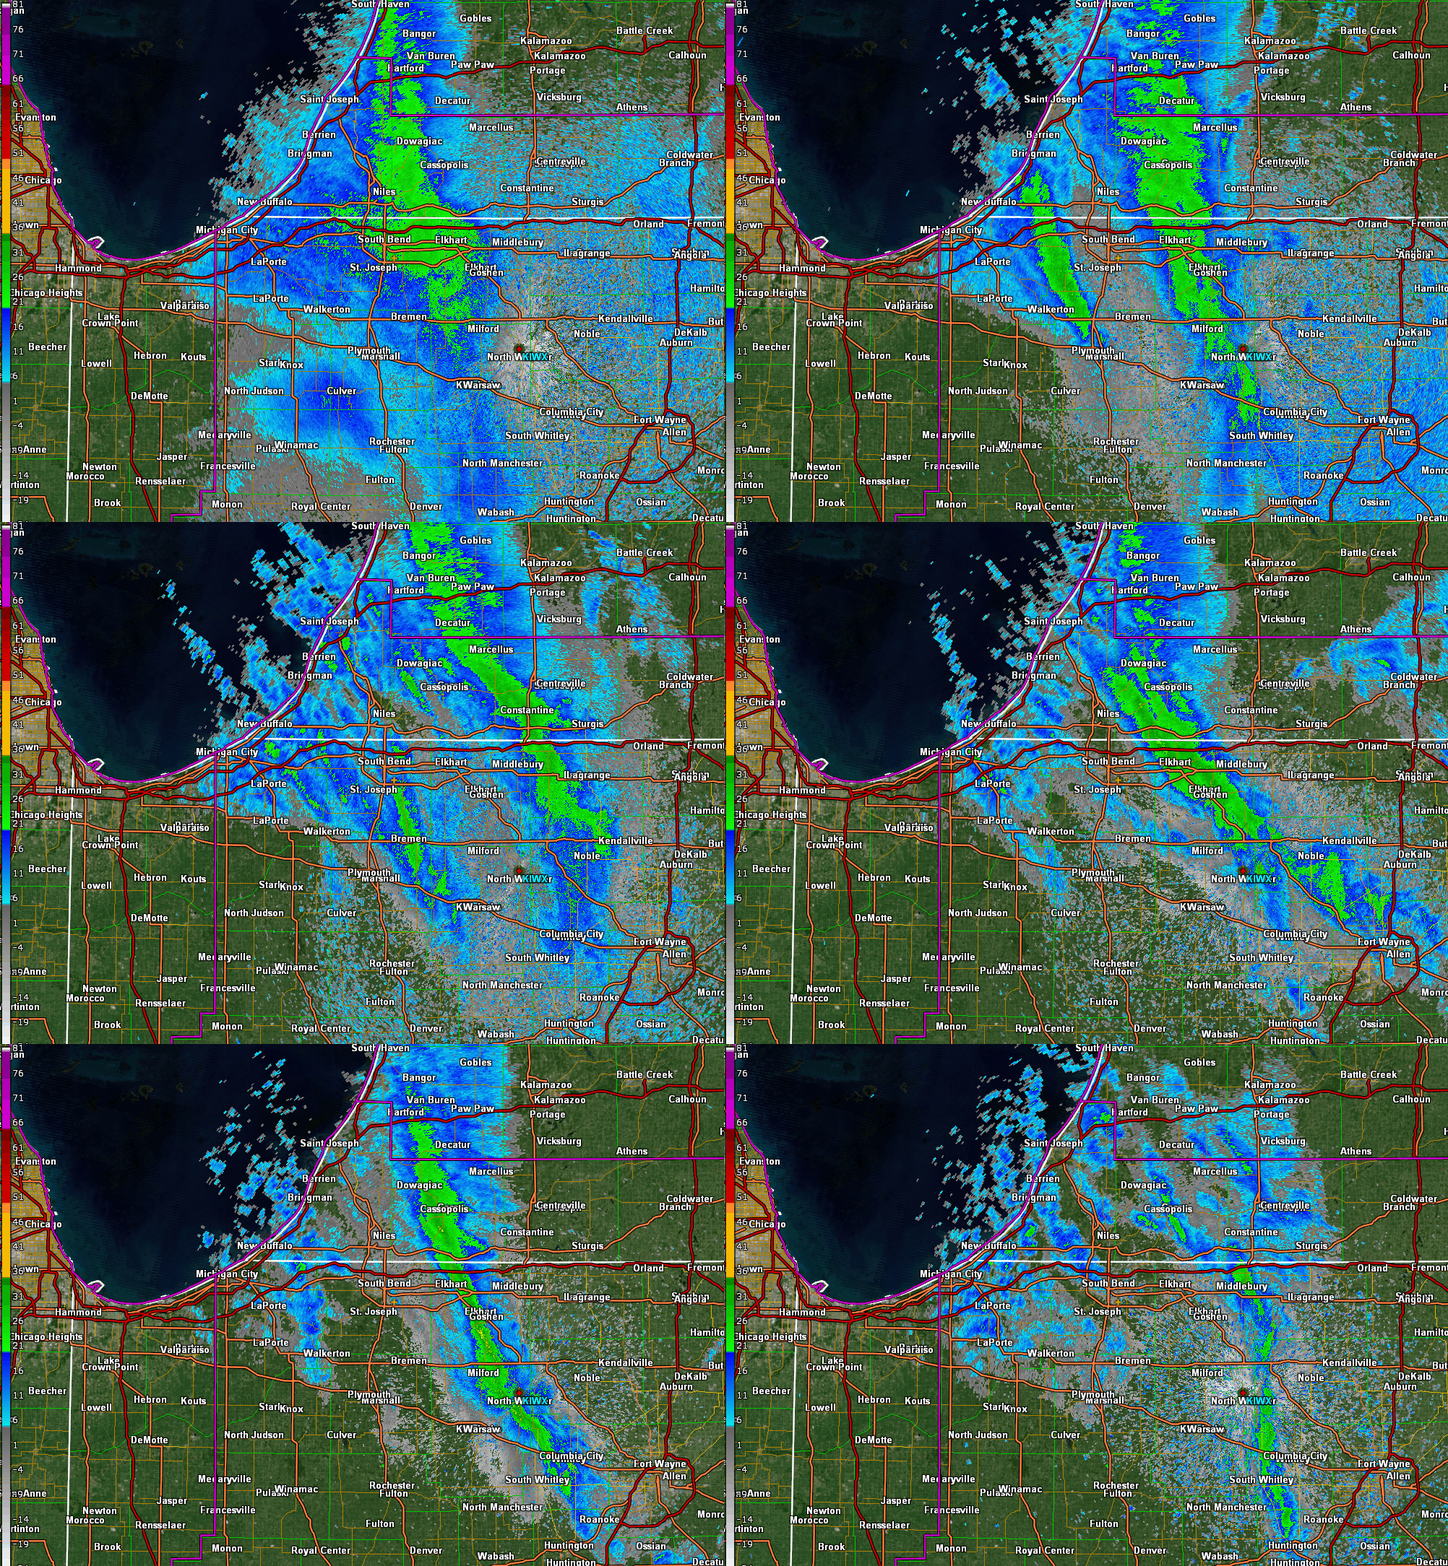
FIrst radar loop shows synoptic snow band evolution that began late Sunday night and continued into Monday afternoon. This snow developed in response to a strong upper level jet streak that dropped south through the Great Lakes and Ohio valley. Strong frontogenesis took shape underneath this upper level jet streak leading to a thermally direct frontal scale circulation late Sunday night and of which continued during the day Monday. Several moderate to occasionally heavy snow bands were observed in radar data and sfc observations as a result of these atmospheric processes.
Second radar loop shows multiple lake snow band evolution Monday night through Tuesday morning. The observed dual/competing bands seen at midnight in northwest Indiana and southwest Michigan are commonly seen in lake effect snow events here and an ever present thorn in meteorologist's sides. Typically the western band dominates but in this case both the background flow and low level thermal trough that arose over Lake Michigan overwhelmed the low level flow and allowed the eastern band to dominate instead.
Thereafter the inland penetration and downwind bend of this intense snow band wrecked an otherwise good forecast over western Elkhart southeast through eastern Kosciusko, western Noble and Whitley counties where storm total snowfall amounts were much higher than predicted. Peak snow intensities in this band reached 3" per hour!
 |
| Synoptic snow band evolution (915 PM EST Sun Nov 10 to 9 PM EST Mon Nov 11) |
 |
| Lake snow band evolution (10 PM EST Mon Nov 11 to 9 AM EST Tue Nov 12) |
Storm Reports
PUBLIC INFORMATION STATEMENT
NATIONAL WEATHER SERVICE NORTHERN INDIANA
240 PM EST TUE NOV 12 2019

...SNOWFALL REPORTS...

LOCATION                     AMOUNT    TIME/DATE       LAT/LON

...INDIANA...

...ALLEN COUNTY...
4 S LEO-CEDARVILLE           3.5 IN    0835 PM 11/11   41.16N/85.02W

...DE KALB COUNTY...
AUBURN                       3.1 IN    0439 PM 11/11   41.37N/85.06W

...ELKHART COUNTY...
DUNLAP                       18.0 IN   1000 AM 11/12   41.64N/85.92W
1 SW GOSHEN                  13.0 IN   0800 AM 11/12   41.57N/85.85W
1 NW WATERFORD MILLS         12.8 IN   1000 AM 11/12   41.55N/85.84W
ELKHART                      12.0 IN   0800 AM 11/12   41.69N/85.97W
2 W GOSHEN                   11.5 IN   1000 AM 11/12   41.58N/85.87W
3 WSW GOSHEN                 10.6 IN   0700 AM 11/12   41.56N/85.89W

...FULTON COUNTY...
AKRON                        3.0 IN    0308 PM 11/11   41.04N/86.03W

...GRANT COUNTY...
MARION                       4.8 IN    1001 PM 11/11   40.55N/85.67W
1 W HOME CORNER              4.3 IN    0837 PM 11/11   40.52N/85.67W
2 W MARION                   4.0 IN    0922 PM 11/11   40.55N/85.70W
GAS CITY                     3.5 IN    0750 AM 11/12   40.49N/85.61W

...HUNTINGTON COUNTY...
1 NNE PLUM CREEK             4.2 IN    0752 AM 11/12   40.76N/85.39W
1 ENE HUNTINGTON             3.0 IN    0803 PM 11/11   40.88N/85.50W
1 ENE HUNTINGTON             2.8 IN    0700 PM 11/11   40.88N/85.50W

...JAY COUNTY...
4 WNW BRYANT                 4.8 IN    0803 PM 11/11   40.55N/85.03W
DUNKIRK                      4.0 IN    0820 PM 11/11   40.38N/85.21W

...KOSCIUSKO COUNTY...
2 N NORTH WEBSTER            9.6 IN    0900 AM 11/12   41.36N/85.70W
LEESBURG                     5.5 IN    0800 AM 11/12   41.33N/85.85W
3 NNW WOOSTER                4.2 IN    0715 AM 11/12   41.24N/85.77W
WINONA LAKE 1.2 E            4.0 IN    0750 PM 11/11   41.22N/85.79W
1 S MONOQUET                 3.0 IN    0730 AM 11/12   41.27N/85.86W

...LA PORTE COUNTY...
2 SW LA PORTE                6.8 IN    0700 AM 11/12   41.59N/86.74W

...LAGRANGE COUNTY...
1 NE LAGRANGE                8.0 IN    0820 PM 11/11   41.66N/85.40W
SHIPSHEWANA                  5.8 IN    0315 PM 11/11   41.68N/85.58W

...MARSHALL COUNTY...
2 NNW TWIN LAKES             6.1 IN    0500 AM 11/12   41.33N/86.37W

...NOBLE COUNTY...
4 NW GREEN CENTER            3.5 IN    0915 AM 11/12   41.34N/85.42W

...ST. JOSEPH COUNTY...
2 ENE GRANGER                12.0 IN   0800 AM 11/12   41.75N/86.10W
2 N TEEGARDEN                9.1 IN    0935 AM 11/12   41.50N/86.38W
GEORGETOWN                   7.0 IN    0600 AM 11/12   41.73N/86.23W
OSCEOLA                      7.0 IN    0700 AM 11/12   41.67N/86.08W
1 NE SOUTH BEND              6.5 IN    0700 AM 11/12   41.68N/86.26W
MISHAWAKA                    6.0 IN    1015 PM 11/11   41.67N/86.17W

...STEUBEN COUNTY...
ORLAND                       6.0 IN    0404 PM 11/11   41.74N/85.17W
2 S CROOKED LAKE             5.0 IN    0735 AM 11/12   41.66N/85.03W
1 E ANGOLA                   4.8 IN    0542 PM 11/11   41.64N/84.99W

...WABASH COUNTY...
WABASH                       3.0 IN    0700 AM 11/12   40.80N/85.83W

...WELLS COUNTY...
1 N BLUFFTON                 4.2 IN    0900 PM 11/11   40.76N/85.17W
2 SSW TOCSIN                 3.2 IN    0100 PM 11/12   40.80N/85.13W

...WHITE COUNTY...
1 S NORWAY                   2.9 IN    0747 AM 11/12   40.76N/86.76W

...WHITLEY COUNTY...
1 SE BIG LAKE                3.5 IN    0800 AM 11/12   41.26N/85.48W

...MICHIGAN...

...BERRIEN COUNTY...
1 WNW BUCHANAN               9.5 IN    0900 AM 11/12   41.84N/86.38W
1 NE SAINT JOSEPH            7.0 IN    0800 AM 11/12   42.10N/86.49W
1 WSW FAIR PLAIN             6.2 IN    0800 AM 11/12   42.07N/86.48W
3 W NILES                    6.2 IN    0700 AM 11/12   41.84N/86.31W

...CASS COUNTY...
1 N DIAMOND LAKE             15.0 IN   0945 AM 11/12   41.91N/85.98W
1 SE BARRON LAKE             11.4 IN   0900 AM 11/12   41.84N/86.17W

...HILLSDALE COUNTY...
1 NE MOSCOW                  9.0 IN    0545 PM 11/11   42.06N/84.50W
HILLSDALE                    7.0 IN    0440 PM 11/11   41.93N/84.64W
JEROME                       6.3 IN    0834 PM 11/11   42.03N/84.47W

...ST. JOSEPH COUNTY...
STURGIS                      8.5 IN    1022 AM 11/12   41.80N/85.42W
2 E CONSTANTINE              7.0 IN    0500 PM 11/11   41.84N/85.63W

...OHIO...

...ALLEN COUNTY...
2 SSE DELPHOS                5.5 IN    0834 AM 11/12   40.82N/84.32W
LIMA                         5.5 IN    0849 AM 11/12   40.75N/84.11W
SPENCERVILLE                 4.0 IN    0200 PM 11/12   40.71N/84.35W

...FULTON COUNTY...
3 NW TEDROW                  4.0 IN    1000 AM 11/12   41.64N/84.25W

...HENRY COUNTY...
1 WNW GALLUP                 3.5 IN    0800 AM 11/12   41.46N/84.16W

...PUTNAM COUNTY...
1 N OTTAWA                   4.8 IN    0735 PM 11/11   41.04N/84.04W
COLUMBUS GROVE               3.8 IN    1010 PM 11/11   40.92N/84.06W

OBSERVATIONS ARE COLLECTED FROM A VARIETY OF SOURCES WITH VARYING
EQUIPMENT AND EXPOSURES. WE THANK ALL VOLUNTEER WEATHER OBSERVERS
FOR THEIR DEDICATION. NOT ALL DATA LISTED ARE CONSIDERED OFFICIAL.
Environment
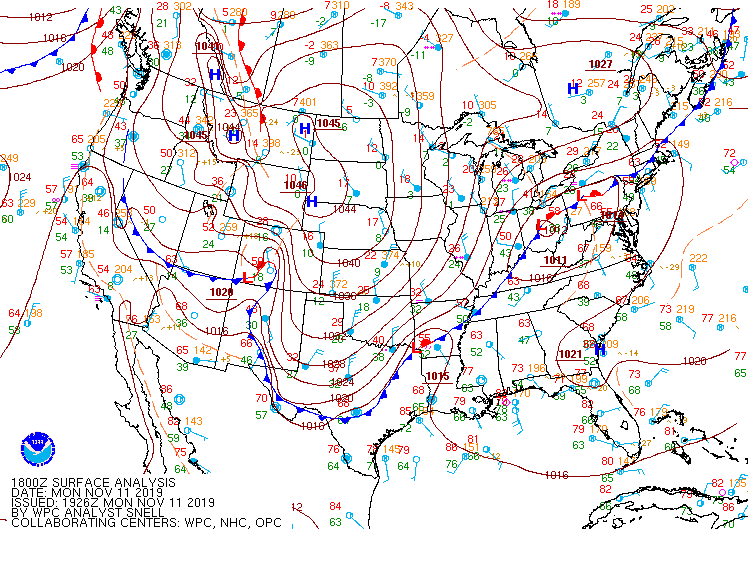
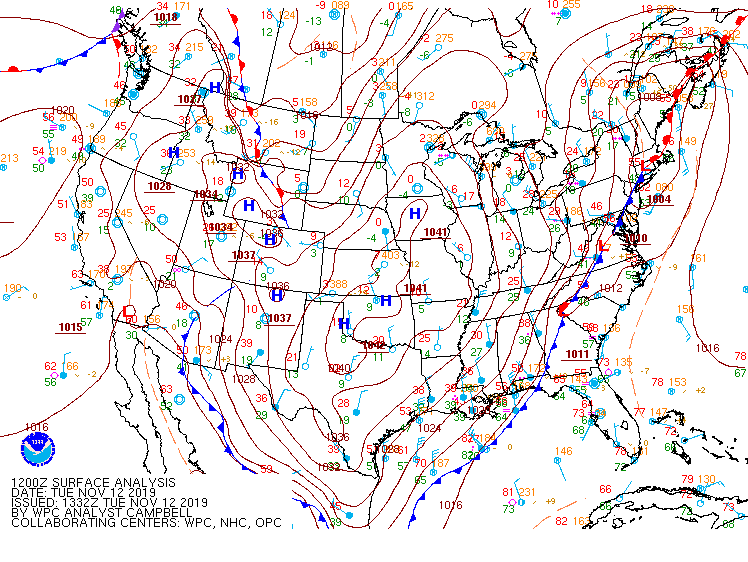
A surface low lifted northeastward from southern Indiana/Kentucky early November 11th, 2019 into the New England States by the morning of November 12th, 2019 (Figures 1-6).
 |
 |
 |
| Figure 1: Surface Map at 7 am EST on Nov 11th, 2019. From WPC Surface Analysis Archive | Figure 2: Surface Map at 2 pm EST on Nov 11th, 2019. From WPC Surface Analysis Archive | Figure 3: Surface Map at 7 pm EST on Nov 11th, 2019. From WPC Surface Analysis Archive |
 |
 |
 |
| Figure 4: Surface Map at 2 am EST on Nov 12th, 2019. From WPC Surface Analysis Archive | Figure 5: Surface Map at 7 am EST on Nov 12th, 2019. From WPC Surface Analysis Archive | Figure 6: Surface Map at 2 pm EST on Nov 12th, 2019. From WPC Surface Analysis Archive |
In the wake of the low pressure system, cold arctic air began to infiltrate the region. Cold air Below are the approximate 850MB temperatures during the event (upper levels of the atmosphere). This cold air helped to kick in lake effect snow for the region, particularly those favored by northwest winds.
 |
 |
 |
| Figure 7: 850mb Temps at 7 am EST Nov 11th, 2019 (NWS WAVE) | Figure 8: 850mb Temps at 7 pm EST Nov 11th, 2019 (NWS WAVE) | Figure 9: 850mb Temps at 7 am EST Nov 12th, 2019 (NWS WAVE) |
 |
| Figure 10. Image depicting how lake effect snow forms. Read more here. |
 |
Media use of NWS Web News Stories is encouraged! Please acknowledge the NWS as the source of any news information accessed from this site. |
 |