A low pressure system moved from the southern Plains into the region on Sunday, January 5th. This combined with an arctic low pressure system dropping south out of Canada on the 4th and 5th to produce widespread heavy snowfall across the area. Total snowfall amounts were generally in the 10-14" range across the area. Higher amounts (12-18") were reported near Lake Michigan due to lake-effect/lake-enhanced snow at the start of and end of the event. Arctic air quickly overtook the area behind the system Sunday night into Tuesday with temperatures well below zero and dangerous wind chills.
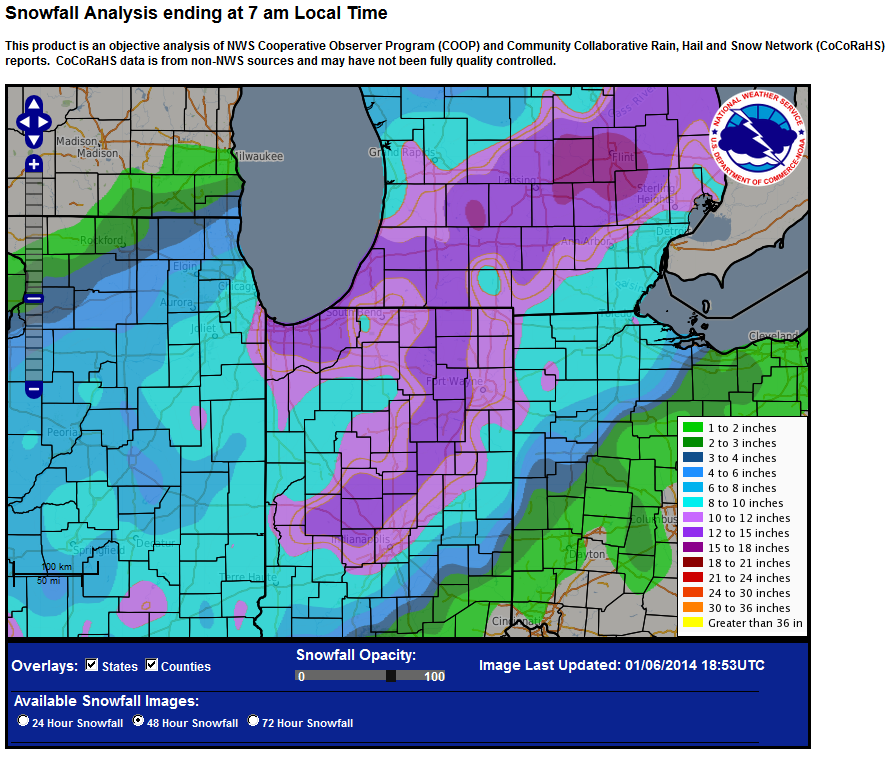

For a table of storm total snowfall reports used to make this map, please see this PDF.
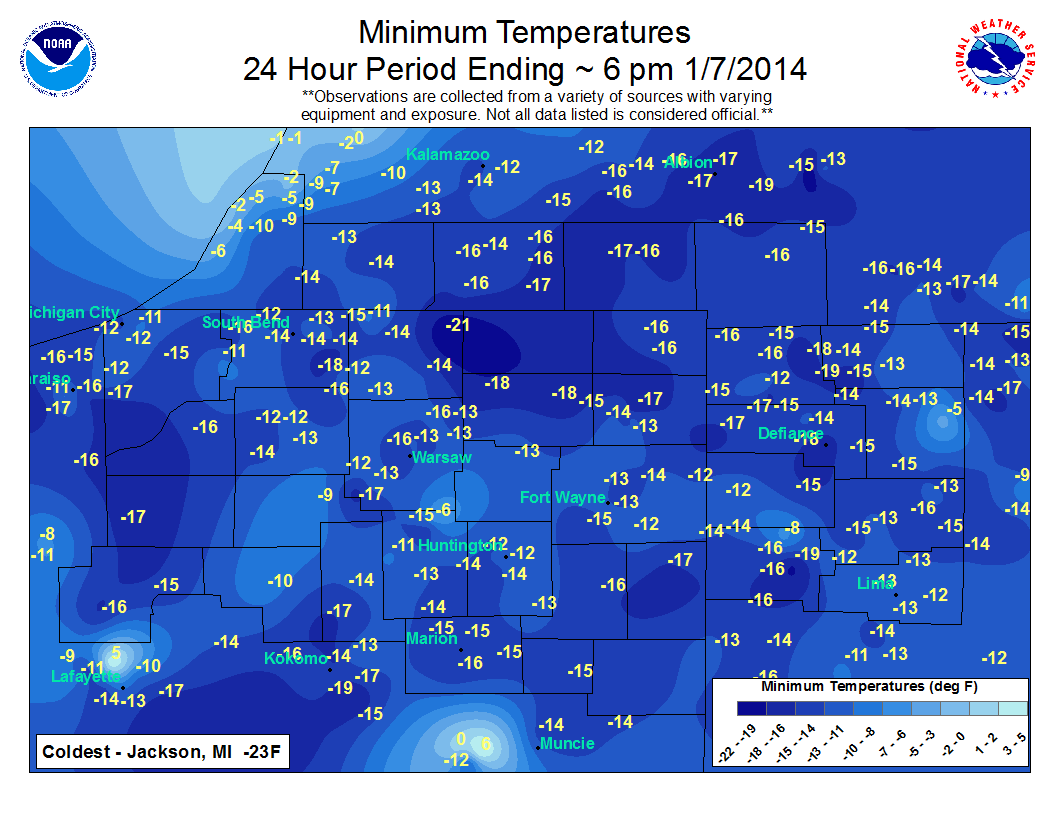
Arctic air from up north spilled into the region as the winter storm system exited the region on Sunday. Temperatures dropped by as much as 40-45 degrees from Sunday Jan 5th into Monday Jan 6th. Temperatures remain much below zero during the day on Monday Jan. 6th into Tuesday Jan 7th, when a slight warming trend began. Some locations even made it above 0 by Tuesday afternoon.
For a more scientific explanation of what caused this outbreak, see this news story from our partners at NOAA.
| Location | Jan 5th High/Low | Jan 6th High/Low | Jan 7th High/Low |
| Benton Harbor | 29 / 26 | 16 / -6 | 2 / -4 |
| Goshen, IN | 31 / 20 | 20 / -14 | 4 / -12 |
| Fort Wayne | 35 / 20 | 20 / -14 | 8 / -15 |
| Lima, OH | 37 / 22 | 22 / -12 | 10 / -11 |
| NWS Office | 31 / 18 | 18 / -16 | 5 / -15 |
| South Bend | 30 / 16 | 16 / -14 | 1 / -13 |
Here's a look at minimum temperatures and coldest wind chill values over a 24 hour period ending ~6pm EST on January 7th, 2014. Temperatures below zero and winds in the 20-30 mph range made for wind chills in the -25 to -45 degree range which can be dangerous and life-threatening!
 |
 |
| List of Minimum Temperatures | List of Coldest Wind Chills |
The chart below is a quick calculator for wind chill values based on temperatures and wind speeds. It also depicts the amount of time it would take for frostbite to occur.

Daily Record Low Temperatures
| Date | Fort Wayne | South Bend |
| Jan 3rd | -6 in 1996 | -11 in 1928 |
| Jan 4th | -12 in 1904 | -10 in 1094 |
| Jan 5th | -14 in 1999 | -16 in 1999 |
| Jan 6th | -14 in 2014 | -16 in 1924 |
| Jan 7th | -15 in 2014 | -16 in 1912 |
| Jan 8th | -17 in 1968 | -16 in 1912 |
| Rank | Fort Wayne | South Bend |
| 1 | -24 (1/12/1918) | -22 (1/20/1943, 1/25/1897) |
| 2 | -22 (1/20/1985) | -21 (3 times last on 1/19/1994) |
| 3 | -21 (1/21/1984 | -20 (4 times last on 1/18/1930) |
| 4 | -19 (1/16/2009, 1/16/1972) | -19 (5 times last on 1/16/2009) |
| 5 | -18 (4 times last on 1/19/2004) | -18 (3 times last on 1/18/1994) |
| Rank | Fort Wayne | South Bend |
| 1 | -11 (1/20/1985) | -8 (2/9/1899) |
| 2 | -9 (12/24/1983) | -7 (12/24/1983) |
| 3 | -7 (1/10/1982) | -6 (1/20/1985) |
| 4 | -6 (1/18/1994, 1/15/1972) | -4 (1/18/1994, 2/10/1899) |
| 5 | -3 (12/25/1983) | -3 (12/25/1983) |
There are only 10 days on record at Fort Wayne and 12 days on record at South Bend where high temperatures failed to hit 0 degrees or warmer. This is for over a hundred years of records!
It's been over 20 years since we've seen wind chill values like the ones experienced from Sunday night into Tuesday! Take a look at some of the coldest wind chills on record (unofficial).
| Rank | South Bend | Fort Wayne |
| 1 | -49°F (1/20/1985) | -51°F (1/20/1985) |
| 2 | -43°F (3 times last on 1/19/1994) | -46°F (1/10/1982) |
| 3 | -42°F (1/10/1982, 1/22/1936) | -45°F (12/24/83, 1/24/63) |
| 4 | -41°F (3 times last on 1/21/1985) | -43°F (4 times last on 1/6/2014) |
| 5 | -40°F (1/19/1940) | -42°F (5 times last on 1/18/1994) |
A strong disturbance dropping out of the Gulf of Alaska and digging southeastward through the southern Rockies on Saturday January 4th 2014 (Fig. 1) would eventually phase with the polar vortex as a record cold arctic airmass surged south into the central and eastern US. Surface low pressure developing over the southern plains Saturday evening (Fig. 4) along the arctic front deepened rapidly as it ejected northeast into the eastern Great Lake by Sunday evening. As a result, strong moisture flux off the Gulf of America in tandem with a plume of sub-tropical moisture out of old Mexico combined to produce a swatch of heavy precipitation across the mid Mississippi and Ohio valleys Sunday as seen in infrared satellite imagery (Fig. 2). Note the rapid cloud top cooling denoted in the yellow and orange colors.
The North American Model (NAM), as shown in Fig. 3, indicated a strong and deep circulation would develop across the arctic front on Sunday in response to coupled upper jet streaks over the western Ohio valley. Deep saturated ascent (lower panels of Fig. 3) was progged to exceed 400 millibars with a significant portion of that within the favored dendritic snow growth zone. In addition, strong mid level frontogenesis (upper right panel of Fig. 3) and a reduction in equivalent potential vorticity (upper left panel of Fig. 3) suggested convection was possible. Fig . 5 is a time height section taken from the NAM model over eastern Whitley county. Vertical motion (Omega) is indicated in cyan, with relative humidity (RH) imaged. Note the depth of the vertical motion collocated with RH near saturation with values > 90% along with the maximum vertical motion centered around -15° C which favors large dendritic snow crystals.
 |
 |
| Fig. 1 Water Vapor Loop | Fig. 2 IR Loop |
 |
 |
| Fig. 3 KBEH-KASW-KFWA Cross Section | Fig. 4 Surface Loop |
 |
| Fig. 5 Time height section for eastern Whitley county |
The initial snowband over northwest Indiana and southwest Michigan early on Sunday morning expanded rapidly southeastward in response to strong moisture advection overtop the arctic front as the upper trough approached. Rapidly cooling cloud tops as seen in Fig. 2 were indicative of heavy snow production as noted in the the NAM model and observed in radar imagery (Fig. 10). Dark blue and purple colors denote intense snowfall rates of 1 to 2" inches/hr respectively. In fact an observer southeast of Columbia City reported as much as 2.5"/hr with numerous reports of sustained 1 to 1.5"/hr snowfall rates.
National Environmental Satellite, Data, and Information Service (NESDIS) issued several satellite precipitation estimate messages including those shown in Figures 6 & 7 which denote nicely the areas of heaviest snowfall. In addition, the Storm Prediction Center issued several mesoscale discussions as shown in Figures 8 & 9.
 |
 |
| Fig. 6 1420Z Satellite Precipitation Estimate Message | Fig. 7 1837Z Satellite Precipitation Estimate Message |
 |
 |
| Fig. 8 1442Z Storm Precition Mesoscale Discussion | Fig. 9 1949Z Storm Precition Mesoscale Discussion |
Below is a radar loop from 0130Z on January 5th through 0630Z on January 6th. A majority of the snow fell in a 8-9 hour period on the night of January 5th.
 |
| Fig. 10 Northern Indiana Doppler Radar Reflectivity Loop |
Here are a few of the pictures submitted to our office from our followers on Facebook and Twitter. A big thank-you to everyone who shared these with us!
 |
 |
 |
 |
 |
 |
 |
 |
 |
 |
 |
 |
 |
 |
 |
 |
||
Published 1/6/2014
CEO/TH

