A large low pressure system and associated warm and cold fronts brought several rounds of heavy rainfall to the local area from April 16th into the morning of April 19th, 2013. This heavy rainfall caused minor to major river flooding and flooding of other low-lying areas, creeks, ditches, and streams. For pictures of flooding submitted by local area residents, check out the our album on our Facebook page!
Below are rainfall maps and a table with regional 4 day totals.
| 4 Day Total Rainfall Ending ~9am April 19, 2013 |
 |
Click on the thumbnail below for larger images.
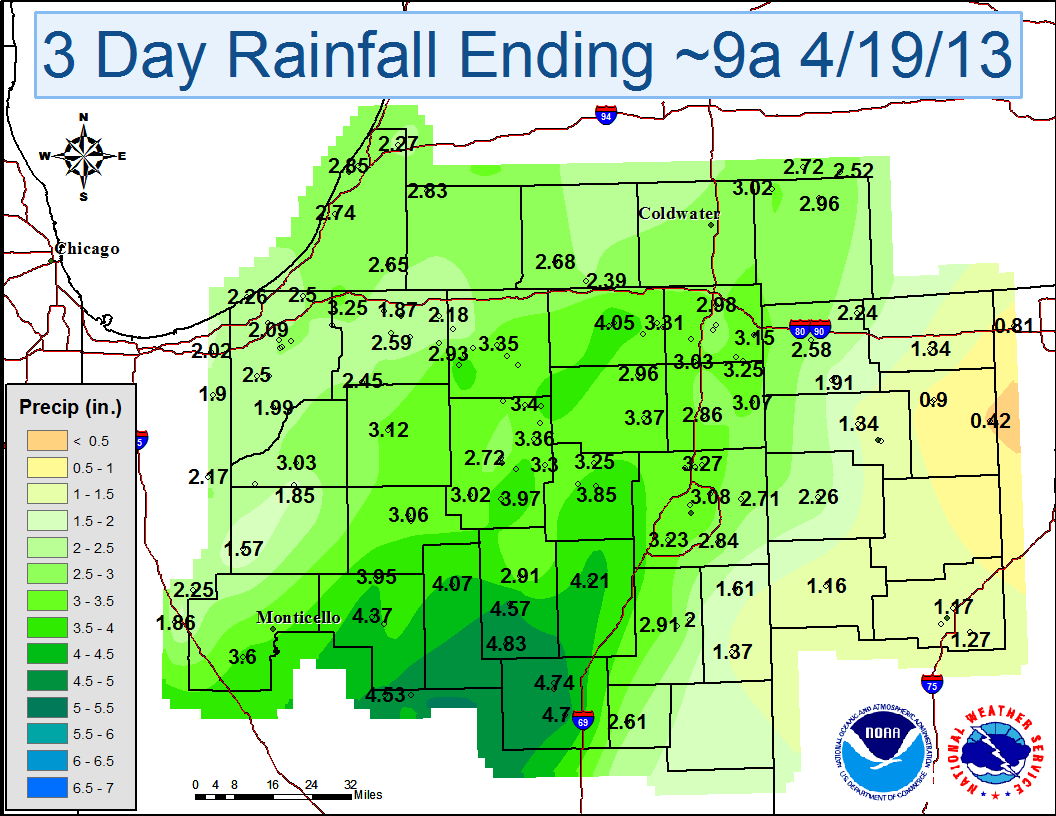
| 3 Day Total Rainfall Ending ~9am April 19, 2013 |
2 Day Total Rainfall |
1 Day Total Rainfall Ending ~9am April 19, 2013 |
 |
 |
 |
| Location | Total Rainfall | Location | Total Rainfall | |
| O'HARE INTERNATIONAL APT | 5.89 | Long Beach 0.7 WSW | 3.35 | |
| GRAND RAPIDS ASOS | 5.65 | Valparaiso 0.9 NNW | 3.35 | |
| INDIANAPOLIS | 5.58 | Kendallville 4.5 NW | 3.32 | |
| Frankfort 4.9 ENE | 5.51 | Valparaiso 5.5 S | 3.32 | |
| Hopkins 0.6 NNE | 5.45 | Valparaiso 4.3 SW | 3.31 | |
| Kokomo 0.6 S | 5.32 | Angola 4.1 N | 3.31 | |
| Kokomo 4.6 ESE | 5.21 | Urbana 0.3 ENE | 3.3 | |
| Wabash 7.3 S | 5.13 | Walkerton 4.1 ENE | 3.27 | |
| Kokomo 6.8 NW | 5.05 | Hudson 0.3 SE | 3.27 | |
| Pine Village 1.8 NW | 4.98 | Valparaiso 7.4 WSW | 3.21 | |
| Atlanta 4.1 ENE | 4.97 | Crown Point 7.8 E | 3.2 | |
| Burlington 5.8 NE | 4.94 | Constantine 1.9 E | 3.2 | |
| West Lafayette 5.1 WSW | 4.85 | Portage 0.9 ESE | 3.19 | |
| Wabash 1.2 NNW | 4.82 | Valparaiso 5.7 WSW | 3.19 | |
| Atlanta 4.4 W | 4.8 | Rensselaer 1.9 SSW | 3.1 | |
| MARION 2 N | 4.8 | (KB9GPW)North Judson 3.9 SW | 3.1 | |
| Gas City 0.9 SW | 4.73 | Jonesville 5.9 ENE | 3.1 | |
| Logansport 2.2 NNW | 4.72 | Angola 1.2 S | 3.09 | |
| LAFAYETTE ASOS | 4.72 | Hebron 3.7 NE | 3.08 | |
| Walker 3.2 W | 4.71 | Rensselaer 6.2 SE | 3.07 | |
| HOLLAND ASOS | 4.7 | Valparaiso 6.2 NW | 3.06 | |
| Cecil M. Harden Lake | 4.59 | Chesterton 1.4 ENE | 3.04 | |
| Lafayette 2.2 S | 4.59 | Hanover 3.8 W | 3.02 | |
| Claypool 1.2 E | 4.58 | Auburn 0.8 NE | 3.01 | |
| New Carlisle 0.3 WNW | 4.57 | BLUFFTON 1 N | 3 | |
| Denver 1.3 NE | 4.56 | Jackson 3.2 W | 3 | |
| Attica 3.4 SSW | 4.54 | Mishawaka 5.9 SE | 2.99 | |
| Huntington 0.3 W | 4.53 | Wheatfield 1.8 ENE | 2.98 | |
| Wakarusa 0.3 WSW | 4.47 | De Motte 4.1 SW | 2.96 | |
| LaGrange 0.2 NNE | 4.46 | Hanna 1.1 E | 2.95 | |
| Kokomo 4.3 SW | 4.41 | Sturgis 4.5 WSW | 2.94 | |
| Attica 4.2 NNW | 4.35 | LANSING ASOS | 2.92 | |
| Columbia City 0.5 NNE | 4.31 | Wheatfield 4.6 W | 2.91 | |
| LaGrange 1.3 ENE | 4.29 | Fort Wayne 9.1 SE | 2.88 | |
| PERRYSVILLE 4 WNW | 4.27 | Hebron 1.2 NW | 2.88 | |
| Lafayette 2.2 NE | 4.25 | Portage 2.8 E | 2.87 | |
| Otterbein 2.3 SE | 4.18 | 2.86 | ||
| La Porte 1.2 WNW | 4.12 | Horton 4.6 SE | 2.86 | |
| CHALMERS 5 W | 4.1 | Mishawaka 3.9 ENE | 2.83 | |
| (WA9RON)La Porte 1.3 SSW | 4.09 | MONTPELIER 0.6 NW | 2.83 | |
| Paw Paw 3.6 NNE | 4.08 | Porter 0.6 S | 2.82 | |
| Logansport 1.7 ENE | 4.07 | SOUTH BEND ASOS | 2.82 | |
| Winona Lake 0.9 ENE | 4.06 | KALAMAZOO ASOS | 2.8 | |
| Syracuse 3.0 ESE | 4.04 | MILWAUKEE | 2.77 | |
| Huntertown 2.6 ESE | 4.02 | South Bend 4.6 SE | 2.74 | |
| Woodburn 2.8 WSW | 2.72 | |||
| La Porte 1.6 SW | 4 | Anderson 2.5 ESE | 2.7 | |
| Hartford City 0.2 NNW (WB9HLA) | 2.61 | |||
| (W9OPR)Wheatfield 1.4 ENE | 2.6 | |||
| BROOKLYN 2 ENE | 2.59 | |||
| ALLENDALE 3 ESE | 3.98 | Dexter 0.3 ENE | 2.53 | |
| Fort Wayne 2.6 NE | 3.98 | Remington 0.3 N | 2.5 | |
| Fort Wayne 9.9 NNE | 3.97 | Alvordton 0.5 E | 2.5 | |
| Leo 2.2 NW | 3.95 | North Judson 5.7 ESE | 2.45 | |
| North Webster 2.3 N | 3.93 | (W9AL)North Judson 5.7 ESE | 2.45 | |
| La Porte 1.3 ENE | 3.93 | PAULDING | 2.43 | |
| Goshen 1.9 NW | 3.92 | Elkhart 4.8 SW | 2.39 | |
| Syracuse 0.9 SW | 3.91 | Bloomington | 2.33 | |
| Valparaiso 1.4 ENE | 3.9 | Ann Arbor 3.1 SE | 2.31 | |
| ROCHESTER | 3.88 | Bryan 1.3 E | 2.31 | |
| Valparaiso 0.4 SSW | 3.84 | FRANCESVILLE 2 SW | 2.3 | |
| (KC9YKU)New Carlisle 7.3 WNW | 3.8 | Yorktown 1.1 NNW | 2.29 | |
| Goshen 1.4 SSE | 3.78 | BATTLE CREEK ASOS | 2.27 | |
| Rensselaer 5.2 NW | 3.77 | BRYAN OHIO 2 SE | 2.23 | |
| Columbia City 3.6 WNW | 3.77 | MUNCIE ASOS | 2.21 | |
| Dowagiac 5.3 NNW | 3.77 | BROOKVILLE DAM | 2.19 | |
| Westville 4.7 ESE | 3.76 | Eaton 4.0 SW | 2.15 | |
| Valparaiso 0.6 SE | 3.76 | Ann Arbor 2.1 WNW | 2.15 | |
| Avilla 2.4 W | 3.75 | Dexter 2.2 SE | 2.14 | |
| LaGrange 7.2 ESE | 3.74 | DETROIT INT AIRPORT | 2.12 | |
| Fort Wayne 7.0 NE | 3.73 | Adrian 6.4 ENE | 2.04 | |
| Leesburg 6.7 ESE | 3.71 | Adrian 6.4 ENE | 2.04 | |
| Orland 6.6 SSW | 3.67 | Battle Creek 0.5 N | 2.03 | |
| New Carlisle 3.3 SSW | 3.67 | Bluffton 3.0 ENE | 2.02 | |
| Knox 4.1 SW | 3.67 | Plymouth 5.4 W | 2 | |
| Niles 2.7 W | 3.67 | Muncie 1.2 SE | 1.99 | |
| Columbia City 5.4 N | 3.66 | Saline 3.8 SSW | 1.89 | |
| BLOOMINGDALE | 3.63 | DEFIANCE ASOS | 1.86 | |
| LaGrange 9.9 E | 3.61 | Russia 1.3 NNE | 1.8 | |
| (N9ROM)Trail Creek 4.5 ESE | 3.59 | Piqua 0.8 SSE | 1.76 | |
| Stevensville 1.7 SSE | 3.59 | Fort Loramie 0.8 NNW | 1.75 | |
| Valparaiso 1.8 NW | 3.58 | Wauseon 0.2 SE | 1.67 | |
| GOSHEN ASOS | 3.57 | Houston 1.3 NNE | 1.65 | |
| Rochester 2.4 NW | 3.57 | Fort Loramie 2.1 WNW | 1.64 | |
| Valparaiso 1.8 N | 3.57 | Carleton 2.5 S | 1.57 | |
| PLYMOUTH | 3.57 | Defiance 0.9 E | 1.51 | |
| Wakarusa 2.4 NNE | 3.55 | Sylvania 1.4 WNW | 1.46 | |
| Hudson 4.6 N | 3.55 | Bradford 2.3 NW | 1.36 | |
| Milford 0.9 N | 3.54 | Napoleon 0.3 NNW | 1.32 | |
| Chesterton 3.0 ESE | 3.54 | DAYTON OHIO | 1.31 | |
| Hamilton 1.7 E | 3.53 | LIMA ASOS | 1.27 | |
| BUTLER 1 SE | 3.5 | TOLEDO AIRPORT | 1.23 | |
| Kingsbury 4.6 WSW | 3.49 | VAN WERT 1 S | 1.21 | |
| South Bend 3.3 SSW | 3.49 | Monroe 3.1 SW | 1.2 | |
| Hamilton 0.7 N | 3.49 | Napoleon 0.6 WSW | 1.17 | |
| FORT WAYNE ASOS | 3.48 | New Albany 2.8 SSE | 0.79 | |
| Angola 8.7 ESE | 3.47 | Perrysburg 1.6 WSW | 0.77 | |
| Mentone 3.6 SE | 3.45 | FINDLAY ASOS | 0.72 | |
| Goshen 6.7 W | 3.43 | Galloway 3.1 N | 0.68 | |
| Litchfield 0.3 ENE | 3.41 | Marble Cliff 1.1 WNW | 0.63 | |
| ANGOLA | 3.39 | Marion 4.2 SSE | 0.63 | |
| Valparaiso 4.6 NNE | 3.38 | Morral 0.1 S | 0.62 | |
| MUSKEGON ASOS | 3.38 | Perrysburg 6.0 SE | 0.59 | |
| BENTON HARBOR ASOS | 3.37 | Columbus 9.3 NNE | 0.57 | |
| Wheatfield 2.8 S | 3.35 | McClure 3.4 SSE | 0.57 | |
| Pierceton 2.5 NNE | 3.35 | Put-In-Bay 1.1 SSW | 0.47 |
The amount of rainfall received over the past week is much above normal. This is shown in the image below.

Meteorology
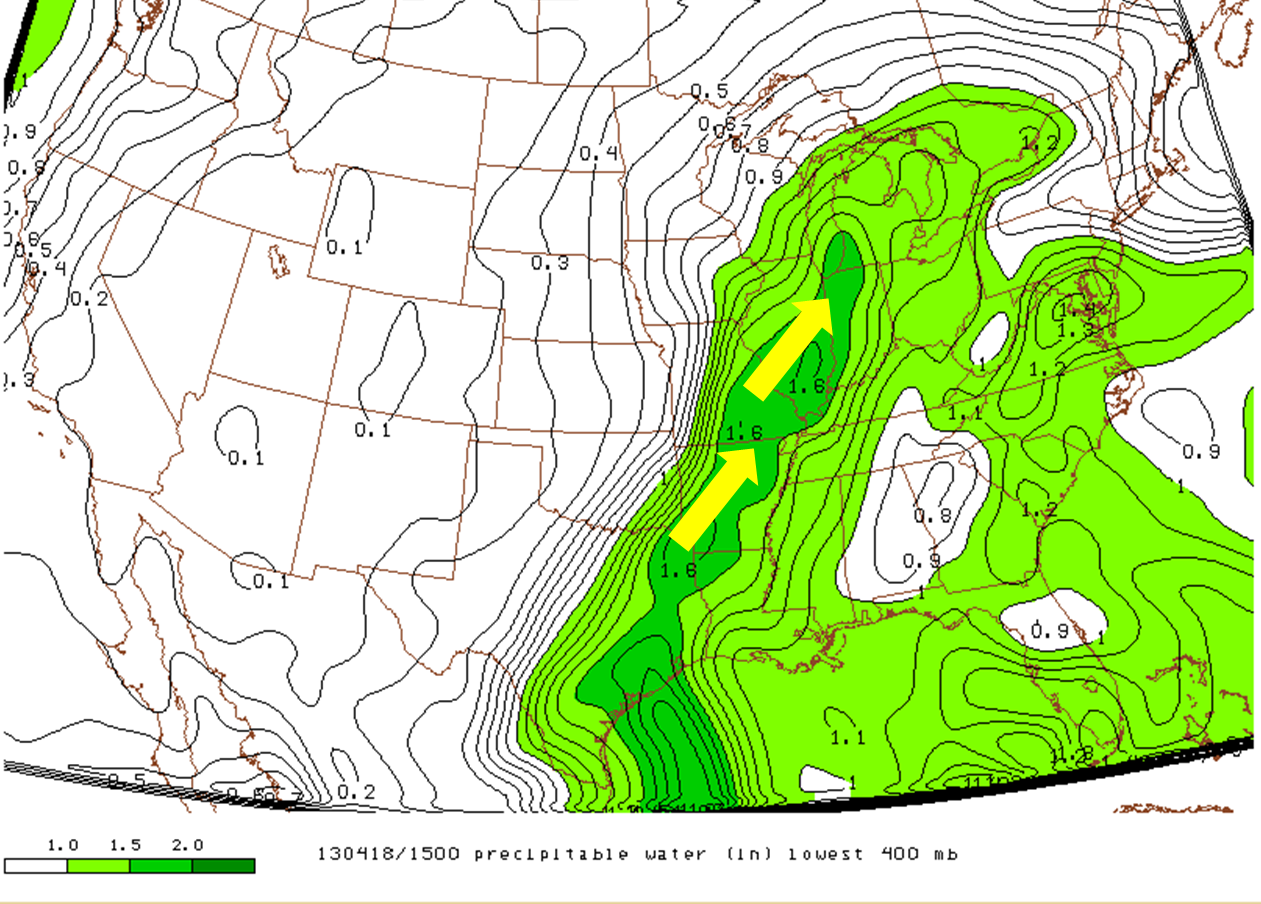
This event was produced by a classic meteorological setup for heavy rainfall. In order to have the ideal setup for a heavy rainfall event, you need several factors in place: a strong frontal system, high moisture content in the airmass (called precipitable water or PWAT), a steady replenishment of this moisture in the atmosphere, focus in one area for a long duration, and high rainfall rates. All of these were established over the local area (and portions of southern WI, northern IL, central Michigan, and central to northern Indiana) from the afternoon on the 17th through the morning of the 19th. A warm front slowly moved north and into the local area by the 18th. This allowed for warm, moist southerly flow to move into the area with precipitable water values near the maximum percentile for this time of year. This is shown in the 2 images below (click on the thumbnail for the larger image). A strong cold front then tracked across the area late in the day on the 18th into the morning of the 19th. Convergence along the cold front enhanced upward, rising motion which allowed for additional thunderstorms and a large area of rain.
 |
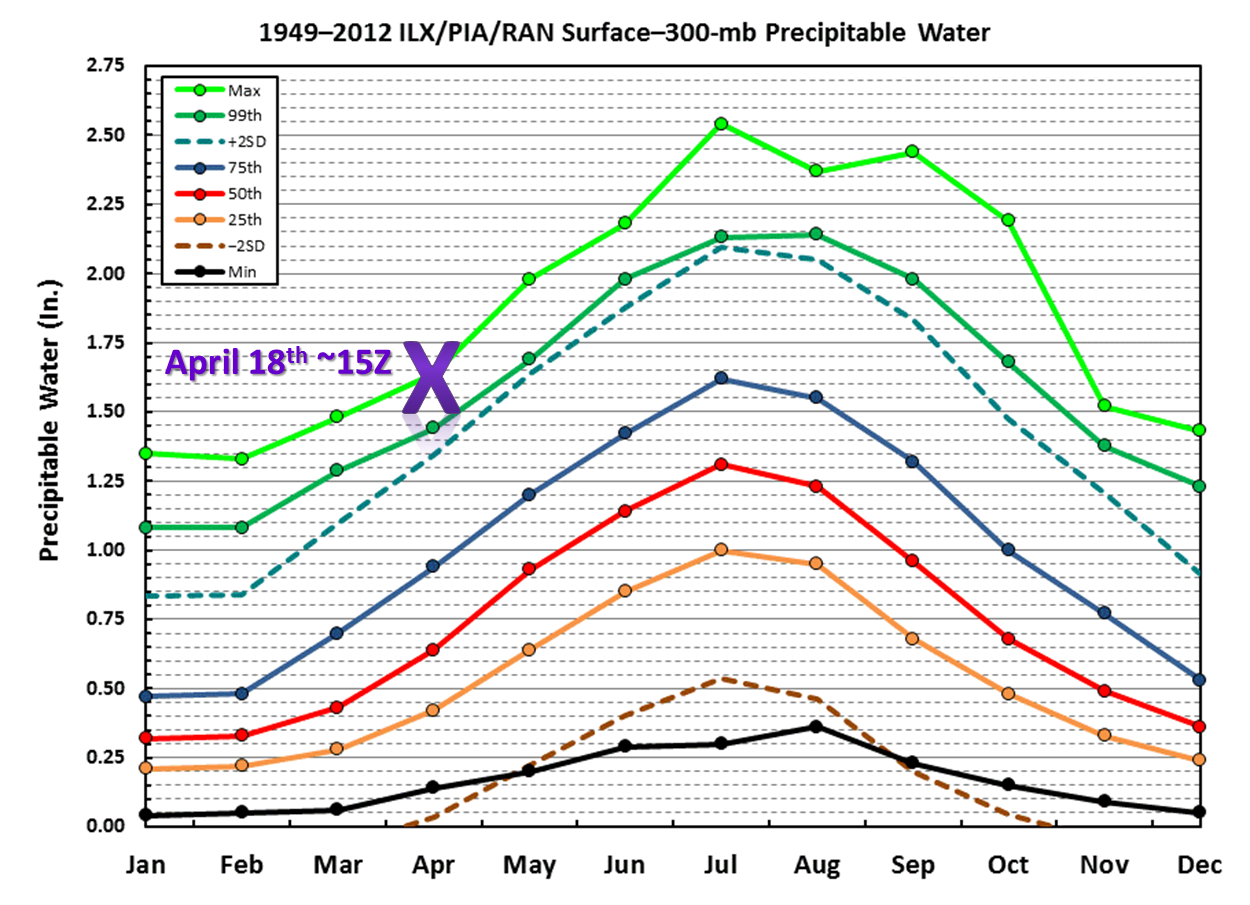 |
| This image shows precipitable water (a measure of the amount of moisture in the air) on the afternoon of April 18th. Southerly flow transported Gulf moisture toward the region. | This image shows the climatology for preciptable water values at Lincoln, IL. The X on the image marks where values where on the afternoon on April 18th (shown in the left image). PWAT values on this day were near the max percentile! |
The loop below shows the surface analysis and associated fronts overlaid with radar images. As you can see, there was a prolonged period of heavy rainfall over the area which allowed for high rainfall totals and widespread flooding.
CEO

