Just How Different was March 2013 from March 2012?
Below average temperatures across the local area lasted for almost the entire month of March 2013, outside of a few days. This was in stark contrast to March 2012, when much above average temperatures resided over the area and numerous all-time temperatures records were set. For a look back at all the records set during March 2012, see our news story here.
The chart below shows the climate report for March 2013. For more in-depth summaries, click here for Fort Wayne and here for South Bend.
735
CXUS53 KIWX 011137
CLMFWA
INDCLMFWA 000
TTAA00 KIWX 010802
CLIMATE REPORT
NATIONAL WEATHER SERVICE NORTHERN INDIANA
401 AM EDT MON APR 1 2013
...................................
...THE FORT WAYNE CLIMATE SUMMARY FOR THE MONTH OF MARCH 2013...
CLIMATE NORMAL PERIOD 1981 TO 2010
CLIMATE RECORD PERIOD 1897 TO 2013
WEATHER OBSERVED NORMAL DEPART LAST YEAR'S
VALUE DATE(S) VALUE FROM VALUE DATE(S)
NORMAL
................................................................
TEMPERATURE (F)
RECORD
HIGH 87 03/21/2012
LOW -10 03/01/1967
HIGHEST 60 03/31 MM MM 87 03/21
LOWEST 11 03/21 MM MM 21 03/10
AVG. MAXIMUM 40.2 48.0 -7.8 64.1
AVG. MINIMUM 25.9 28.7 -2.8 41.1
MEAN 33.1 38.4 -5.3
DAYS MAX >= 90 0 0.0 0.0 0
DAYS MAX <= 32 4 2.7 1.3 0
DAYS MIN <= 32 28 20.0 8.0 11
DAYS MIN <= 0 0 0.0 0.0 0
PRECIPITATION (INCHES)
RECORD
MAXIMUM 7.10 1913
MINIMUM 0.48 2001
TOTALS 2.34 2.71 -0.37 2.90
DAILY AVG. 0.08 0.09 -0.01 0.09
DAYS >= .01 13 12.2 0.8 7
DAYS >= .10 6 6.3 -0.3 5
DAYS >= .50 1 1.7 -0.7 2
DAYS >= 1.00 0 0.4 -0.4 1
GREATEST
24 HR. TOTAL 0.88 03/05 TO 03/05
SNOWFALL (INCHES)
RECORDS
TOTAL 19.5 1964
0
-26215
TOTALS 18.1 4.1 14.0 0.3
SINCE 7/1 38.5 32.5 6.0 32.2
SNOWDEPTH AVG. 1 MM MM 0
DAYS >= 1.0 4 1.3 2.7 0
GREATEST
SNOW DEPTH 10 03/06 -1
24 HR TOTAL 9.0 03/05 TO 03/05
DEGREE_DAYS
HEATING TOTAL 982 826 156 404
SINCE 7/1 5373 5424 -51 4389
COOLING TOTAL 0 0 0 27
SINCE 1/1 0 0 0 27
.................................................................
WIND (MPH)
AVERAGE WIND SPEED 10.2
HIGHEST WIND SPEED/DIRECTION 36/070 DATE 03/24
HIGHEST GUST SPEED/DIRECTION 45/270 DATE 03/19
SKY COVER
POSSIBLE SUNSHINE (PERCENT) MM
AVERAGE SKY COVER 0.70
NUMBER OF DAYS FAIR 3
NUMBER OF DAYS PC 11
NUMBER OF DAYS CLOUDY 17
AVERAGE RH (PERCENT) 73
WEATHER CONDITIONS. NUMBER OF DAYS WITH
THUNDERSTORM 0 MIXED PRECIP 1
HEAVY RAIN 0 RAIN 1
LIGHT RAIN 6 FREEZING RAIN 0
LT FREEZING RAIN 2 HAIL 0
HEAVY SNOW 1 SNOW 6
LIGHT SNOW 16 SLEET 2
FOG 21 FOG W/VIS <= 1/4 MILE 4
HAZE 1
- INDICATES NEGATIVE NUMBERS.
R INDICATES RECORD WAS SET OR TIED.
MM INDICATES DATA IS MISSING.
T INDICATES TRACE AMOUNT.
&&
...WHAT A DIFFERENCE A YEAR MAKES...
MARCH 2013 WAS A COLD MONTH WITH ABOVE NORMAL SNOWFALL AND BELOW
NORMAL PRECIPITATION. THIS WAS A DRASTIC DIFFERENCE FROM MARCH 2012
WHICH SAW NUMEROUS RECORDS FOR WARMTH BROKEN...INCLUDING RECORD HIGH
TEMPERATURES ON NINE CONSECUTIVE DAYS AND TEN CONSECUTIVE DAYS WITH
HIGH TEMPERATURES AT OR ABOVE 70. MARCH 2013 HAD JUST A SINGLE DAY
WITH A HIGH TEMPERATURE OF 60 DEGREES...AND THAT WAS ON THE LAST DAY
OF THE MONTH. THERE WERE ONLY 3 DAYS WITH AN AVERAGE TEMPERATURE
ABOVE NORMAL AND A STREAK OF 15 STRAIGHT DAYS WITH AN AVERAGE
TEMPERATURE BELOW NORMAL.
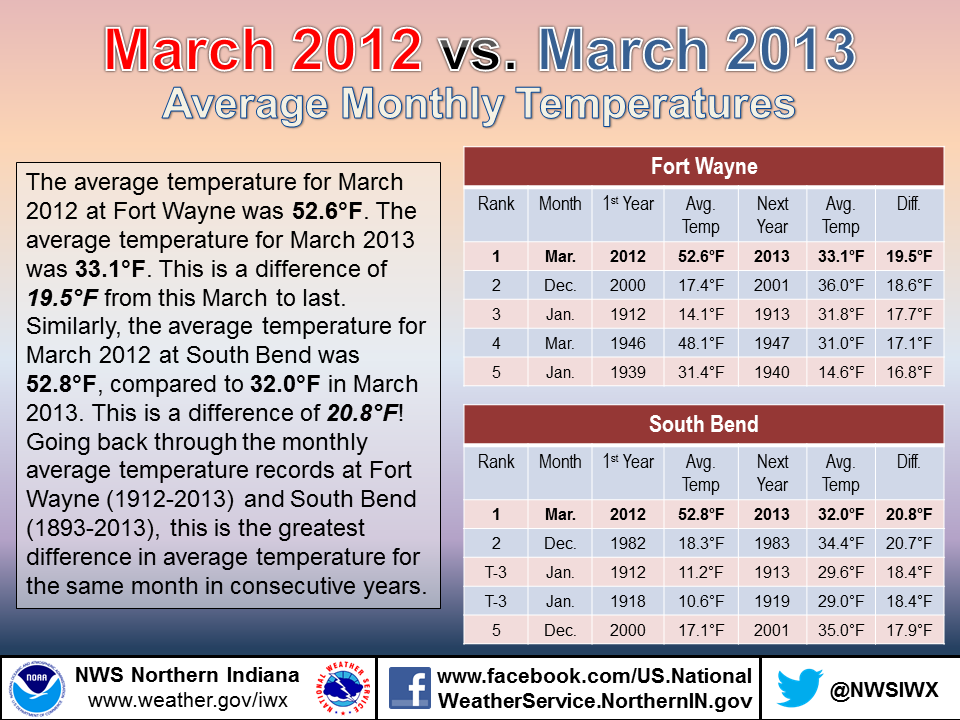
THE AVERAGE MONTHLY TEMPERATURE THIS MARCH WAS 33.1...5.3 DEGREES
BELOW NORMAL. THIS RANKED AS THE 18TH COLDEST MARCH ON RECORD. IN
CONTRAST...MARCH 2012 WAS THE WARMEST MARCH ON RECORD WITH A MONTHLY
AVERAGE TEMPERATURE OF 52.6 DEGREES. THIS DIFFERENCE OF 19.5 DEGREES
BETWEEN MONTHLY AVERAGE TEMPERATURES IN MARCH 2012 VS 2013 IS THE
GREATEST DIFFERENCE BETWEEN ANY MONTHLY AVERAGE TEMPERATURE FOR THE
SAME MONTH IN CONSECUTIVE YEARS.
THE HIGHEST TEMPERATURE THIS MONTH WAS 60 ON THE 31ST AND THE
COLDEST TEMPERATURE WAS 11 ON THE 21ST. IN MARCH 2012...THE HIGHEST
TEMPERATURE WAS A RECORD 87 DEGREES.
PRECIPITATION FOR THE MONTH WAS 2.34 INCHES...0.37 INCHES BELOW
NORMAL. THIS RANKED AS THE 36TH DRIEST MARCH SINCE 1912.
IRONICALLY...MORE PRECIPITATION FELL IN MARCH 2012...2.90 INCHES...
WHEN IT WAS WARMER AND CONSIDERED BY MANY TO BE MORE PLEASANT
COMPARED TO THIS MARCH. MEASURABLE PRECIPITATION THIS MONTH WAS
RECORDED ON 13 DAYS WHILE A TRACE OR MORE WAS RECORDED ON 20 DAYS.
DESPITE NEARLY 70 PERCENT OF THE DAYS HAVING SOME FORM OF
PRECIPITATION...ONLY 6 DAYS HAD A TENTH OR MORE. THE HIGHEST DAILY
PRECIPITATION TOTAL WAS 0.88 INCHES ON THE 5TH.
EVEN THOUGH PRECIPITATION WAS BELOW NORMAL...SNOWFALL WAS WELL ABOVE
NORMAL THIS MONTH. A TOTAL OF 18.1 INCHES WAS RECORDED...14.0 INCHES
ABOVE NORMAL. THIS RANKED AS THE 3RD SNOWIEST MARCH SINCE 1912. UP
UNTIL THIS MONTH...THE TOTAL SNOWFALL FOR THE SEASON WAS 20.4
INCHES...8 INCHES BELOW NORMAL. SO WHILE THE OFFICIAL SNOWFALL FOR
THE 3 WINTER MONTHS WAS BELOW NORMAL...SNOWFALL FOR THE ENTIRE
WINTER SEASON WILL BE ABOVE NORMAL.
595
CXUS53 KIWX 011138
CLMSBN

INDCLMSBN 000
TTAA00 KIWX 010802


CLIMATE REPORT
NATIONAL WEATHER SERVICE NORTHERN INDIANA
401 AM EDT MON APR 1 2013

...................................

...THE SOUTH BEND CLIMATE SUMMARY FOR THE MONTH OF MARCH 2013...

CLIMATE NORMAL PERIOD 1981 TO 2010
CLIMATE RECORD PERIOD 1893 TO 2013

WEATHER         OBSERVED          NORMAL  DEPART  LAST YEAR'S
                 VALUE   DATE(S)  VALUE   FROM    VALUE  DATE(S)
                                          NORMAL
................................................................
TEMPERATURE (F)
RECORD
 HIGH              85   03/21/2012
                        03/31/1981
                        07/14/1936
 LOW              -13   03/08/1943
HIGHEST            59   03/31        MM      MM       85  03/21
                        03/10
LOWEST             13   03/08        MM      MM       20  03/05
AVG. MAXIMUM     39.8              46.5    -6.7     62.7
AVG. MINIMUM     24.2              28.4    -4.2     42.8
MEAN             32.0              37.5    -5.5
DAYS MAX >= 90      0               0.0     0.0        0
DAYS MAX <= 32      5               3.4     1.6        0
DAYS MIN <= 32     28              20.3     7.7        7
DAYS MIN <= 0       0               0.1    -0.1        0

PRECIPITATION (INCHES)
RECORD
 MAXIMUM         7.96   1976
 MINIMUM         0.54   1958
TOTALS           1.26              2.42   -1.16     1.67
DAILY AVG.       0.04              0.08   -0.04     0.05
DAYS >= .01        12              12.7    -0.7       12
DAYS >= .10         2               6.3    -4.3        5
DAYS >= .50         1               1.3    -0.3        0
DAYS >= 1.00        0               0.2    -0.2        0
GREATEST
 24 HR. TOTAL    0.72   03/05 TO 03/05

SNOWFALL (INCHES)
RECORDS
 TOTAL           33.9   1960
                        0
                        -26215
TOTALS           12.2               7.1     5.1      1.5
SINCE 7/1        59.9              65.2    -5.3     51.2
SNOWDEPTH AVG.      1                MM      MM        0
DAYS >= 1.0         2               2.2    -0.2        0
GREATEST
 SNOW DEPTH         7   03/06                         -1
 24 HR TOTAL      7.7   MM

DEGREE_DAYS
HEATING TOTAL    1014               855     159      417
 SINCE 7/1       5411              5544    -133     4500
COOLING TOTAL       0                 1      -1       44
 SINCE 1/1          0                 1      -1       44
.................................................................

WIND (MPH)
AVERAGE WIND SPEED              9.5
HIGHEST WIND SPEED/DIRECTION    32/280    DATE  03/19
HIGHEST GUST SPEED/DIRECTION    40/270    DATE  03/19

SKY COVER
POSSIBLE SUNSHINE (PERCENT)   MM
AVERAGE SKY COVER           0.60
NUMBER OF DAYS FAIR            8
NUMBER OF DAYS PC             11
NUMBER OF DAYS CLOUDY         12

AVERAGE RH (PERCENT)     68

WEATHER CONDITIONS. NUMBER OF DAYS WITH
THUNDERSTORM              0     MIXED PRECIP               0
HEAVY RAIN                0     RAIN                       1
LIGHT RAIN                8     FREEZING RAIN              0
LT FREEZING RAIN          2     HAIL                       0
HEAVY SNOW                1     SNOW                       4
LIGHT SNOW               12     SLEET                      0
FOG                      14     FOG W/VIS <= 1/4 MILE      1
HAZE                      7

-  INDICATES NEGATIVE NUMBERS.
R  INDICATES RECORD WAS SET OR TIED.
MM INDICATES DATA IS MISSING.
T  INDICATES TRACE AMOUNT.

&&

...WHAT A DIFFERENCE A YEAR MAKES...

MARCH 2013 WAS A COLD MONTH WITH ABOVE NORMAL SNOWFALL AND BELOW
NORMAL PRECIPITATION. THIS WAS A DRASTIC DIFFERENCE FROM MARCH 2012
WHICH SAW NUMEROUS RECORDS FOR WARMTH BROKEN...INCLUDING RECORD HIGH
TEMPERATURES ON NINE CONSECUTIVE DAYS AND NINE CONSECUTIVE DAYS WITH
HIGH TEMPERATURES AT OR ABOVE 70. MARCH 2013 DID NOT SEE A SINGLE
DAY WITH A HIGH TEMPERATURE OF 60 DEGREES. THERE WERE ONLY 5 DAYS
WITH AN AVERAGE TEMPERATURE ABOVE NORMAL AND 15 STRAIGHT DAYS WITH
AN AVERAGE TEMPERATURE BELOW NORMAL.

THE AVERAGE MONTHLY TEMPERATURE THIS MARCH WAS 32.0...5.5 DEGREES
BELOW NORMAL. THIS RANKED AS THE 16TH COLDEST MARCH ON RECORD. IN
CONTRAST...MARCH 2012 WAS THE WARMEST MARCH ON RECORD WITH A MONTHLY
AVERAGE TEMPERATURE OF 52.8 DEGREES. THIS DIFFERENCE OF 20.8 DEGREES
BETWEEN MONTHLY AVERAGE TEMPERATURES IN MARCH 2012 VS 2013 IS THE
GREATEST DIFFERENCE BETWEEN ANY MONTHLY AVERAGE TEMPERATURE FOR THE
SAME MONTH IN CONSECUTIVE YEARS.

THE HIGHEST TEMPERATURE THIS MONTH WAS 59 ON THE 10TH AND 31ST AND
THE COLDEST TEMPERATURE WAS 13 ON THE 8TH. IN MARCH 2012...THE
HIGHEST TEMPERATURE WAS A RECORD 85 DEGREES.

PRECIPITATION FOR THE MONTH WAS JUST 1.26 INCHES...1.16 INCHES BELOW
NORMAL. THIS RANKED AS THE 13TH DRIEST MARCH ON RECORD.
IRONICALLY...MORE PRECIPITATION FELL IN MARCH 2012...1.67 INCHES...
WHEN IT WAS WARMER AND CONSIDERED BY MANY TO BE MORE PLEASANT
COMPARED TO THIS MARCH. MEASURABLE PRECIPITATION THIS MONTH WAS
RECORDED ON 12 DAYS WHILE A TRACE OR MORE WAS RECORDED ON 22 DAYS.
DESPITE 70 PERCENT OF THE DAYS HAVING SOME FORM OF
PRECIPITATION...ONLY 2 DAYS HAD A TENTH OR MORE. THE HIGHEST DAILY
PRECIPITATION TOTAL WAS 0.72 INCHES ON THE 5TH.

EVEN THOUGH PRECIPITATION WAS BELOW NORMAL...SNOWFALL WAS ABOVE NORMAL
THIS MONTH. A TOTAL OF 12.2 INCHES WAS RECORDED...5.1 INCHES ABOVE
NORMAL. THIS RANKED AS THE 29TH SNOWIEST MARCH.

So how does March 2013 compare to March 2012? The charts below tell the tale of what a big difference a year can make.
High Temperatures
Most of March 2012 featured above normal high temperatures, except for a few days which were near to slightly below normal. In contrast, only 3-5 days had above normal high temperatures in March 2013. A large difference in temperatures was noted from March 12th-25th with a difference of almost 60 degrees on March 21st!
 |
 |
| Fort Wayne |
South Bend |
Average Temperatures
Low Temperatures
Most of March 2012 featured above normal low temperatures, except for a few days which were near to slightly below normal. In contrast, only a few days had above normal low temperatures in March 2013. A large difference in temperatures was noted from March 12th-25th with a difference of almost 50 degrees on March 21st!
 |
 |
| Fort Wayne |
South Bend |
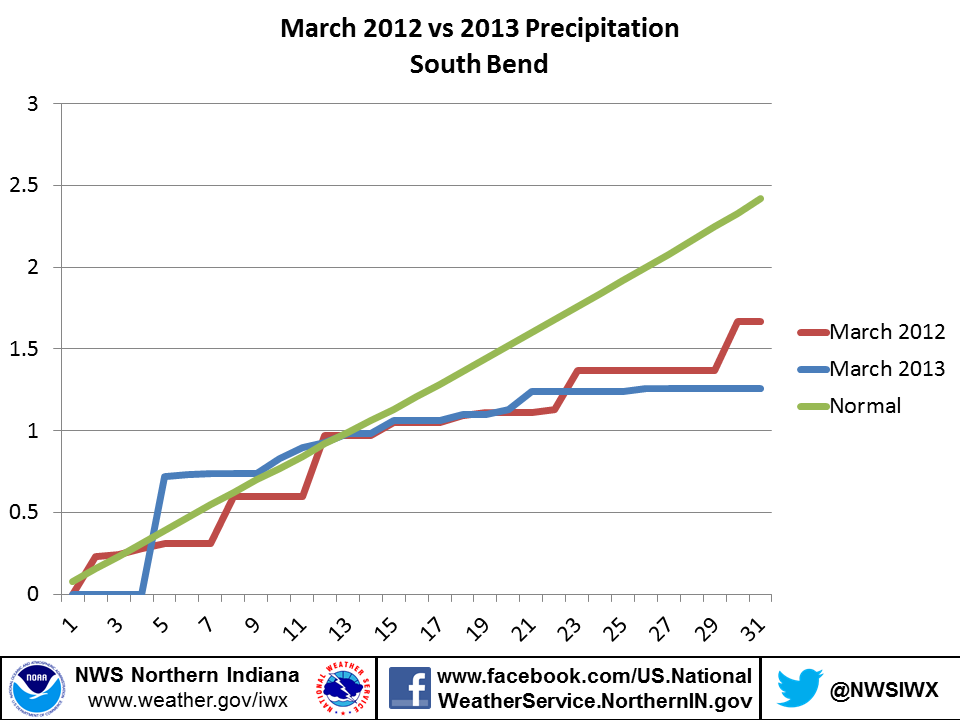
Precipitation
More precipitation actually occurred in March 2012 which ended the month above normal at Fort Wayne and below normal at South Bend. March 2013 finished below normal at both Fort Wayne and South Bend. The end of the month was relatively dry with less than 0.5 - 1 inch of precipitation fell.
 |
 |
| Fort Wayne |
South Bend |
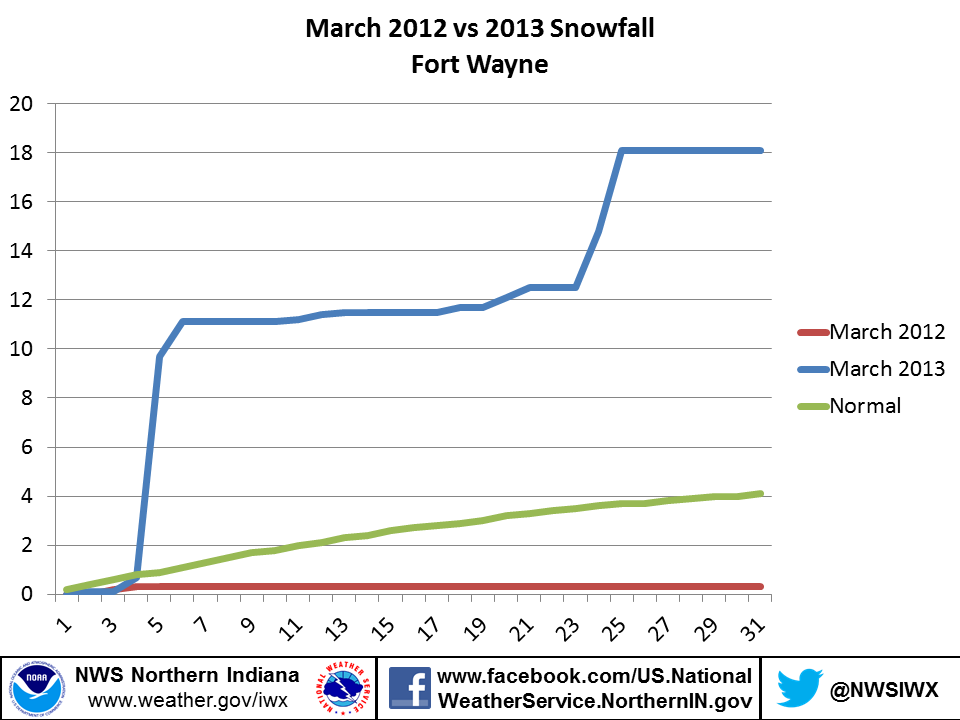
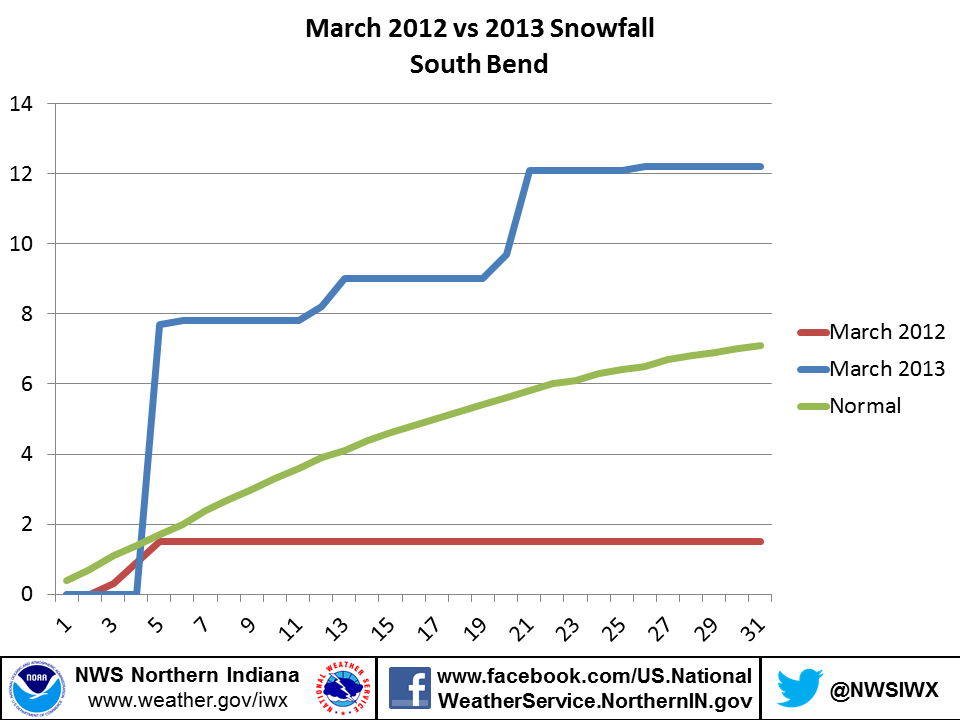
Snowfall
March 2013 was very different from March 2012 in terms of snowfall. Due to below normal temperatures much of the month, a large amount of precipitation fell in the form of snow. Fort Wayne ended March 2013 with an incredible 18.1 inches of snow which was 14.0 inches above normal! This was enough to make it the 3rd snowiest March on record. South Bend also saw above normal snowfall with 12.2 inches, which was 5.1 inches above normal for the month. Due to the record-breaking warmth of March 2012, much less snowfall was recorded.
 |
 |
| Fort Wayne |
South Bend |
Meteorological Factors
So what caused the large differences in temperatures between one March to the next? The main difference between the 2 months was the overall weather pattern. As meteorologists, we look at upper levels of the atmosphere on a daily basis to help determine what temperatures and weather will be like down here at the surface.
The charts below show heights (in meters) of the atmosphere at a certain pressure level (in millibars). Typically, higher heights are associated with ridges of high pressure. Lower heights are associated with troughs of low pressure. In very simplified terms, this boils down to: the higher (larger numbered contours) the heights, the warmer the temperatures. As shown in the charts (top row) below, upper level heights were over 80 meters above the long term average in March 2012. This led to a large, strong ridge of high pressure at the surface over the eastern half of the US for much of the month which brought warm, moist air from the south. On the flip side, upper level heights were 50-100 meters below the long term average in March 2013 (bottom row). This led to a trough of low pressure centered off the east coast of the US which brought cooler air down from the northwest. The difference in heights between March 2012 and March 2013 was over 130 meters! This equated to a temperature difference of nearly 20 degrees at the surface between the 2 months.
| Mar 2012 average 500 millibar (mb) heights |
Mar 2012 500mb departure from normal |
Mar 2012 mean sea level pressure (MSLP) |
 |
 |
 |
 |
 |
 |
| Mar 2013 average 500mb heights |
Mar 2013 500mb departure from normal |
Mar 2013 mean sea level pressure (MSLP) |
CEO/NG

