The stage was set Wednesday afternoon for widespread severe weather across most of Northern Indiana, Southern Michigan and Northwest Ohio, so why did only a few locations receive severe weather?
The 3 basic ingredients needed for the development of thunderstorms are instability, moisture, and a source of lift.
There was very strong instability Wednesday as high temperatures soared into the low 90s and dewpoints rose into the middle 70s with Convective Available Potential Energy (CAPE) values between 4000 and 6000 J/kg across most of the area. CAPE values greater than 1000 J/kg are plenty sufficient for thunderstorm development, so the values across the area indicated a highly unstable environment. Surface moisture was sufficient as dewpoint values were unseasonably high in the middle 70s. The source of lift was a cold front moving southeast over Lake Michigan through the afternoon hours and a short wave trough which would not arrive until the evening.
CAPE values at 5 pm EDT August 24, 2011. Red and white colors represent CAPE values greater than 4000 J/kg.
All the variables were in place for storm development by mid to late afternoon, but one inhibiting factor still remained which was the "cap." An air parcel rises when it is warmer than the environment around it. The "cap" refers to a layer of warm air above the surface layer which prevents warm surface parcels from rising since they are not warmer than the surrounding environment. The following upper-air sounding from Wilmington, Ohio at 8pm is a good indication of the airmass in our county warning area throughout most of the day.
KILN sounding from 8pm EDT August 24, 2011
The sounding indicates surface based CAPE of 4766 J/kg and CIN, which measures strength of the cap, of -23 J/kg. The CIN value is relatively weak, but was sufficient to delay thunderstorm development until 7-8 pm. The elevated mixed layer can be seen between 1.2 km and ~4 km which helped attribute to the steep mid level lapse rates and large CAPE. This elevated mixed layer was full of warm, dry air which hindered the updrafts from developing as robustly as expected.
The location of the cold front and pre-frontal trough can be seen on the visible satellite image from 5:45 pm EDT. There is notably less cloud cover over Northern Indiana due to the capping inversion which was still inhibiting cloud growth at this time.
Visible satellite at 5:45 pm EDT August 24, 2011.
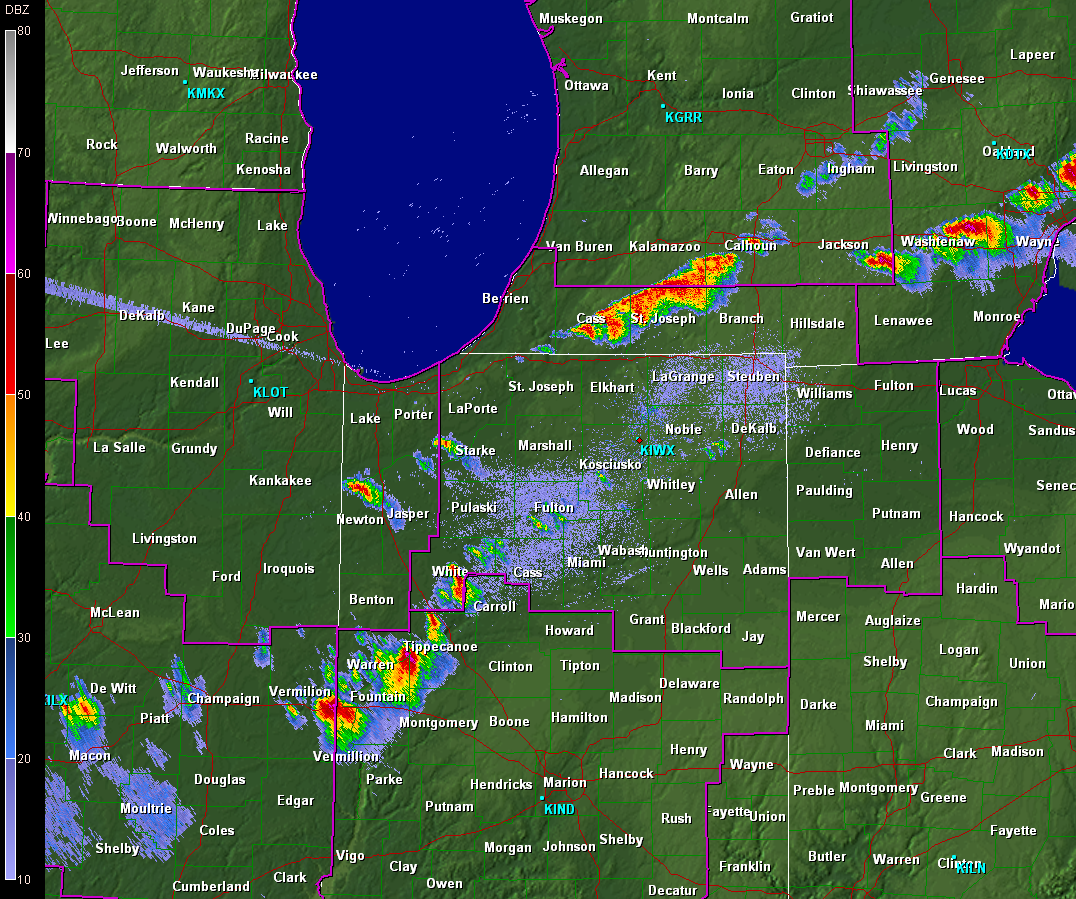
The thunderstorms began to form along the cold front and a pre-frontal trough near 7:30 pm EDT as the combination of frontal convergence, a shortwave trough overspreading the area, and a building 45 knot low level jet were finally able to "break the cap." By 8:30 pm EDT a line of storms had developed north of the the Indiana/Michigan border and another cluster of storms had developed near Lafayette. There were reports of small hail in many locations and up to quarter size hail in Elkhart as well as a report of a tree down 3 mi SE of Dowagiac, MI.
Radar image at 7:32 pm EDT August, 24, 2011
Radar image at 8:23 pm EDT August, 24, 2011
The initial line of storms quickly fell apart and a new line developed in northeastern Indiana by 10:00 pm EDT. This line of storms produced a few more reports of hail up to quarter size before becoming a greater wind threat. Winds of 45 to 55 mph were reported as the storms moved east of Fort Wayne. The winids intensified as the storms moved east into Paulding and Putnam County Ohio. At 10:27 pm EDT the KIWX radar was detecting outbound velocities near 70 knots 5000 feet above the ground southeast of Paulding, Ohio. The majority of this wind was able to mix down to the ground and produce widespread tree damage throughout Paulding and Putnam counties.
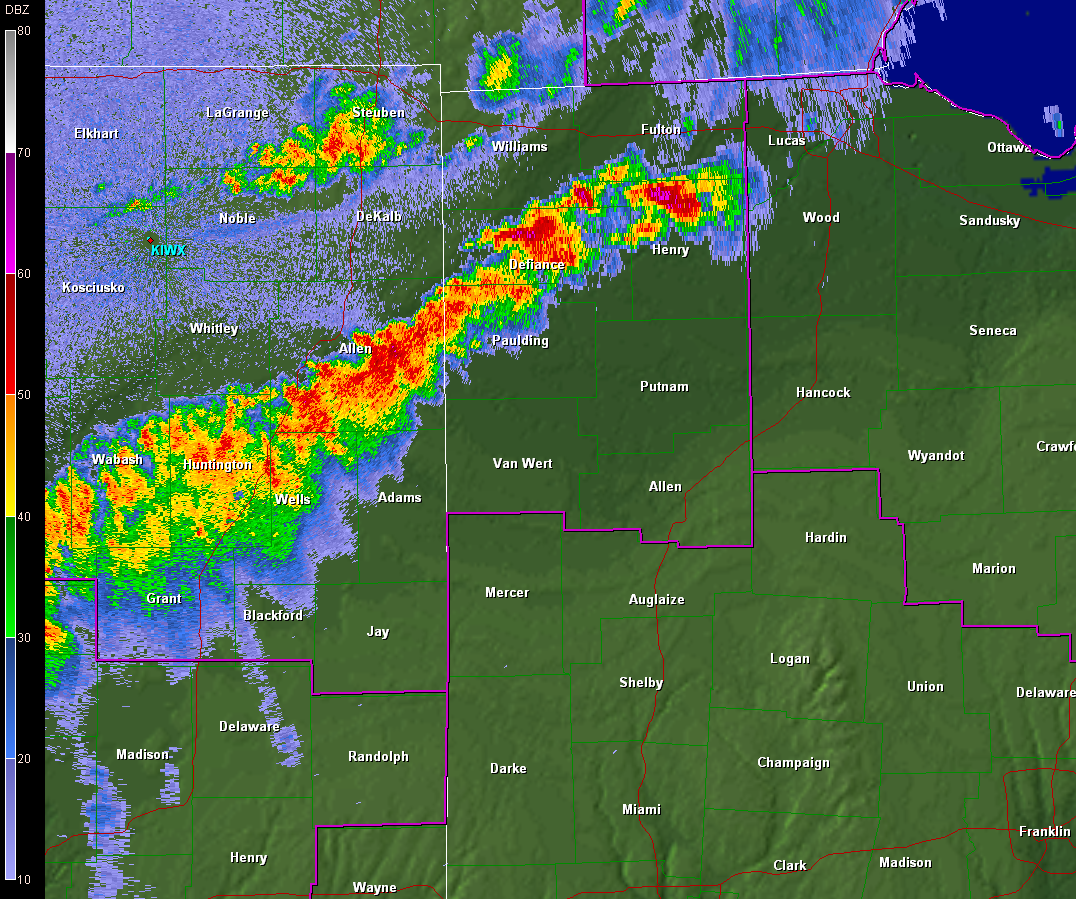
Radar image at 10:01 pm EDT August 24, 2011
Radar velocity image at 10:27 pm EDT August 24, 2011
The most dramatic aspect of the storms Wednesday night was the lightning. Between 7pm and 12a more than 27,000 lightning strikes were recorded in or near our county warning area. There were widespread reports of power outages due to the lightning. A barn was likely struck by lightning and burnt to the ground at Co Rd 10 and County Rd. O in Henry County, Ohio. This map shows every lightning strike detected between 10pm and 11pm when over 9000 lightning strikes were recorded. The lightning strikes are overlayed on an infrared satellite image showing the cold cloud tops at the peak of the lightning show.

The storms finally began to organize in Northwestern Ohio where there were a few reports of wind damage. These strong winds continued into north central Ohio and wind damage reports continued.
EB

