
Fig. 1- Storm Reports from 06/04/2011
Severe thunderstorms moved through the southwestern and southeastern portions of our forecast area Saturday afternoon and evening. We received more than one dozen wind damage reports in our area and close to a half dozen severe hail reports. These severe reports are mapped on the image above (Fig. 1). By clicking on any pin you can see more detailed information about the report. Blue pins represent severe wind reports (greater than 58 mph gust or wind damage) while green pins represent severe hail reports (greater than 1.00" diameter).
A text summary of all the reports for our area can be found at IWX Local Storm Reports.
Two storms in particular caused extensive damage. The extreme damaging wind event occurred in Hartford City, Indiana. The storm formed in a very unstable environment with surface-based convective available potential energy (CAPE) up to 4500 j/kg (Fig. 2), along with significant downdraft CAPE (DCAPE) between 1500-1700 j/kg (Fig. 3) around 4:00 pm EDT.
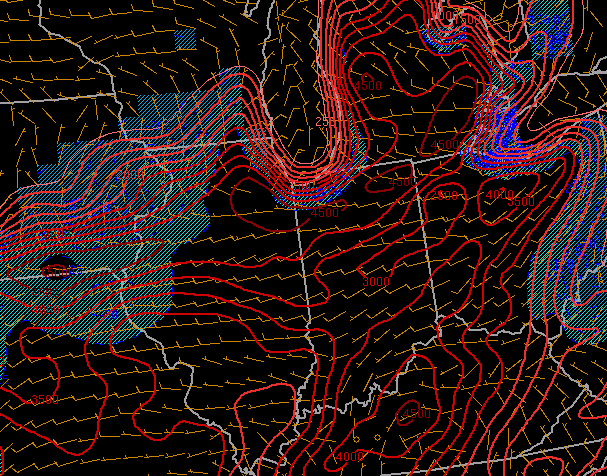 |
| Fig. 2- 2000 UTC surface-based convective available potential energy (SBCAPE) contours (red), convective inhibition (CIN) (blue shading) and surface wind barbs (brown). Note values up to 4500 j/kg across northern IN with no CIN away from Lake Michigan. |
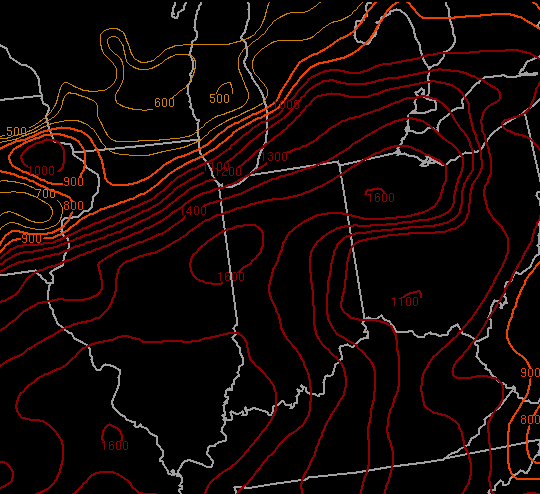 |
| Fig. 3- 2000 UTC downdraft CAPE (DCAPE) contours. Note higher swath of values from near Lafayette, IN east northeast into northwest OH. |
The intense updraft supported hail and precipitation aloft with National Weather Service Northern Indiana's Doppler RADAR indicating 65 dBZ at 20300 ft above ground level (agl) (Fig. 4), just northwest of the city limits at 4:30 pm EDT.
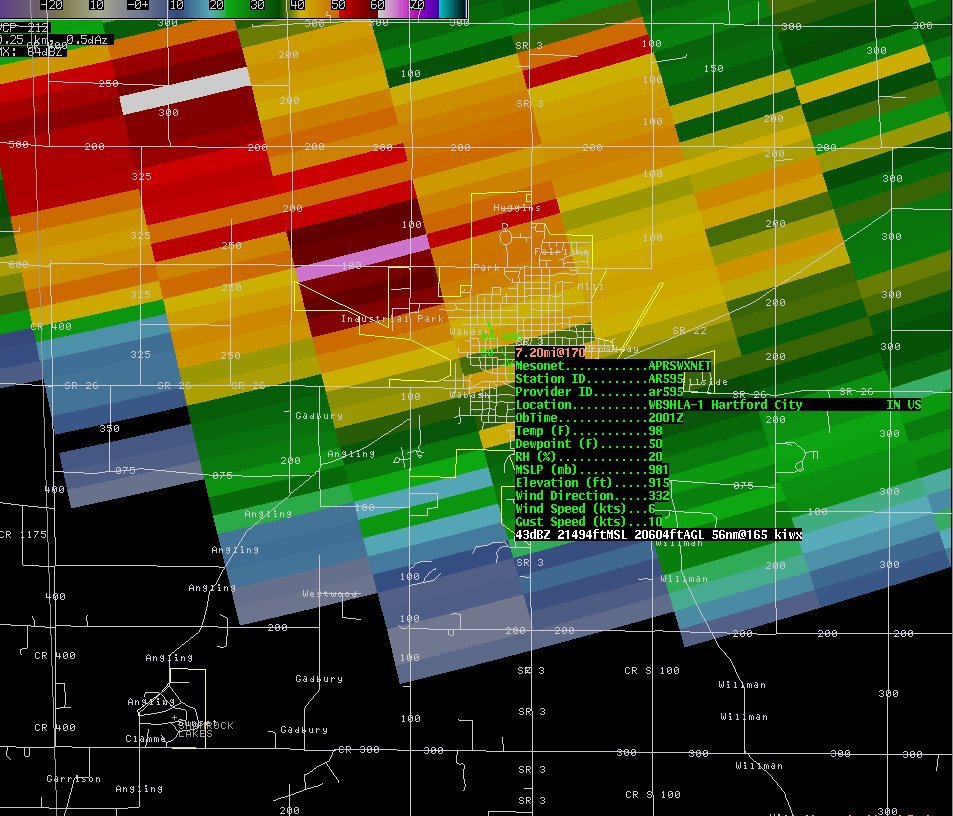 |
| Fig. 4- Base Reflectivity 3.1 degree elevation at 4:30 pm EDT. Note: 65 dBZ return immediately northwest of Hartford City. |
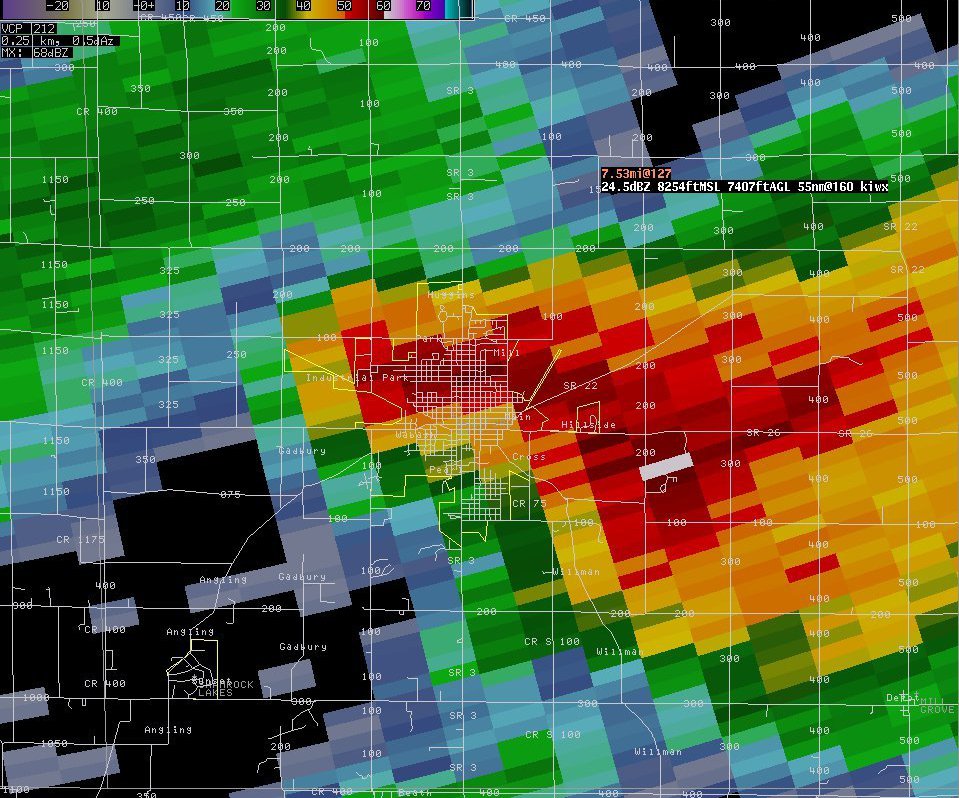
Five minutes later, the elevated core began to quickly descend toward the surface (Fig. 5) as the downdraft intensified. WSR-88D sampled 63 dBZ lowering to 5300 ft agl within Hartford City limits.
 |
| Fig. 5- Base Reflectivity 0.9 degree elevation at 4:35 pm EDT. |
The intense cell continued its collapse with reflectivity returns noted down to 44 dBZ in southeast Hartford City at 4:40 pm EDT (Fig. 6) At the same time the WSR-88D estimated actual velocity at 5300 ft was 60 knots (69 mph) southeast of Hartford City (Fig. 7), while at the surface intense, hurricane-force winds (estimated 70-75 mph) downed numerous trees and windows were blown out in the downtown district.
 |
| Fig. 6- Base Reflectivity 0.5 degree elevation at 4:40 pm EDT. |
 |
| Fig. 7- Base Velocity 0.5 degree elevation at 4:40 pm EDT. |
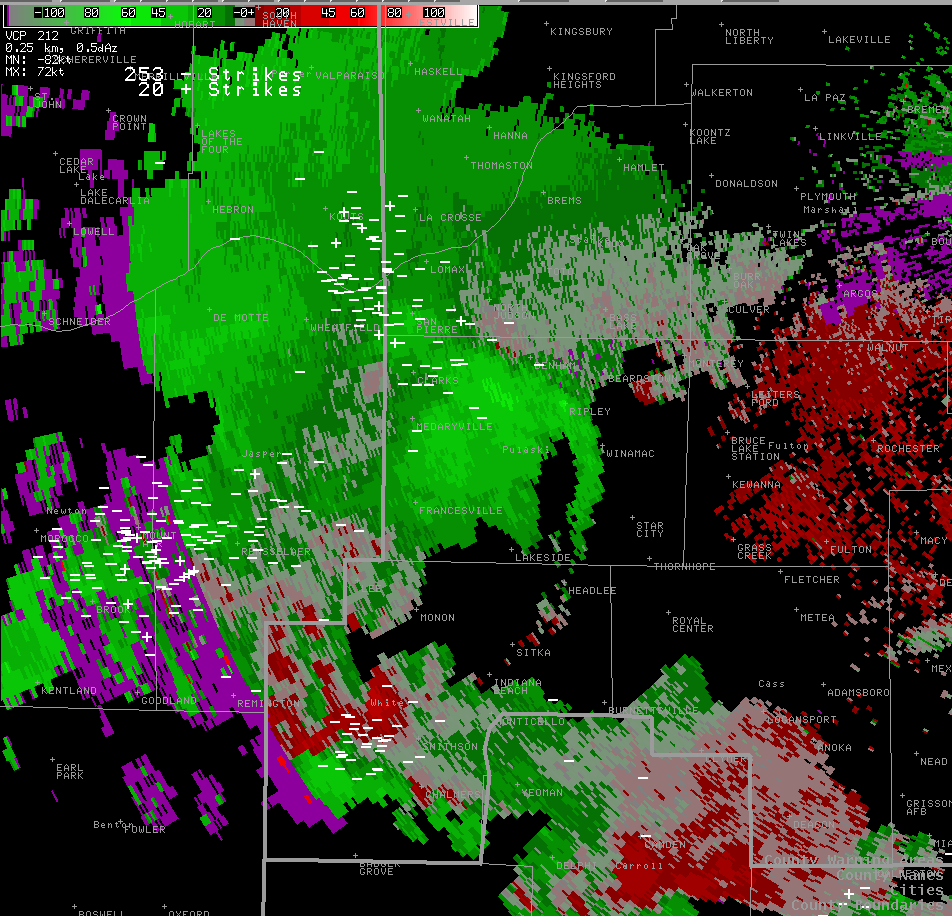
Further west, across northeast Illinois, intense storms developed across northeast Illinois between 4:00 and 5:00 pm EDT. The storms developed into a Line Echo Wave Pattern (LEWP) and began to develop a bow echo as intense downdraft winds impinged into the back of the system. Strong outflow winds were detected by RADAR as the storms moved into Pulaski County (Fig. 8 and 9).
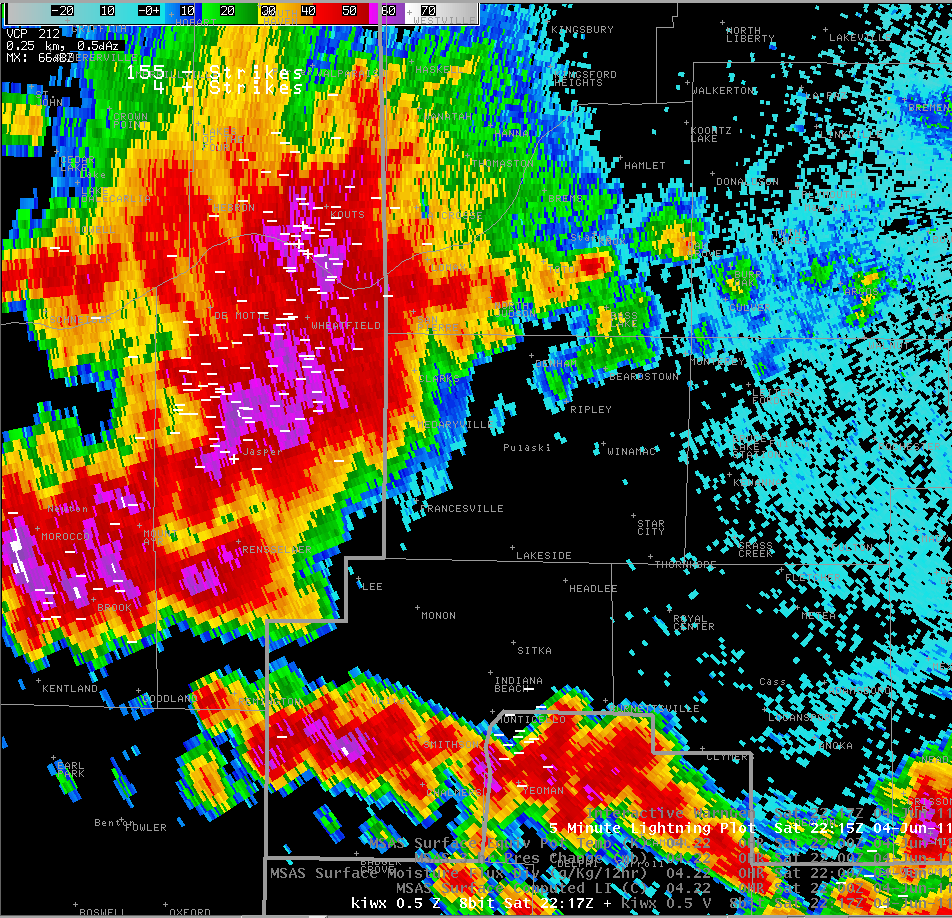 |
| Fig. 8- Base Reflectivity 0.5 degree elevation at 6:17 pm EDT. Leading edge of developing gust front into Francesville. |
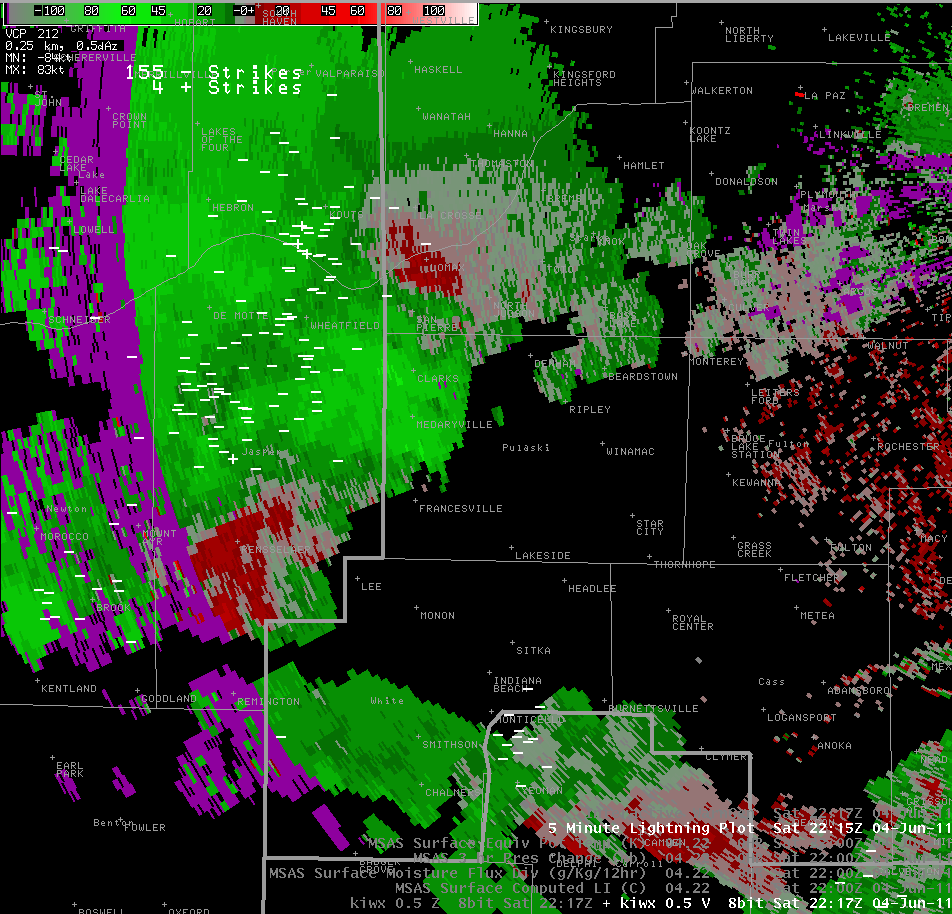 |
| Fig. 9- Base velocity 0.5 degree elevation at 6:17 pm EDT, same view as Fig. 8. |
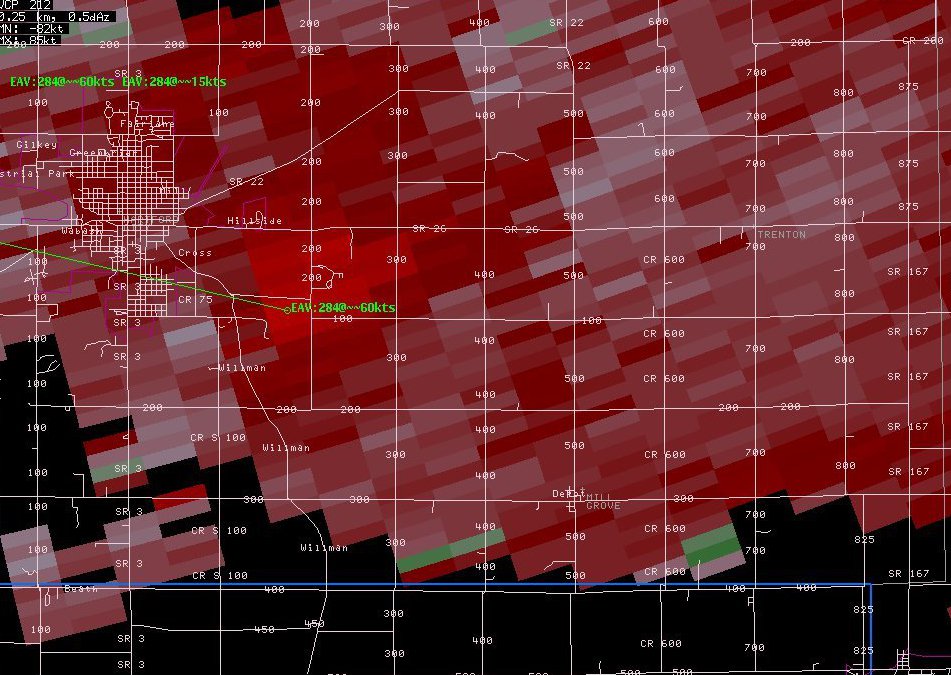
This outflow was intense in spots, especially in Francesville, Indiana, where numerous trees and power lines were downed. Also, a cinder block building partially collapsed. Wind gusts are estimated in the 65 to 70 mph range. The leading edge of strong to damaging winds raced ahead of the main storm system with numerous wind damage reports throughout Pulaski, White and Cass Counties (Fig. 10 and 11).
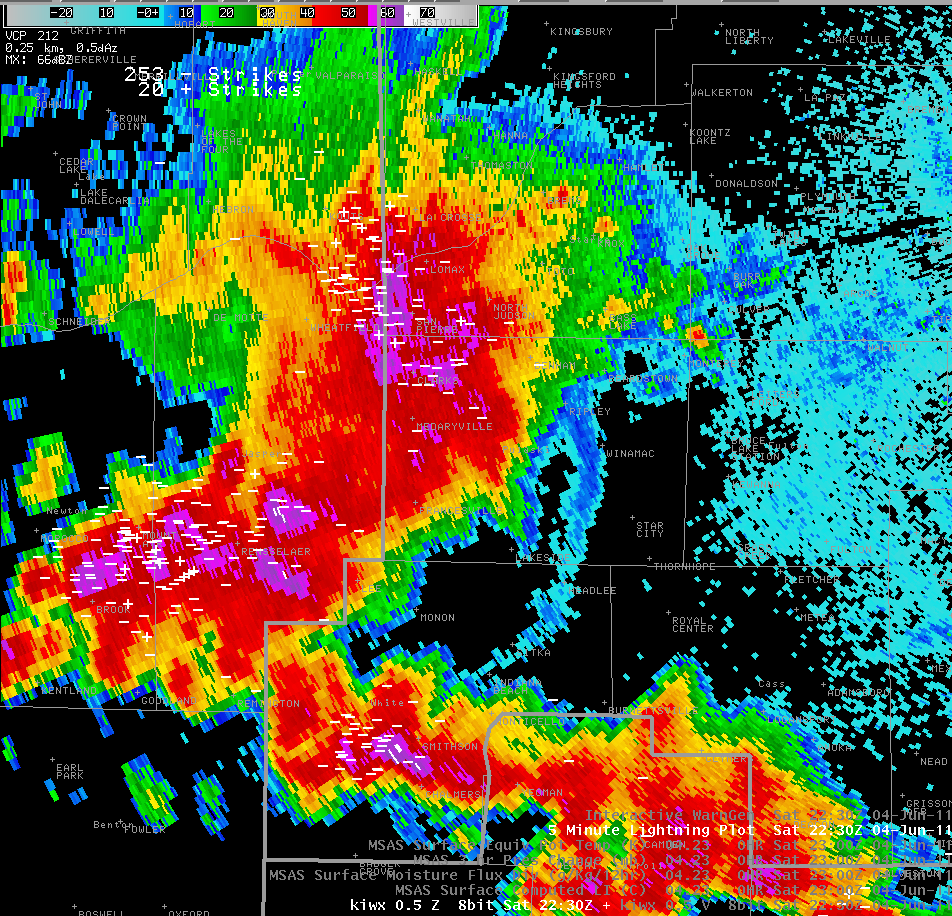 |
| Fig. 10- Base Reflectivity 0.5 degree elevation at 6:30 pm EDT. Leading edge of well-developed gust front arcing across eastern Pulaski County into northeastern White County and approaching northwest Cass County. |
 |
| Fig. 11- Base velocity 0.5 degree elevation at 6:17 pm EDT, same view as Fig. 10. |
Also, spotters and the public reported features consistent with gustnadoes in Francesville and at the Broken Arrow Campground, north of Winamac. These short-lived, swirling eddies are often found along the leading edge gust front and are associated with outflow dominant storms. While visually spectacular, these rotations are meteorologically more akin to whirlwinds and dust devils than the typically stronger, more persistent and more dangerous tornadoes. These circulations were visually enhanced by an inordinate amount of blowing dust from recently tilled and planted farm fields. Metaphorically, a gustnado is akin to a paddle being moved through still water. Either side of the paddle there will be short lived swirling vorticies. Similarly, in the atmosphere there are numerous, often unseen, vortices whenever intense downdraft winds from thunderstorms impact the ground.
EB/PBM/NG/LWF

