Northern Indiana
Weather Forecast Office

Preliminary Snowfall Map (Larger Image Available by clicking the picture)
The following are snowfall totals received by the National Weather Service Forecast Office in Northern Indiana. We thank all our volunteer spotters for their reports!
PUBLIC INFORMATION STATEMENT
NATIONAL WEATHER SERVICE NORTHERN INDIANA
1150 AM EST FRI DEC 8 2006
...MODERATE TO HEAVY LAKE EFFECT SNOW ACROSS THE REGION THURSDAY...
A COLD FRONT CROSSED THE REGION EARLY THURSDAY MORNING AND PRODUCED
A LIGHT DUSTING OF SNOWFALL ACROSS MOST OF THE AREA. AS COLDER AIR
MOVED ACROSS LAKE MICHIGAN...BANDS OF MODERATE TO HEAVY LAKE EFFECT
SNOW SHOWERS AND SQUALLS FORMED SOUTHEAST OF LAKE MICHIGAN. AS IS
TYPICALLY THE CASE WITH LAKE EFFECT SNOW...AMOUNTS VARIED WIDELY AND
THE HEAVIEST TOTALS WERE ONLY FOUND IN VERY LOCALIZED AREAS.
THE FOLLOWING ARE THE MOST RECENT STORM TOTAL SNOWFALL REPORTS FROM
LATE WEDNESDAY NIGHT THROUGH THURSDAY NIGHT RECEIVED BY THE NATIONAL
WEATHER SERVICE FORECAST OFFICE IN NORTHERN INDIANA.
LOCATION COUNTY SNOWFALL
/INCHES/
...SOUTHERN LOWER MICHIGAN...
MARCELLUS CASS 11.3
CASSOPOLIS CASS 7.4
UNION CASS 6.0
WHITE PIGEON ST JOSEPH 5.5
STURGIS ST JOSEPH 5.5
BRONSON BRANCH 2.7
LITCHFIELD HILLSDALE 2.7
NILES BERRIEN 2.1
...NORTHERN INDIANA...
LIGONIER 1 N NOBLE 6.0
MIDDLEBURY ELKHART 5.8
BENTON ELKHART 5.8
ELKHART ELKHART 5.0
GOSHEN ELKHART 5.0
MIDDLEBURY 3 N ELKHART 4.8
KIMMEL NOBLE 4.5
CROMWELL NOBLE 4.0
NORTH WEBSTER NWS KOSCIUSKO 3.6
MILLERSBURG 3 NNE ELKHART 3.6
FISH LAKE LAPORTE 3.5
LAPORTE LAPORTE 3.5
GOSHEN 2 S ELKHART 3.5
ROLLING PRAIRIE LAPORTE 3.1
LIGONIER 6 E NOBLE 3.0
COLUMBIA CITY WHITLEY 3.0
FORT WAYNE 5 WSW ALLEN 2.7
KNOX STARKE 2.6
GRANGER ST JOSEPH 2.5
WALKERTON 3 SSE MARSHALL 2.5
MICHIGAN CITY LAPORTE 2.0
ANGOLA 6 W STEUBEN 2.0
ST JOE DEKALB 2.0
PLYMOUTH 1 SSE MARSHALL 2.0
ABOITE ALLEN 2.0
SOUTH BEND AIRPORT ST JOSEPH 1.9
AVILLA NOBLE 1.8
OSSIAN WELLS 1.7
KENDALLVILLE NOBLE 1.4
FORT WAYNE AIRPORT ALLEN 1.4
FORT WAYNE 4 NE ALLEN 1.2
WARSAW 1 NNE KOSCIUSKO 1.0
HUNTINGTON HUNTINGTON 1.0
WAKARUSA ELKHART 0.8
NORTH JUDSON STARKE 0.8
METZ STEUBEN 0.8
AUBURN DEKALB 0.6
WARSAW KOSCIUSKO 0.6
BERNE ADAMS 0.5
AKRON FULTON 0.5
ALDINE 2 S STARKE 0.3
LOGANSPORT CASS 0.3
THE NATIONAL WEATHER SERVICE IN NORTHERN INDIANA THANKS OUR
VOLUNTEER SNOW SPOTTERS FOR THEIR REPORTS. WE ENCOURAGE YOU TO
REPORT YOUR SNOWFALL THROUGHOUT THE WINTER AND SPRING SEASON.
A significant Lake Effect Snow event began late on the evening of Wednesday December 6th and concluded during the evening hours of Thursday December 7th. Significant accumulations of 6 to almost 12 inches of snow fell across the north central portion of the County Warning and Forecast Area (CWFA) of the NWS Northern Indiana office. The heaviest snow fell in a narrow swath from northern Cass county in Michigan to central Noble county in northeast Indiana. General 4 to 6 inch amounts were common in this area, with the highest amounts in far northern Cass county Michigan. Marcellus Michigan in extreme northeast Cass county reported 11.3 inches of snowfall. Just to the north of Cass county in Van Buren county (NWS Grand Rapids CWFA), over 20 inches of snow fell!
Below are several risk assessment maps that were issued prior to the storm development and updated as the event progressed and a visible satellite image taken at 2 pm EST on December 8th. The heavy snow band fell within and just outside the eastern fringes of the high risk area which was updated and gradually moved east as the event unfolded. Note the primary single lake effect snow band, denoted by the bright white snow finger of snow cover, which stretches from southwest Michigan southeast into west central Ohio.
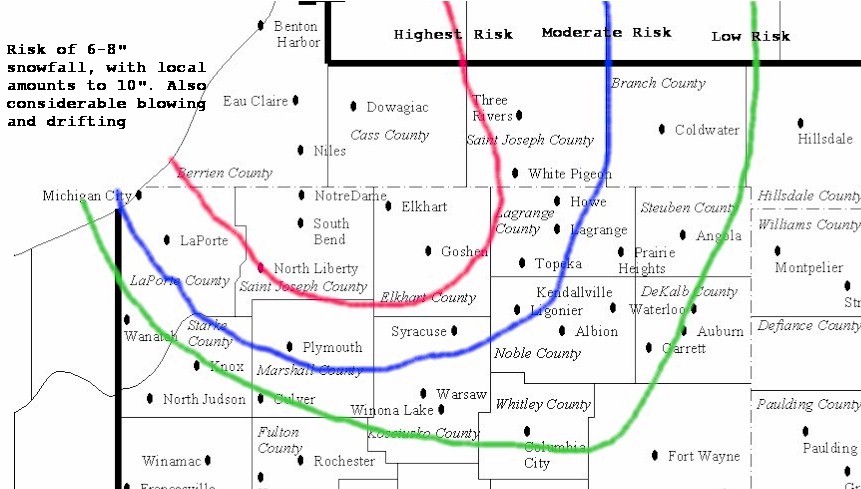


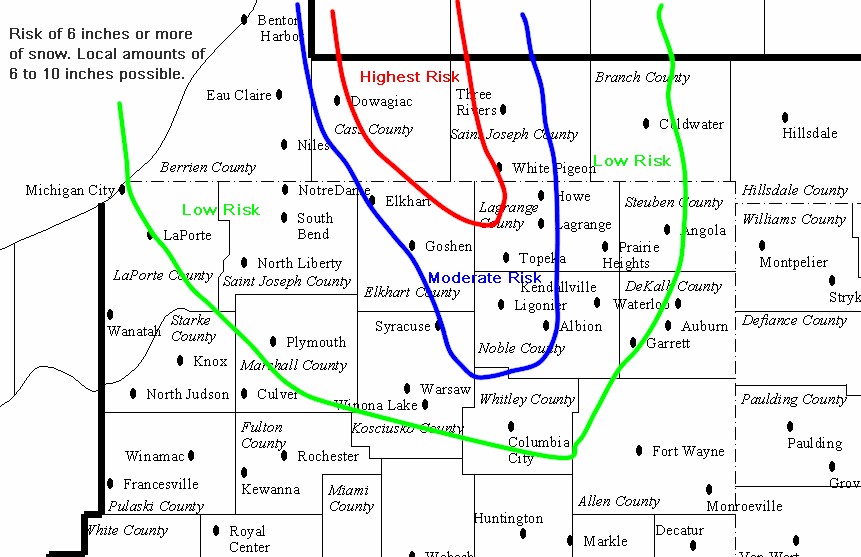

L Fisher/S Lashley/T Holsten/J. Hitchcock 12/8/06 Updated at 500 pm est
Hazards
Heat Related
Watch/Warning
Outlook
Storm Prediction Center
Storm Reports
Submit a Report
Outdoor Event Watcher
EM Briefing
Current Conditions
Hourly Weather
Surface Observations
Regional Temps/Precip
Precip Reports
Satellite
Climate
CoCoRaHS
FWA Daily
SBN Daily
FWA Monthly
SBN Monthly
Cliplot
Spring Frost Climatology
Fall Frost Climatology
Severe Climatology
Tornado Climatology
Local Information
Public Information Statement
Probabilistic Snowfall
Storm Data
Skywarn
COOP
Our Office
WSR-88D
Headline Criteria
NOAA Weather Radio
Weather History
Social Media Feeds
Weather Events Page
US Dept of Commerce
National Oceanic and Atmospheric Administration
National Weather Service
Northern Indiana
7506 E 850 N
Syracuse, IN 46567
574-834-1104
Comments? Questions? Please Contact Us.

