Lubbock, TX
Weather Forecast Office
|
|||||||||||||||||||||
|
|
|||||||||||||||||||||
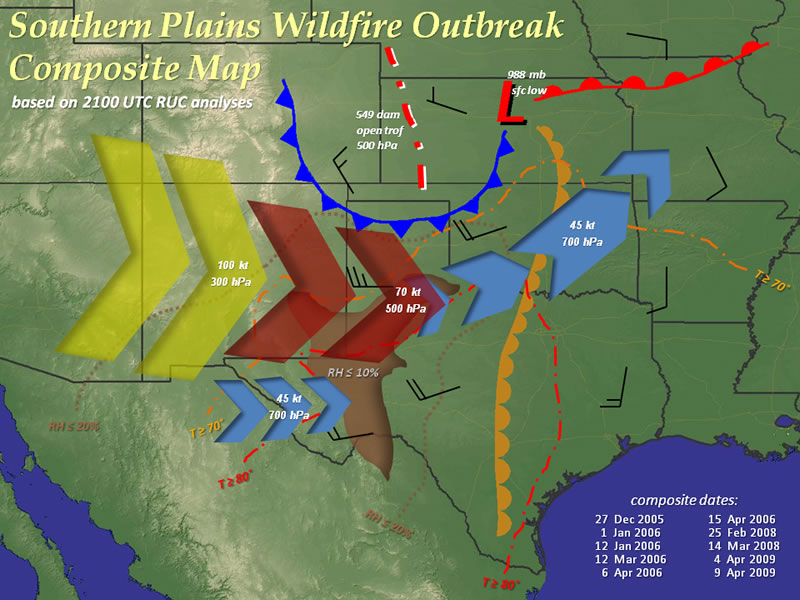
| The coincidence of the 500 hPa jet max and 850 hPa thermal ridge have also been found to help delineate the region most favorable for dangerous wildfires. A secondary example of the favorable 500 hPa jet max and 850 hPa thermal ridge pattern can be found HERE. | |||||||||||||||||||||
US Dept of Commerce
National Oceanic and Atmospheric Administration
National Weather Service
Lubbock, TX
2579 S. Loop 289
Suite 100
Lubbock, TX 79423-1400
806-745-4260
Comments? Questions? Please Contact Us.


