|
How does 2012 stack up in comparison to the record-setting 2011?
(through July 2012) |
||||||||||||||||||||||||||||||||||||||||||||||||||||||||||||||||||||||||||||||||||||||||||||||||||||||||||||||||||||||||||||||||||||||||||||||||||||||||||||||||||||||||||||||||||||||||||||||||||||||||||||
 |
||||||||||||||||||||||||||||||||||||||||||||||||||||||||||||||||||||||||||||||||||||||||||||||||||||||||||||||||||||||||||||||||||||||||||||||||||||||||||||||||||||||||||||||||||||||||||||||||||||||||||||
| Official cumulative rainfall, in inches, at Lubbock for 2011 (blue) and 2012 (red - through 30 July 2012). The 30-year average cumulative rainfall is also shown in green. The official Lubbock observations are taken at Lubbock Preston Smith International Airport located on the north side of town. Click on the image for a larger view. | ||||||||||||||||||||||||||||||||||||||||||||||||||||||||||||||||||||||||||||||||||||||||||||||||||||||||||||||||||||||||||||||||||||||||||||||||||||||||||||||||||||||||||||||||||||||||||||||||||||||||||||
|
After a record warm and dry 2011 and an incredibly hot and exceptionally dry summer of 2011, one might ask how 2012 is doing in comparison to last year? Precipitation Thankfully, the rains this year have been more widespread, frequent and heavier than in 2011. As the above graph shows, officially Lubbock has recorded approximately five times that of last year through July (5.51 inches in 2012 versus 1.15 inches at this same time in 2011). The 5.51 inches is just shy of the total rainfall received throughout all of 2011 (5.86 inches). However, the 2012 year-to-date rainfall does still fall considerably below the 30-year normal of 11.16 inches. Looking at just one point doesn't usually tell the entire story, especially when it comes to rainfall, which can be spotty and greatly variable. Expanding our view to include Childress (below), 2012 has also been more plentiful with the rainfall in comparison to 2011 (11.37 inches in 2012 versus 3.64 inches at this same time in 2011), though it falls short of the normal value of 14.47 inches. |
||||||||||||||||||||||||||||||||||||||||||||||||||||||||||||||||||||||||||||||||||||||||||||||||||||||||||||||||||||||||||||||||||||||||||||||||||||||||||||||||||||||||||||||||||||||||||||||||||||||||||||
|
|
||||||||||||||||||||||||||||||||||||||||||||||||||||||||||||||||||||||||||||||||||||||||||||||||||||||||||||||||||||||||||||||||||||||||||||||||||||||||||||||||||||||||||||||||||||||||||||||||||||||||||||
| Official cumulative rainfall, in inches, at Childress for 2011 (magenta), 1958 (tan - the driest year on record), and 2012 (blue - through 30 July 2012). The 30-year average cumulative rainfall is also shown in green. The official Childress observation is taken at the airport located just west of town. Click on the image for a larger view. | ||||||||||||||||||||||||||||||||||||||||||||||||||||||||||||||||||||||||||||||||||||||||||||||||||||||||||||||||||||||||||||||||||||||||||||||||||||||||||||||||||||||||||||||||||||||||||||||||||||||||||||
|
Further expanding our view to the entire South Plains, Rolling Plains, and southern Texas Panhandle, the rainfall totals for 2012 have been up notably from last year. The below map indicates that yearly rain totals range from less than 5 inches near parts of the Texas/New Mexico line to in excess of 15 inches in small pockets of Crosby and Dickens Counties, with most locations between 5 and 15 inches. |
||||||||||||||||||||||||||||||||||||||||||||||||||||||||||||||||||||||||||||||||||||||||||||||||||||||||||||||||||||||||||||||||||||||||||||||||||||||||||||||||||||||||||||||||||||||||||||||||||||||||||||
 |
||||||||||||||||||||||||||||||||||||||||||||||||||||||||||||||||||||||||||||||||||||||||||||||||||||||||||||||||||||||||||||||||||||||||||||||||||||||||||||||||||||||||||||||||||||||||||||||||||||||||||||
| Bias-corrected radar-estimated yearly precipitation through 1 August 2012. Click on the image for a bigger view. | ||||||||||||||||||||||||||||||||||||||||||||||||||||||||||||||||||||||||||||||||||||||||||||||||||||||||||||||||||||||||||||||||||||||||||||||||||||||||||||||||||||||||||||||||||||||||||||||||||||||||||||
| Another way to view this same rainfall data is by comparing it normal, as displayed below. Even though rainfall amounts through July are much above those of last year, a large portion of the region still remains below average, with many spots still less than 75% of average. This includes a number of locations across the central and western South Plains and southwest Panhandle that are less than half of normal. The exception to this was in a narrow and broken swath extending roughly from Hereford to Abernathy to Post where yearly totals were at or even a little above average. | ||||||||||||||||||||||||||||||||||||||||||||||||||||||||||||||||||||||||||||||||||||||||||||||||||||||||||||||||||||||||||||||||||||||||||||||||||||||||||||||||||||||||||||||||||||||||||||||||||||||||||||
 |
||||||||||||||||||||||||||||||||||||||||||||||||||||||||||||||||||||||||||||||||||||||||||||||||||||||||||||||||||||||||||||||||||||||||||||||||||||||||||||||||||||||||||||||||||||||||||||||||||||||||||||
| Bias-corrected radar-estimated yearly percent of normal precipitation through 1 August 2012. Click on the image for a bigger view. A bias-corrected radar-estimated yearly departure from normal map through 1 August 2012 can also be FOUND HERE. | ||||||||||||||||||||||||||||||||||||||||||||||||||||||||||||||||||||||||||||||||||||||||||||||||||||||||||||||||||||||||||||||||||||||||||||||||||||||||||||||||||||||||||||||||||||||||||||||||||||||||||||
|
The Drought The increase in rainfall, in comparison to last year, has led to improvements in the ongoing drought, as the below U.S. Drought Monitor illustrates. Most of the South and Rolling Plains are no longer in the exceptional drought category, as they were last summer (and much of last year). However, as the below drought monitor issued on July 31st depicts, much of the South Plains and Rolling Plains are still battling a severe to extreme drought, as rainfall deficits since 2011 remain large and the recent hot and dry weather exacerbate the situation. |
||||||||||||||||||||||||||||||||||||||||||||||||||||||||||||||||||||||||||||||||||||||||||||||||||||||||||||||||||||||||||||||||||||||||||||||||||||||||||||||||||||||||||||||||||||||||||||||||||||||||||||
|
|
||||||||||||||||||||||||||||||||||||||||||||||||||||||||||||||||||||||||||||||||||||||||||||||||||||||||||||||||||||||||||||||||||||||||||||||||||||||||||||||||||||||||||||||||||||||||||||||||||||||||||||
| U.S. Drought Monitor issued on 31 July 2012. Click on the image for a bigger view. | ||||||||||||||||||||||||||||||||||||||||||||||||||||||||||||||||||||||||||||||||||||||||||||||||||||||||||||||||||||||||||||||||||||||||||||||||||||||||||||||||||||||||||||||||||||||||||||||||||||||||||||
|
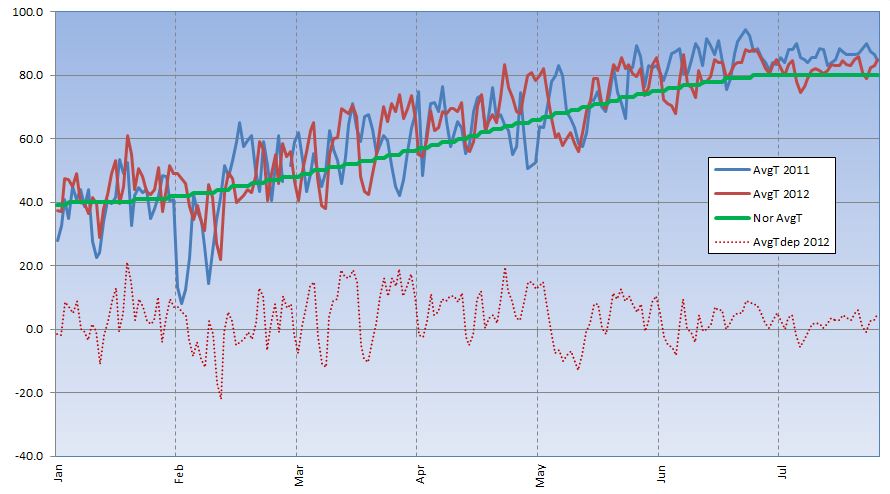
Temperatures There are surprising similarities and key differences between 2011 and 2012 when analyzing temperatures. The following graph shows that much of the last two years have been on the warm side of normal, though with the expected variability of day-to-day weather, and cold stretches in the first half of February both years. Surprisingly, through July, 2012 has been warmer than the record warm year of 2011 (average temperatures of 64.4 degrees this year (and in 2006) as compared to 63.8 degrees in 2011). This difference is due primarily to the fact that the first four months of this year (January - April) averaged nearly 3 degrees warmer than 2011. Thankfully, though, even as temperatures have been above normal in June and July, they have still been well below the scorcher that was experienced last summer. So, up to this point, 2012 has been warmer than 2011, but it may not seem that way since the last two months, during the hottest part of the year, have been considerably "cooler" than last year. |
||||||||||||||||||||||||||||||||||||||||||||||||||||||||||||||||||||||||||||||||||||||||||||||||||||||||||||||||||||||||||||||||||||||||||||||||||||||||||||||||||||||||||||||||||||||||||||||||||||||||||||
 |
||||||||||||||||||||||||||||||||||||||||||||||||||||||||||||||||||||||||||||||||||||||||||||||||||||||||||||||||||||||||||||||||||||||||||||||||||||||||||||||||||||||||||||||||||||||||||||||||||||||||||||
| Average temperatures observed at Lubbock in 2011 (in blue) and 2012 (in red). Also included are the 1981-2010 normal average temperatures (green) and the 2012 departures from normal (dashed red). Click on the chart for a larger view. | ||||||||||||||||||||||||||||||||||||||||||||||||||||||||||||||||||||||||||||||||||||||||||||||||||||||||||||||||||||||||||||||||||||||||||||||||||||||||||||||||||||||||||||||||||||||||||||||||||||||||||||
|
The Summer Months Below are several charts that attempt to demonstrate the differences between the current summer in progress and last year's record breaking heat. |
||||||||||||||||||||||||||||||||||||||||||||||||||||||||||||||||||||||||||||||||||||||||||||||||||||||||||||||||||||||||||||||||||||||||||||||||||||||||||||||||||||||||||||||||||||||||||||||||||||||||||||
|
||||||||||||||||||||||||||||||||||||||||||||||||||||||||||||||||||||||||||||||||||||||||||||||||||||||||||||||||||||||||||||||||||||||||||||||||||||||||||||||||||||||||||||||||||||||||||||||||||||||||||||
| Not surprisingly, although the current summer has been hot, it does fall well short of last year in numerous categories. The most extreme days, with highs above 100 degrees, have numbered approximately half of what was experienced last year at this same point. | ||||||||||||||||||||||||||||||||||||||||||||||||||||||||||||||||||||||||||||||||||||||||||||||||||||||||||||||||||||||||||||||||||||||||||||||||||||||||||||||||||||||||||||||||||||||||||||||||||||||||||||
|
||||||||||||||||||||||||||||||||||||||||||||||||||||||||||||||||||||||||||||||||||||||||||||||||||||||||||||||||||||||||||||||||||||||||||||||||||||||||||||||||||||||||||||||||||||||||||||||||||||||||||||
| The same trend is also noted when considering the warm overnight lows. Through July, Lubbock has yet to experience a low of 75 degrees or warmer, while Childress has halved the number of warm lows from a year ago. | ||||||||||||||||||||||||||||||||||||||||||||||||||||||||||||||||||||||||||||||||||||||||||||||||||||||||||||||||||||||||||||||||||||||||||||||||||||||||||||||||||||||||||||||||||||||||||||||||||||||||||||
|
||||||||||||||||||||||||||||||||||||||||||||||||||||||||||||||||||||||||||||||||||||||||||||||||||||||||||||||||||||||||||||||||||||||||||||||||||||||||||||||||||||||||||||||||||||||||||||||||||||||||||||
| A similar downward trend can be seen this year when looking at the consecutive days of heat. This summer has brought several stretches of hot conditions, but unlike in 2011, they have also been interrupted by brief breaks from the heat. | ||||||||||||||||||||||||||||||||||||||||||||||||||||||||||||||||||||||||||||||||||||||||||||||||||||||||||||||||||||||||||||||||||||||||||||||||||||||||||||||||||||||||||||||||||||||||||||||||||||||||||||
|
||||||||||||||||||||||||||||||||||||||||||||||||||||||||||||||||||||||||||||||||||||||||||||||||||||||||||||||||||||||||||||||||||||||||||||||||||||||||||||||||||||||||||||||||||||||||||||||||||||||||||||
| Regarding rainfall during the summer, 2012 has been wetter than last year, though the details vary greatly by location as the heavy thunderstorms have been spotty. Lubbock has officially recorded 1.81 inches more this June and July than the paltry 0.05 inches measured last year. Even so, this year rank as the 11th driest June through July stretch on record. Conditions were less extreme at Childress where 5.43 inches have fallen over the same stretch, which is less than a half inch shy of normal. | ||||||||||||||||||||||||||||||||||||||||||||||||||||||||||||||||||||||||||||||||||||||||||||||||||||||||||||||||||||||||||||||||||||||||||||||||||||||||||||||||||||||||||||||||||||||||||||||||||||||||||||
|
||||||||||||||||||||||||||||||||||||||||||||||||||||||||||||||||||||||||||||||||||||||||||||||||||||||||||||||||||||||||||||||||||||||||||||||||||||||||||||||||||||||||||||||||||||||||||||||||||||||||||||


