|
Strong Winds and Blowing Dust Pay Another Visit to West Texas |
|
|
| Plot of maximum wind gusts (mph) observed on 22 January 2012. Data are courtesy of the West Texas Mesonet (WTM) and the National Weather Service (NWS). Click on the map for a larger view. |
|
A dynamic storm system raced across the southern plains on Sunday, 22 January 2012 (see the below image). As this happened intense wind fields pivoted across the South Plains region. The winds initially ramped up early in the morning on Sunday behind a Pacific-type cold front that raced across the region. In the wake of the front westerly winds quickly increased to 35 to 45 mph, with gusts to around 60 mph. In addition, a secondary cold front, further aided by showers that developed over the central and northern Texas Panhandle, moved into the southern Texas Panhandle and northern South and Rolling Plains early Sunday afternoon with even stronger wind gusts. The above plot shows the maximum wind gusts observed through the day on Sunday. A peak gust of 77 mph was measured by the WTM site 2 miles west-southwest of Clarendon, with a gust to 70 mph observed at the WTM site 2 miles east-northeast of Tulia. Officially, the Lubbock and Childress airports recorded gusts to 60 mph and 67 mph, respectively. |
|
|
| Water vapor satellite image taken at 1:45 pm on Sunday, 22 January 2012. The orange arrow indicates where strong westerly winds were in place on the south side of the passing storm system. Click on the picture for a larger version. |
|
The intense winds also lofted copious amounts of dust that occasionally reduced the visibilities to one half mile or less. The dust plume generated by the classic West Texas windstorm enveloped a large portion of the region, as can be seen in the below satellite image. |
|
|
| Infrared satellite image taken at 1:45 pm on Sunday, 22 January 2012. Clearly visible is a large plume of dust encompassing a large portion of the region. Also noted is an area of clouds and showers which help enhance the winds across the Texas Panhandle. Click on the image for a larger version. |
| Below is another satellite view of the dust storm from a high resolution satellite early Sunday afternoon. Copious amounts of dust are evident across most of the South and Rolling Plains. In addition, a concentrated arc of dust is apparent between Plainview and Lubbock where a secondary cold front is moving through. |
|
|
| High-resolution MODIS satellite image captured around 2 pm on 22 January 2012. Click on the image for a larger view. To see a regional MODIS view at the same time CLICK HERE. |
| The following radar animation shows a batch of precipitation that moved over the Texas Panhandle early Sunday afternoon. This precipitation provided a mechanism to further transfer momentum (wind) to ground level, which combined forces with a secondary cold front moving through. This cold front produced the strongest wind gusts of the day over central and southern portions of the Panhandle as it moved through. |
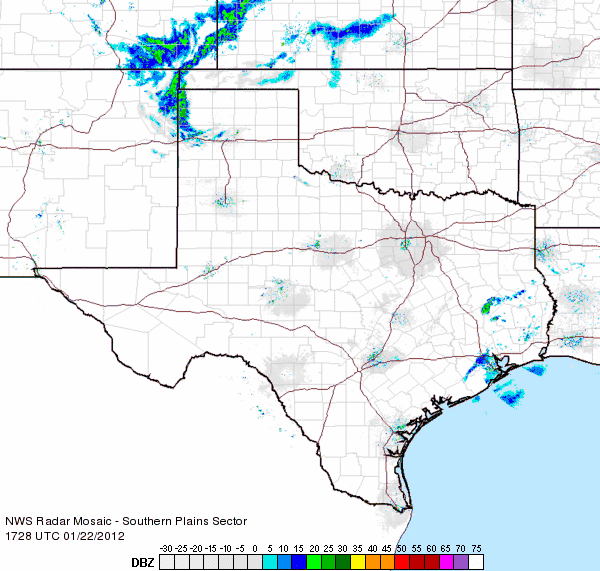 |
| Radar animation from 11:28 am to 12:38 pm on 22 January 2012. Another radar animation from 2:08 pm to 3:18 pm can be viewed HERE. |
| Below is an example of what it looked like when the blowing dust was ongoing in Lubbock. Many locations saw the visibility fall below one quarter to one half a mile, with localized spots of near zero visibility. |
 |
| View from the Science Spectrum in south Lubbock shortly after 10 am on 22 January 2012. Widespread blowing dust was already in place. |
|
The winds also caused some damage around the area including reports of downed trees and broken tree limbs, several power poles and power lines downed, a number of reports of roof damage and an overturned tractor-trailer on I-27 north of Abernathy. To view the preliminary storm reports for this event CLICK HERE. After creating all the havoc, the winds moved out just as quickly as they came in, become light by early Sunday evening. To view a page on this event composed by the Cooperative Institute for Meteorological Satellite Studies (CIMMS) at the University of Wisconsin-Madison CLICK HERE! |


