Overview & Graphics
.png) |
| 2024 finished as the warmest year on record in Chicago and tied as the second warmest year on record in Rockford (temperature records date back to 1872 for Chicago and 1905 for Rockford). Precipitation and snowfall for the year at both locations were below normal. |
CoCoRaHS Observer Annual Precipitation Summary
CoCoRaHS Observer Annual Snowfall Summary
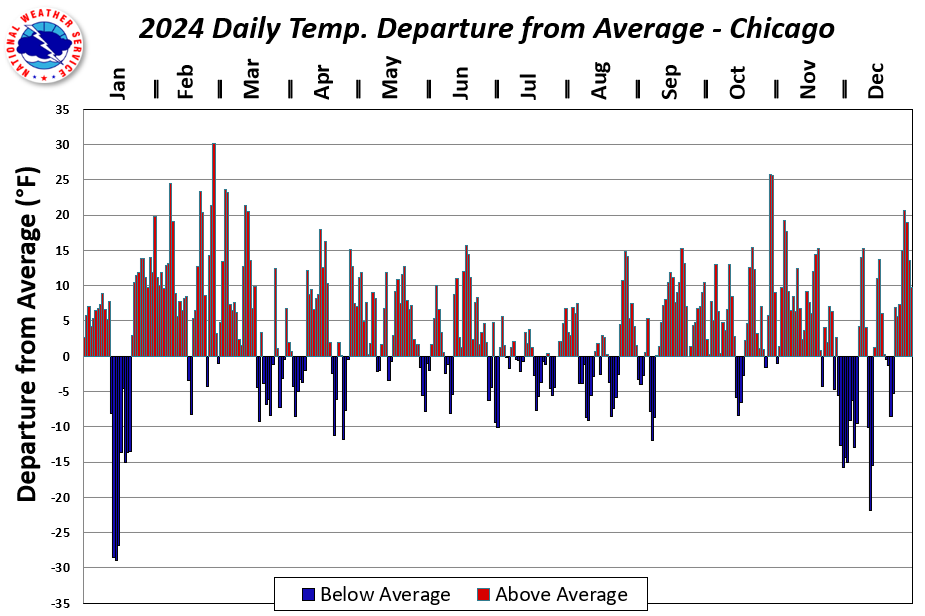 |
| Chicago (O'Hare) Daily Temperature Departures from Average in 2024 |
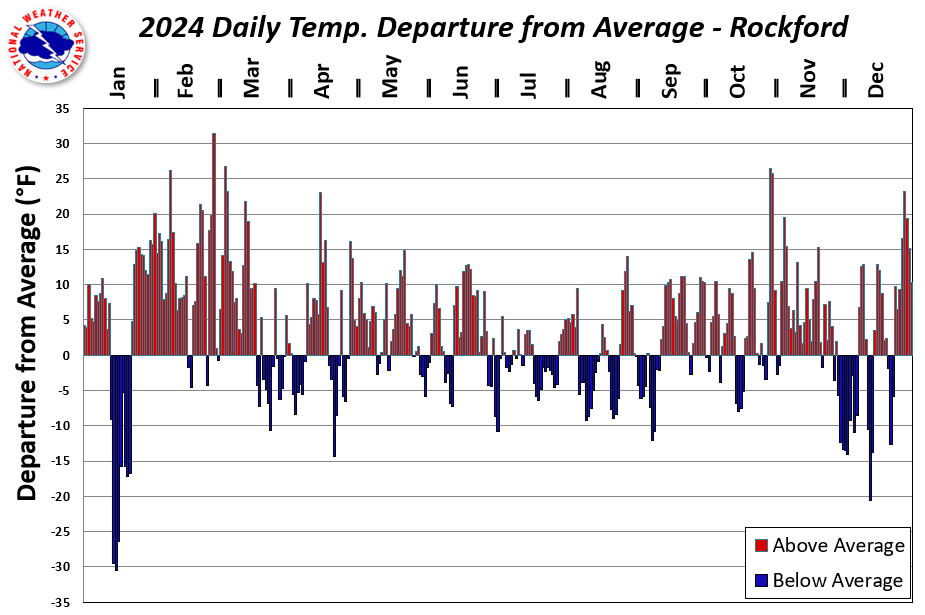 |
| Rockford Daily Temperature Departures from Average in 2024 |
Calendar Year Climate Summary for Chicago and Rockford
Public Information Statement
National Weather Service Chicago IL
131 PM CST Wed Jan 1 2025 /231 PM EST Wed Jan 1 2025/

...A Look Back at the Climate for the 2024 Calendar Year for
Chicago and Rockford...

At Chicago, the average high temperature was 63.5 degrees, which
is 4.0 degrees above normal. The average low temperature was
46.5 degrees, which is 3.5 degrees above normal. The average
temperature for the year was 55.0 degrees, which is 3.8 degrees
above normal. 34.92 inches of liquid precipitation were recorded,
which is 2.94 inches below normal. 23.6 inches of snow were
recorded, which is 14.8 inches below normal.

Below is a listing of daily temperature and precipitation
records, as well as top ten monthly, seasonal, and annual
temperature and precipitation records that were established for
Chicago in 2024...

JANUARY --
* Record daily liquid precipitation of 0.93 inches on the 9th.

FEBRUARY --
* Tied record daily high temperature of 56 degrees on the 9th.
* Record daily high temperature of 71 degrees on the 26th.
* Record daily warmest low temperature of 52 degrees on the 27th.
** Warmest February on record with an average temperature of
   39.5 degrees.

MARCH -- No daily or top ten monthly records set.

APRIL -- No daily or top ten monthly records set.

MAY -- No daily or top ten monthly records set.

JUNE --
* Record daily high temperature of 97 degrees on the 17th.
* Record daily warmest low temperature of 78 degrees on the 18th.
** Tied 10th warmest June on record with an average temperature
   of 73.9 degrees.

JULY --
* Record daily liquid precipitation of 1.60 inches on the 13th.

AUGUST --
* Tied record daily warmest low temperature of 74 degrees on the
  25th.
* Record daily warmest low temperature of 79 degrees on the 26th.
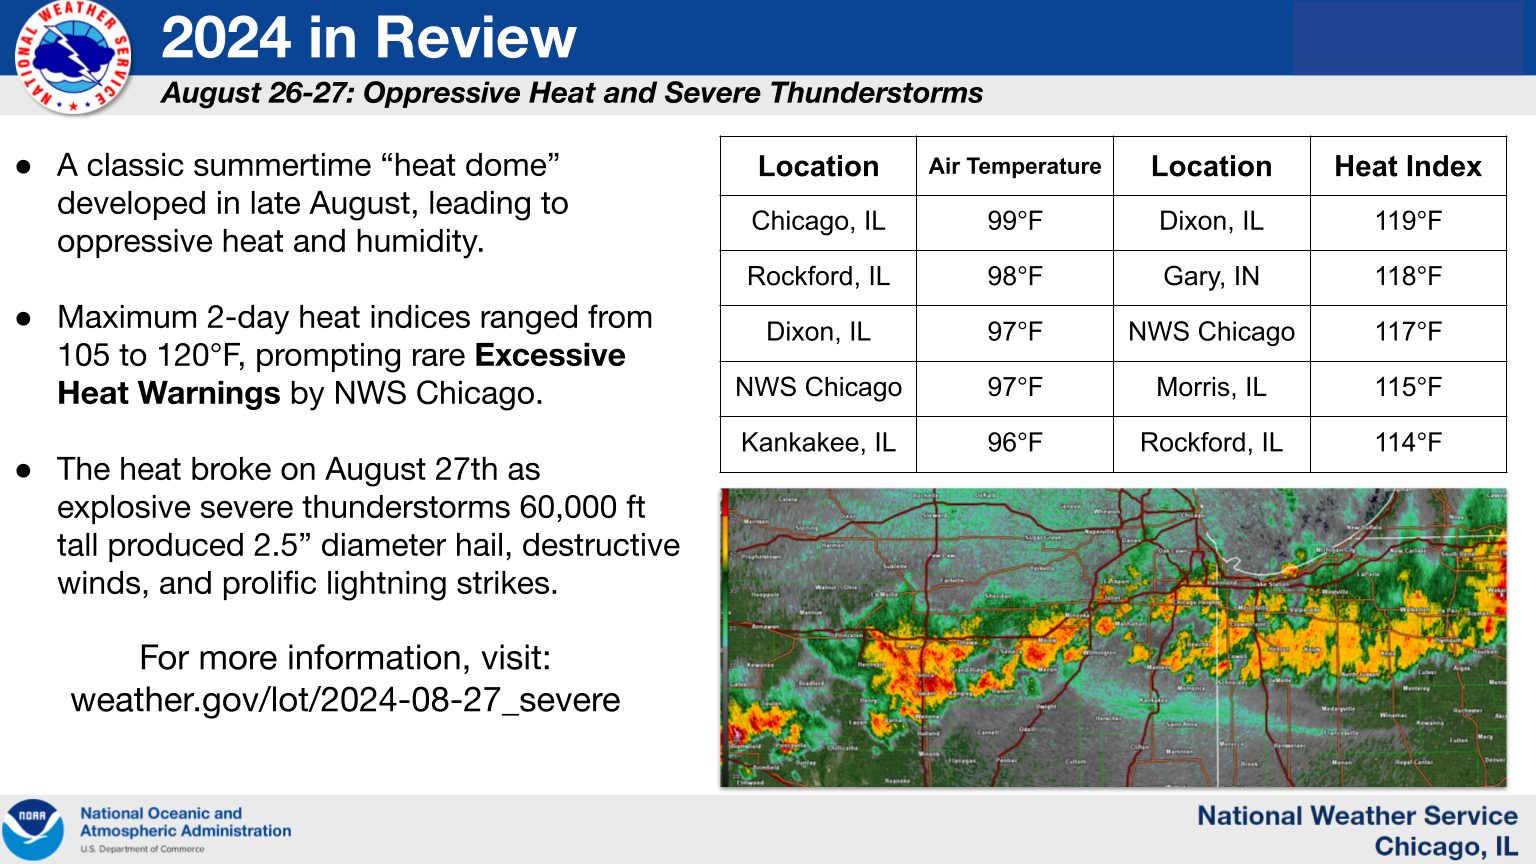
* Record daily high temperature of 99 degrees on the 27th.

SEPTEMBER --
** Tied 2nd warmest September on record with an average
   temperature of 70.6 degrees.

OCTOBER --
* Record daily high temperature of 82 degrees on the 29th.
* Record daily warmest low temperature of 67 degrees on the 29th.
* Record daily warmest low temperature of 68 degrees on the 30th.
** Tied 9th warmest October on record with an average temperature
   of 59.7 degrees.

NOVEMBER --
* Record daily warmest low temperature of 63 degrees on the 4th.
  This also tied Chicago`s all time daily warmest low temperature
  in the month of November.
* Record daily warmest low temperature of 60 degrees on the 5th.
** 9th warmest November on record with an average temperature of
   46.2 degrees.

DECEMBER -- No daily or top ten monthly records set.

SEASONAL --
* 5th warmest winter on record with an average temperature of
  34.9 degrees.
* 4th warmest spring on record with an average temperature of
  53.8 degrees.
* 3rd warmest fall on record with an average temperature of 58.8
  degrees.

ANNUAL --
* Warmest year on record with an average temperature of 55.0
  degrees.

..................................................................

At Rockford, the average high temperature was 63.3 degrees, which
is 4.5 degrees above normal. The average low temperature was
42.4 degrees, which is 2.4 degrees above normal. The average
temperature for the year was 52.8 degrees, which is 3.4 degrees
above normal. 35.49 inches of liquid precipitation were recorded,
which is 1.75 inches below normal. 28.2 inches of snow were
recorded, which is 8.9 inches below normal.

Below is a listing of daily temperature and precipitation
records, as well as top ten monthly, seasonal, and annual
temperature and precipitation records that were established for
Rockford in 2024...

JANUARY --
* Record daily coldest high temperature of -3 degrees on the
  14th.

FEBRUARY --
* Record daily high temperature of 55 degrees on the 1st.
* Record daily high temperature of 52 degrees on the 4th.
* Record daily high temperature of 59 degrees on the 8th.
* Record daily high temperature of 73 degrees on the 26th.
* Record daily high temperature of 78 degrees on the 27th. This
  was also the warmest temperature ever recorded in the month of
  February in Rockford.
* Record daily warmest low temperature of 45 degrees on the 27th.
** Warmest February on record with an average temperature of
   37.4 degrees.
** 8th driest February on record with 0.29 inches of liquid
   precipitation.
** Tied 10th least snowiest February on record with 1.0 inch of
   snow.

MARCH --
* Record daily high temperature of 75 degrees on the 3rd.
* Record daily high temperature of 75 degrees on the 4th.
* Tied record daily high temperature of 71 degrees on the 11th.
* Record daily snowfall of 5.6 inches on the 22nd.
** Tied 9th warmest March on record with an average temperature
   of 42.8 degrees.

APRIL --
* Tied record daily warmest low temperature of 59 degrees on the
  14th.

MAY --
* Record daily liquid precipitation of 1.37 inches on the 7th.

JUNE --
* Record daily warmest low temperature of 74 degrees on the 18th.
** Tied 8th warmest June on record with an average temperature of
   73.7 degrees.

JULY --
* Record daily liquid precipitation of 2.32 inches on the 13th.
** 8th wettest July on record with 7.79 inches of liquid
   precipitation.

AUGUST --
* Record daily high temperature of 98 degrees on the 27th.

SEPTEMBER -- No daily or top ten monthly records set.

OCTOBER --
* Tied record daily high temperature of 81 degrees on the 29th.
* Record daily warmest low temperature of 65 degrees on the 29th.
* Record daily warmest low temperature of 67 degrees on the 30th.

NOVEMBER --
* Tied record daily warmest low temperature of 59 degrees on the
  4th.

DECEMBER --
* Record daily warmest low temperature of 45 degrees on the 27th.

SEASONAL --
* Warmest winter on record with an average temperature of
  32.4 degrees.
* 4th warmest spring on record with an average temperature of
  52.9 degrees.
* Tied 5th warmest fall on record with an average temperature of
  55.4 degrees.

ANNUAL --
* Tied 2nd warmest year on record with an average temperature of
  52.8 degrees.

..................................................................

Chicago`s climatic period of record dates back to:
  1871 for precipitation
  1872 for temperatures
  1884 for snowfall
Rockford`s climatic period of record dates back to:
  1905 for temperatures, precipitation, and snowfall
Context for Record Warmth
Above average temperatures were the norm for much of 2024. The periods of below average temperatures tended to be short-lived and bracketed by extended periods of above to much above average temperatures. The late January through mid-March and September through late November periods featured the longest stretches of mostly above average temperatures and largest warm anomalies of the year.
Remarkably, Chicago had 5 months respectively rank as one of the top ten warmest on record, including February going down on as the warmest February on record, June tying for the 10th warmest June on record, September tying for the 2nd warmest on record, October tying for the 9th warmest October on record, and November finishing as the 9th warmest November on record. Only one month in 2024 ended up with below average temperature. That was July, which was 0.4 degrees below average.
Chicago's period of record dates back to 1871, so it is quite impressive to see so many months end up in the top ten warmest out of over 150+ years of records.
Record Number of Tornadoes
 |
By the Numbers
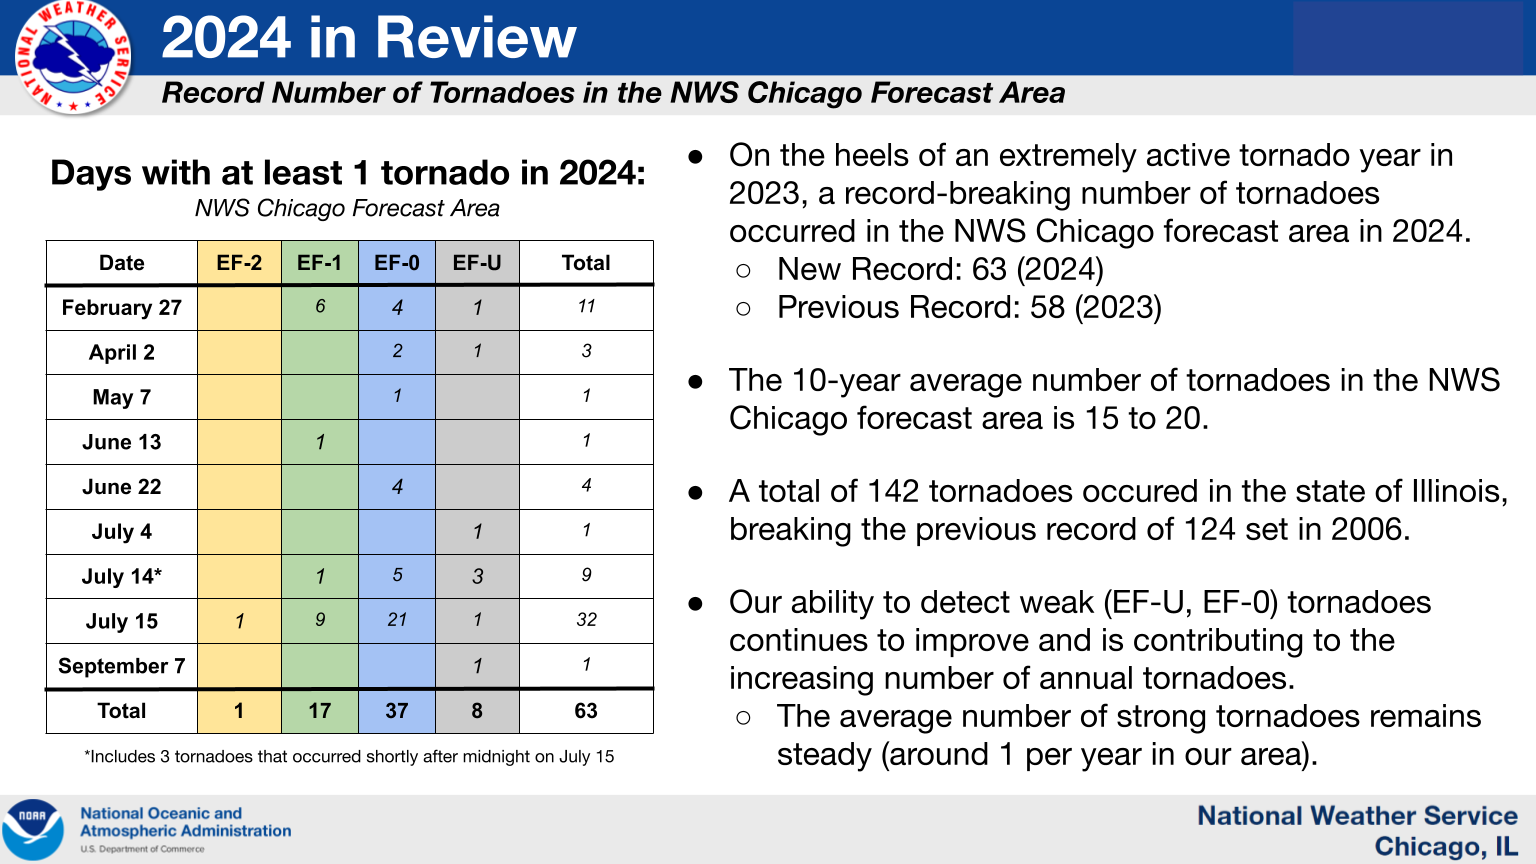
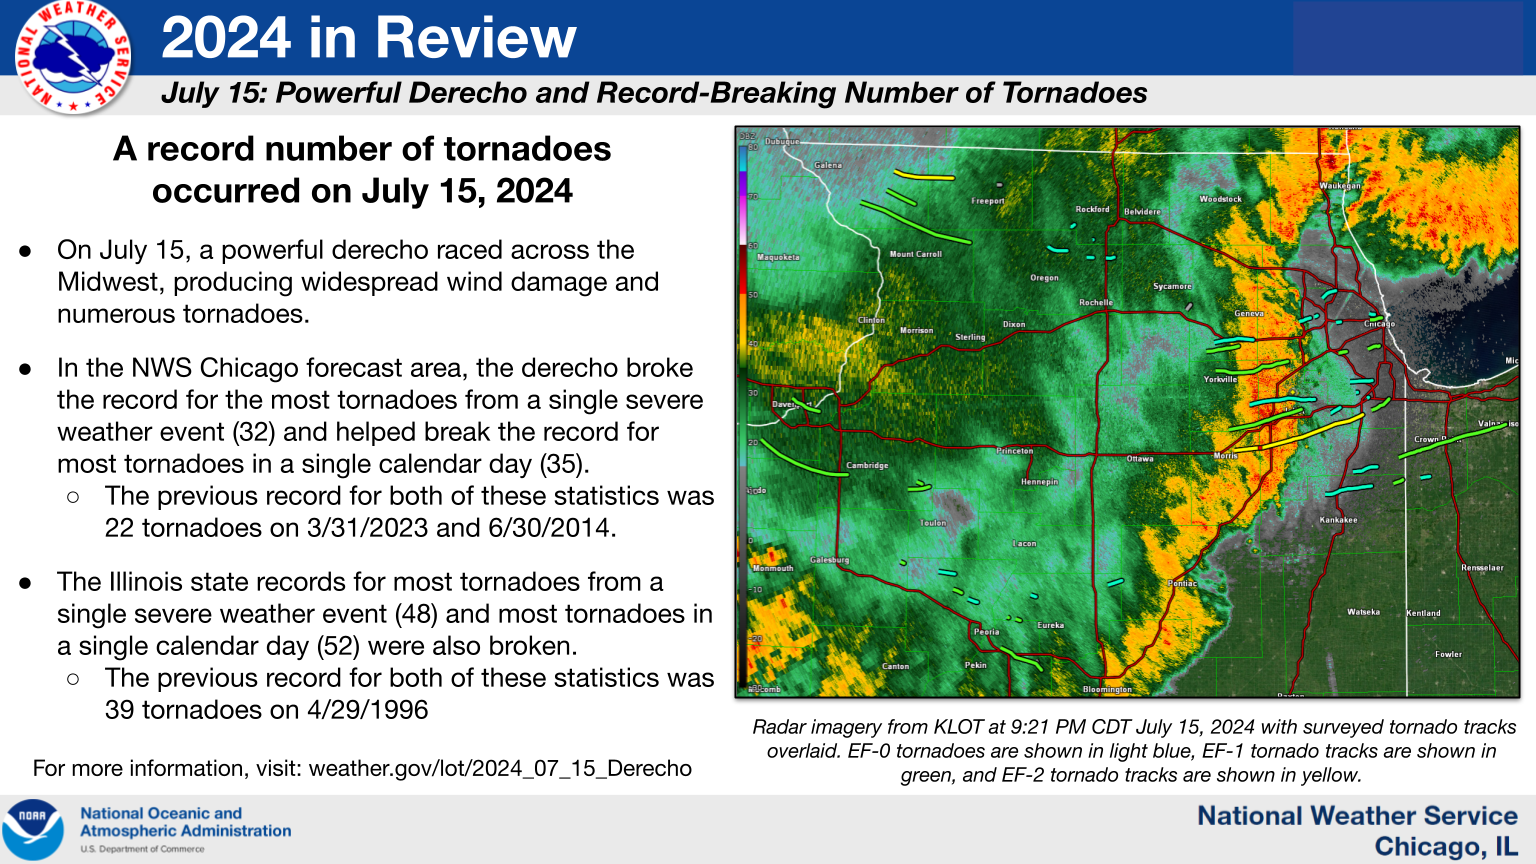
A total of 63 tornadoes were confirmed in the NWS Chicago forecast area during the 2024 calendar year. This broke the previous calendar year record of 58, which was set just last year in 2023 (official NWS tornado records date back to 1950). For reference, the 10- to 20-year average number of tornadoes in a calendar year in the NWS Chicago forecast area is around 15. Here are some other noteworthy statistics about the tornadoes from this past year:
2024 Tornado Events
There were 9 days in 2024 that featured at least 1 tornado in the NWS Chicago forecast area. You can read more about each of these severe weather events below. Events with tornadoes that were weak and brief and caused little to no damage do not have an event summary web page.
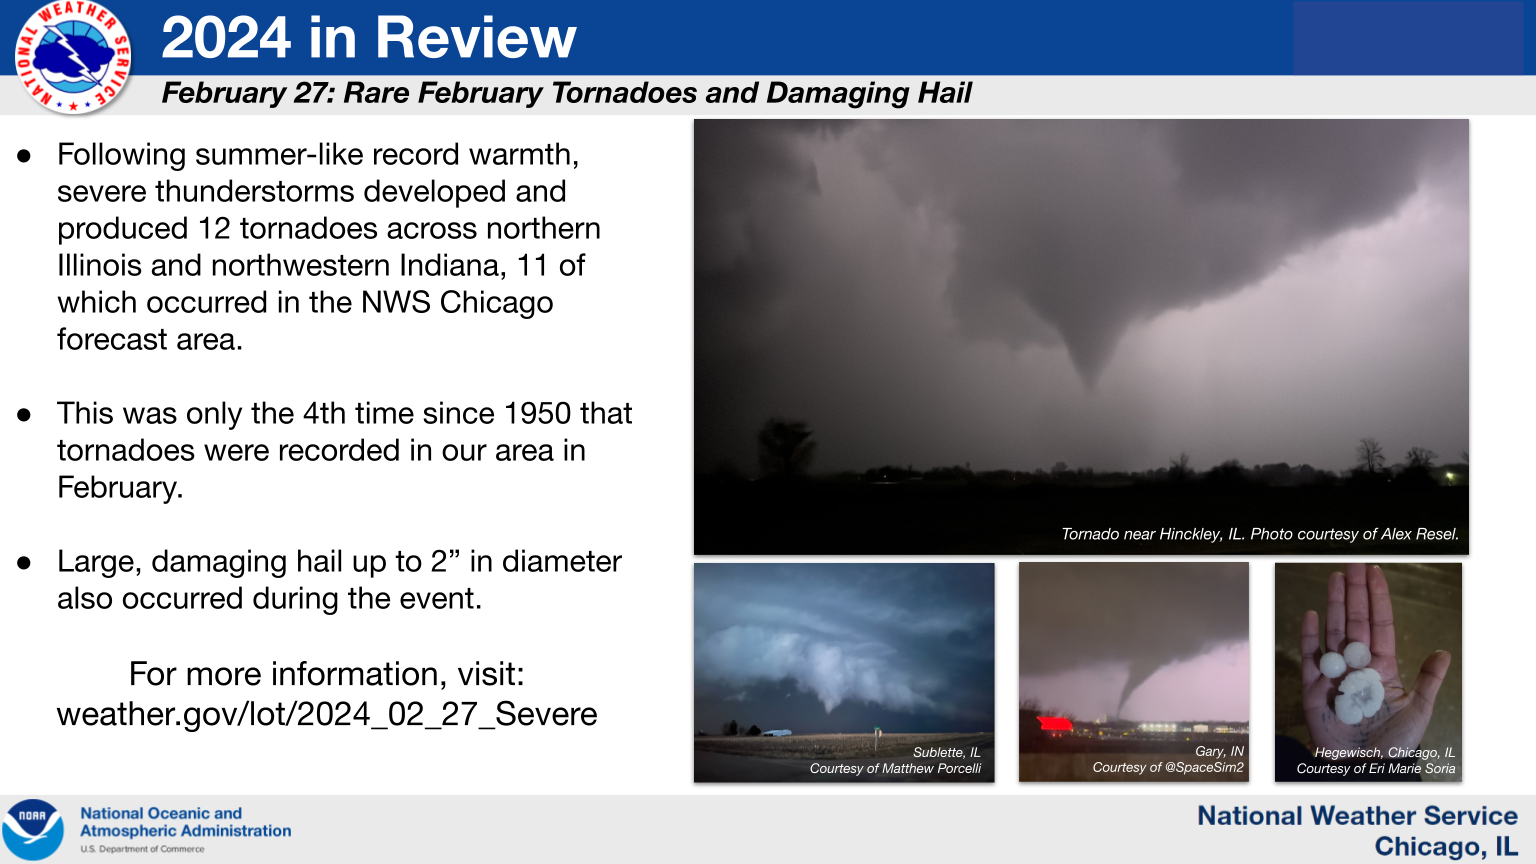
February 27th: Record number of tornadoes from an event in the month of February in the NWS Chicago forecast area
April 2nd: Three brief tornadoes (2 EF-0, 1 EF-U) in Kankakee County
May 7th: EF-0 tornado near Harvard, IL
June 13th: EF-1 tornado near Gibson City, IL
June 22nd: Four EF-0 tornadoes in the Chicago suburbs
July 4th: Brief landspout tornado in central Ford County that produced no known damage
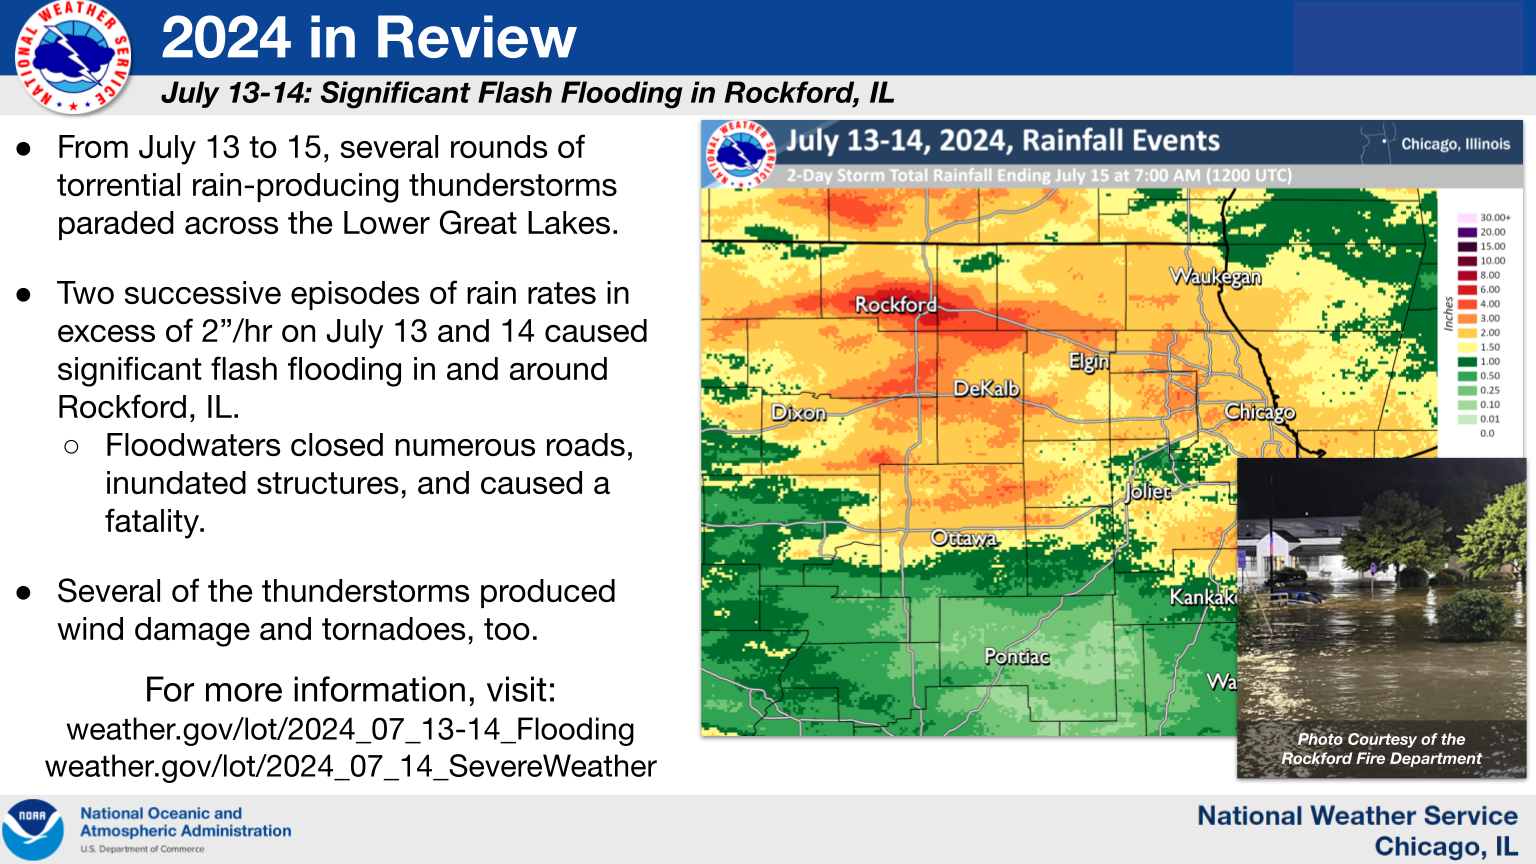
July 14th: Nine tornadoes produced by a line of storms
September 7th: Waterspout that briefly moved onshore near Beverly Shores, IN and produced no known damage
Advancements in Meteorology
The number of tornadoes that occurred in 2024 was certainly anomalous. However, the majority of tornadoes that occurred in the NWS Chicago forecast area were not considered to be "strong" (i.e. rated EF-2 or greater). While the number of such weak tornadoes has increased over the past few decades, the number of strong tornadoes per year has remained relatively steady. Why is the number of brief and weak tornadoes increasing?
1). Better understanding of the types of storms that produce tornadoes
Since the late 1900s, meteorologists have been gaining a better understanding of the types of storms that produce brief and weak tornadoes. Contrary to supercell thunderstorms, which are responsible for the majority of long-tracked, violent, and deadly tornadoes, the type of storm that often produces brief and weak tornadoes is known as a quasi-linear convective system (QLCS), or squall line. That is not to say that QLCS/squall line tornadoes are not dangerous. Rather, our understanding of how they form and the ways to detect them both in real-time and after a storm have dramatically improved. Perhaps unsurprisingly, the majority of tornadoes that occurred in the NWS Chicago forecast area in 2024 were produced by squall lines.
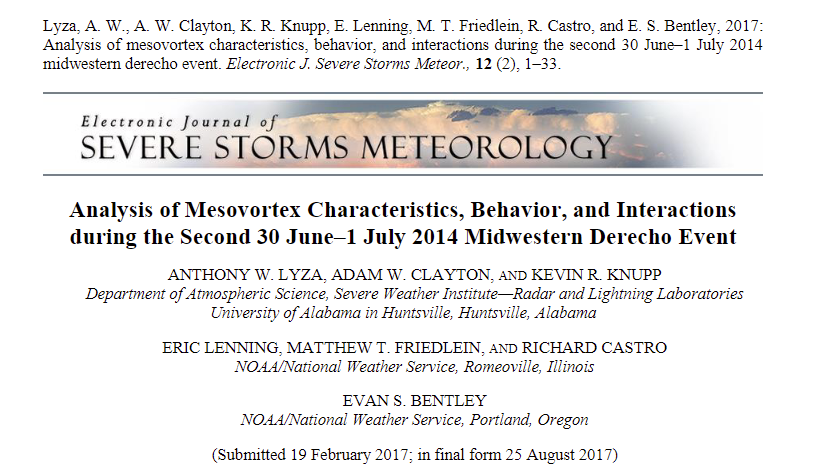 |
| Example article analyzing the characteristics of circulations that produced tornadoes during the June 30, 2014 localized tornado outbreak in northeastern Illinois and northwestern Indiana. Several staff members of NWS Chicago were co-authors of the article. Link to Article. |
2). Better capability to detect tornadoes
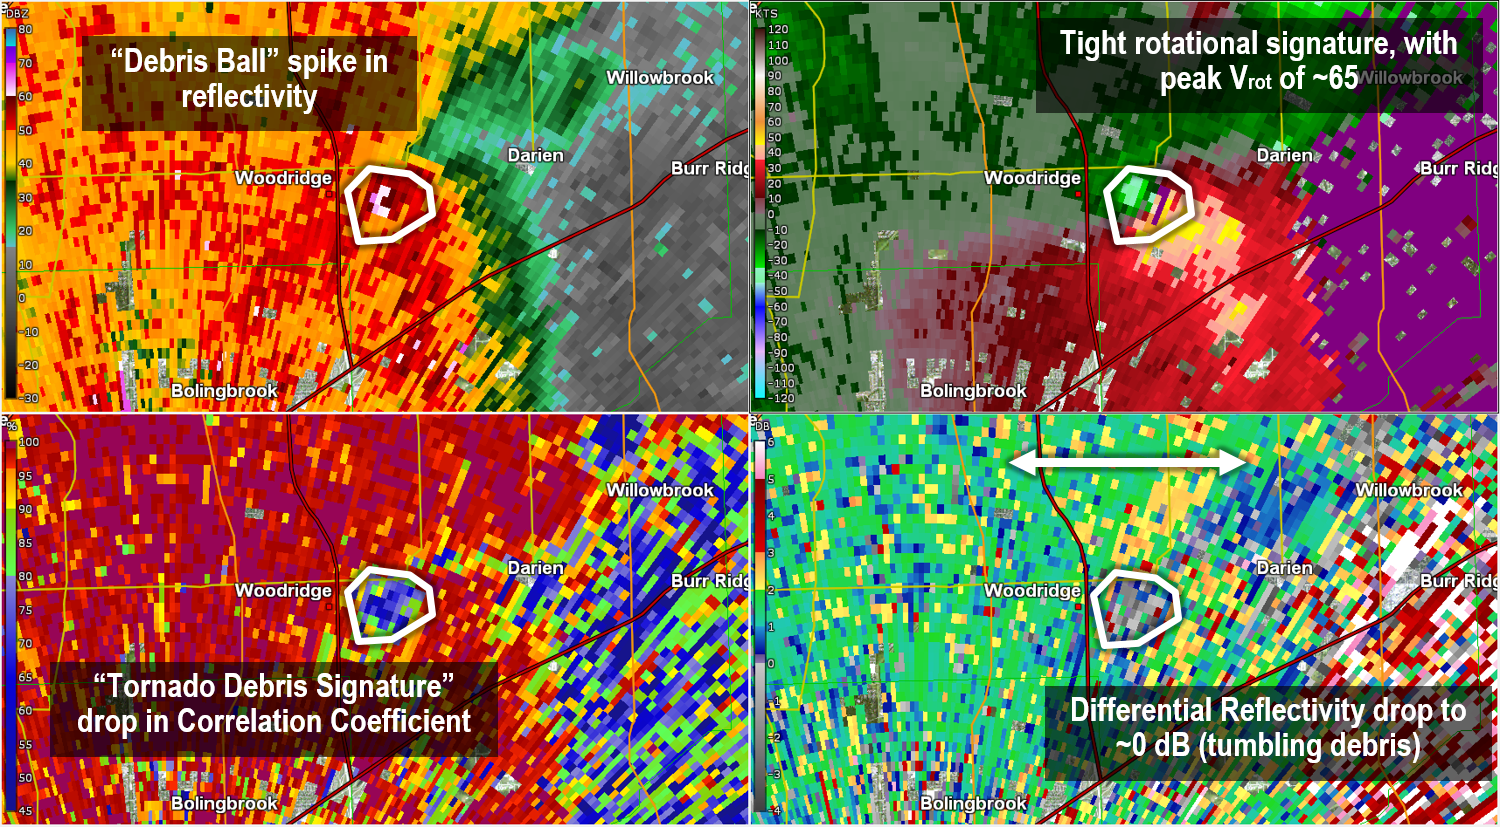
Over the past few decades, radar scanning strategies and resolution have dramatically improved the ability for meteorologists to anticipate and detect tornadoes before and while they are occurring, respectively. In the most aggressive scanning strategy, meteorologists have access to new scans at the lowest elevation in as few as 3 to 4 minutes. In addition, staff at NWS Chicago have access to data from FAA-owned and operated terminal Doppler radars TORD, TMDW, and TMKE, which can provide a new scan in as few as 60 seconds with a coverage area across most of the Chicago metropolitan area. Furthermore, the addition of dual-polarization capability to analyze the "shape" of what our radar is seeing can provide confirmation that a tornado is occurring by identifying lofted debris. As a result, NWS meteorologists sometimes know for a fact that a tornado occurred prior to receiving reports of damage! For these reasons, NWS meteorologists have a plethora of data at their fingertips to monitor and anticipate storm evolution, including detecting brief and weak tornadoes.
 |
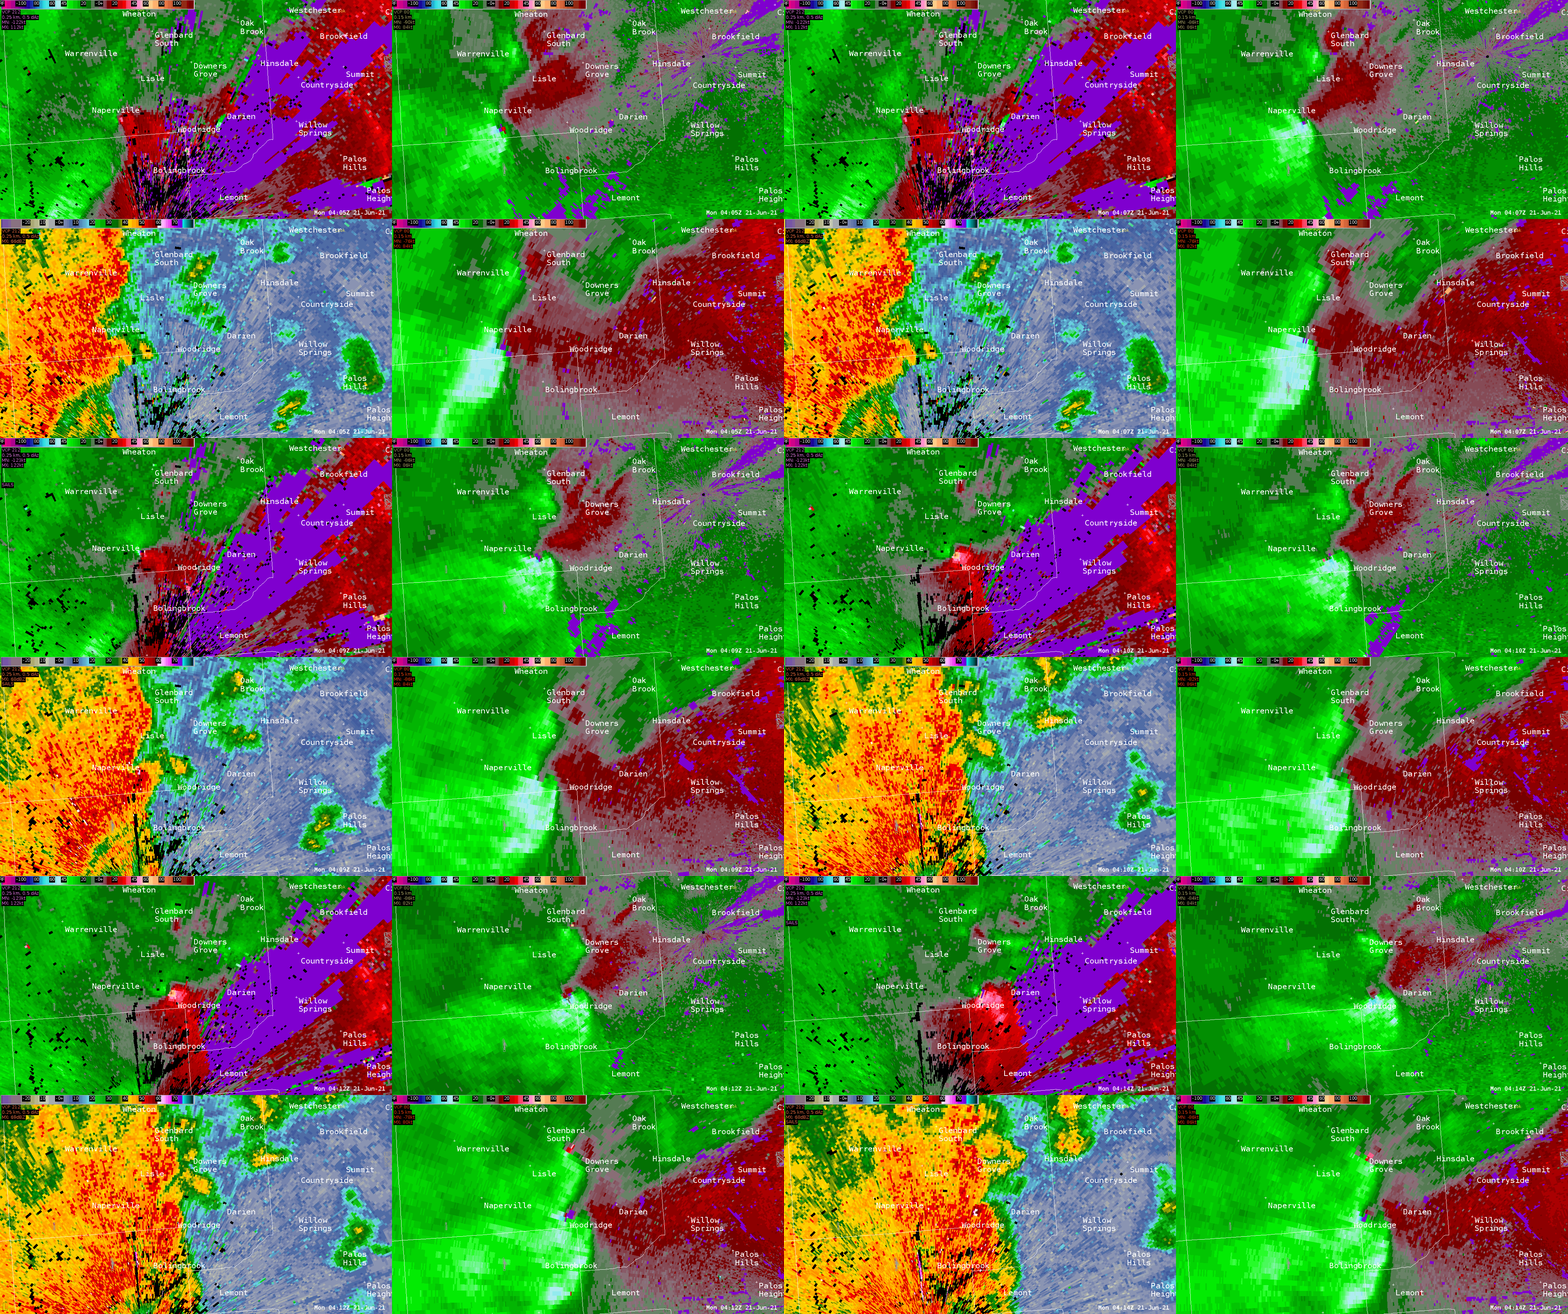 |
| Example of a "Tornado Debris Signature" using radar reflectivity, storm-relative velocity, correlation coefficient, and differential reflectivity, during the June 20, 2021 Naperville to Willow Springs EF-3 Tornado. | View of the Naperville to Willow Springs EF-3 tornado from KLOT (top left, bottom left), TORD (top right), and TMDW (bottom right), between 11:05 and 11:14 PM June 20, 2021. Note the increased temporal resolution provided by TORD and TMDW. |
3). Better methods to detect brief damage paths and collect damage reports
With the rise of social media in the past two decades came a corresponding improved ability to interact favorably with the public. Our social media channels are often a go-to resource for us to collect reports and photos of storm damage, which can then be compared to radar data to assess whether an investigation of whether a tornado occurred is needed. It is rare for notable storm damage that occurs in populated areas to go unreported to the NWS in some shape or form. Hence, it is easier to locate damage produced by brief and weak tornadoes simply through more reliable and frequent reports. In addition, NWS meteorologists have access to high-resolution satellite data that is collected after severe weather events that can be used to identify potential tornado damage paths, particularly through agricultural and rural areas. After identifying potential damage paths, NWS meteorologists often work with local Emergency Management officials to confirm that damage indeed exists, and then compare the damage path with radar data to determine if a tornado occurred. The use of drone footage is also incredibly helpful to help confirm narrow or short paths of damage in agricultural or rural areas.
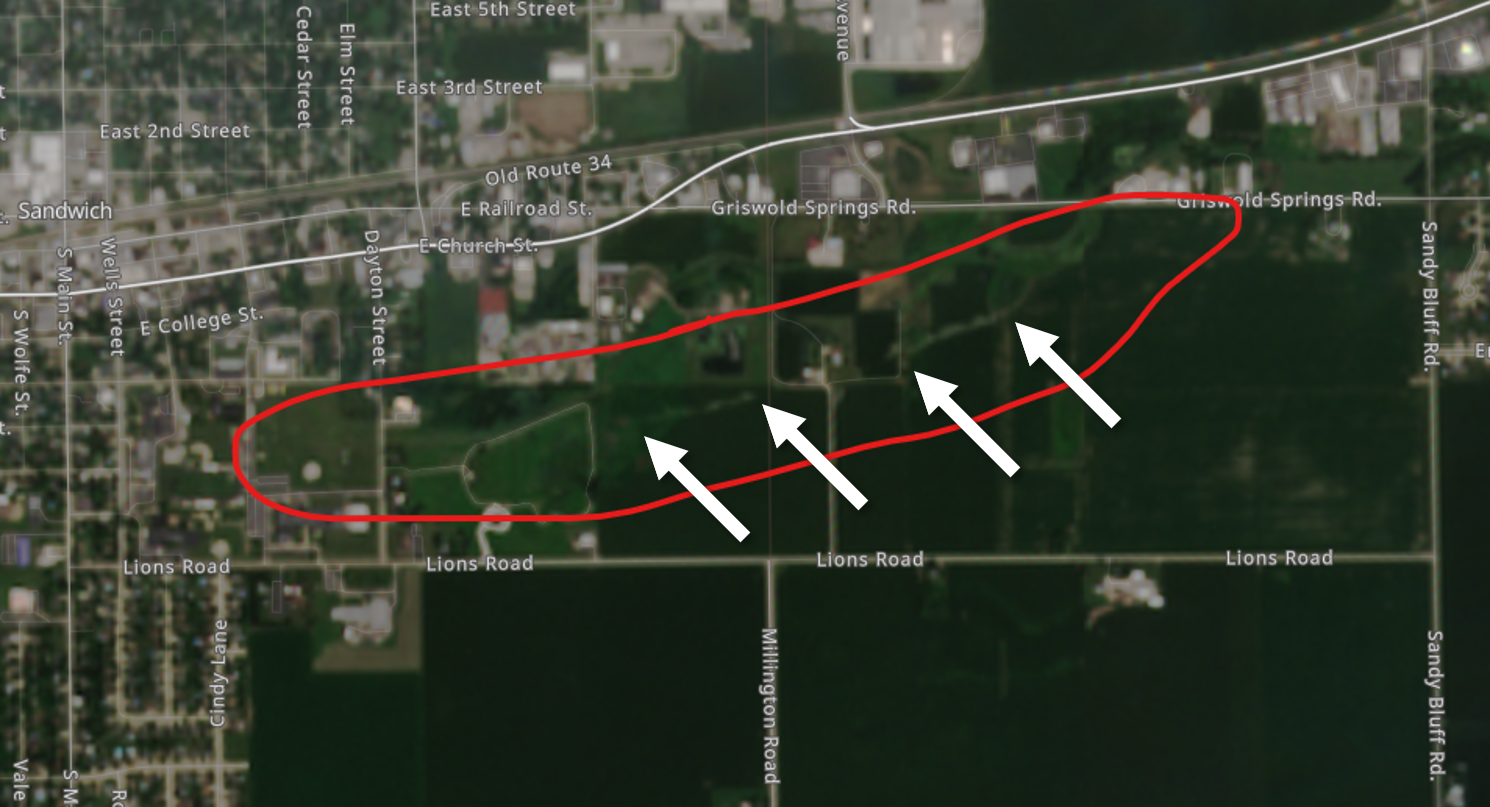 |
| Example damage path through an agricultural field near Sandwich, IL identified in Sentinel2 satellite data. The path of damage was later confirmed to be caused by an EF-0 tornado after the video footage collected from a drone that was flown along the path of damage was shared with the NWS, additional reports of damage were collected, and rotation was confirmed via radar. (July 28, 2023) |
In all, it is easier to identify, detect, and confirm brief and weak tornadoes today compared to decades of the past. For this reason, it is possible that the number of brief and weak tornadoes that occurred in prior decades were undercounted.
However, even if you remove all EF-U and EF-0 tornadoes from each year's tornado count and counted only tornadoes that were rated F-1/EF-1 or stronger (i.e. tornadoes whose counts are less likely to be affected by these advancements in meteorology and technology), 2024 still featured the third most F-1/EF-1+ tornadoes on record in a calendar year in the NWS Chicago forecast area with 18 EF-1+ tornadoes, only finishing behind the 21 EF-1+ tornadoes that occurred in 2023 and 19 F-1+ tornadoes that occurred in 1965. Thus, it was a remarkably active tornado year in northeast Illinois and northwest Indiana any way that you slice it.
Monthly & Seasonal Summaries
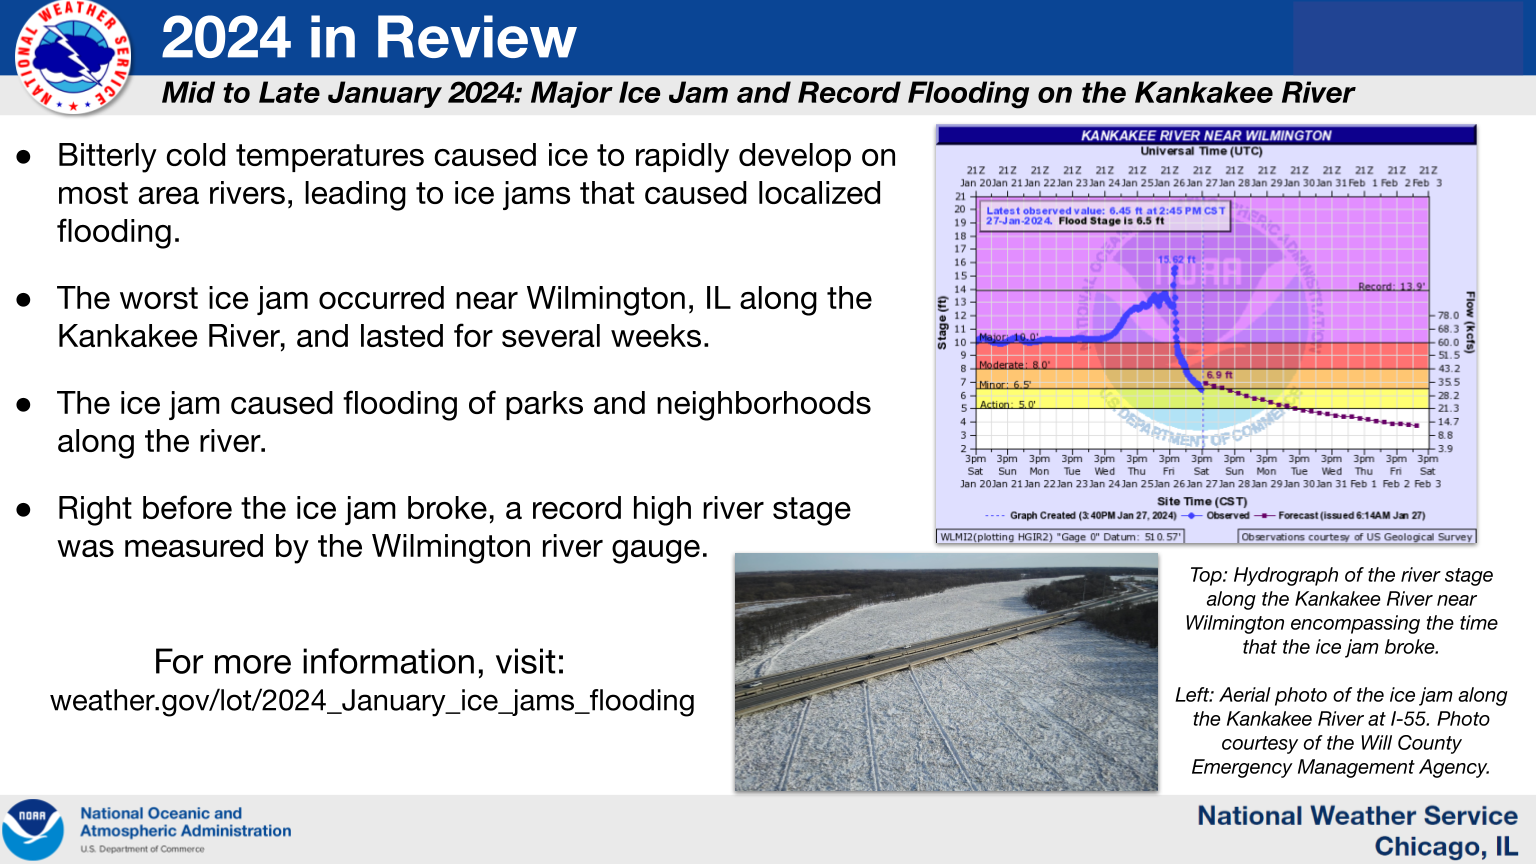
Events
 |
 |
 |
 |
 |
 |
 |
NWS Chicago Science and Past Events Page