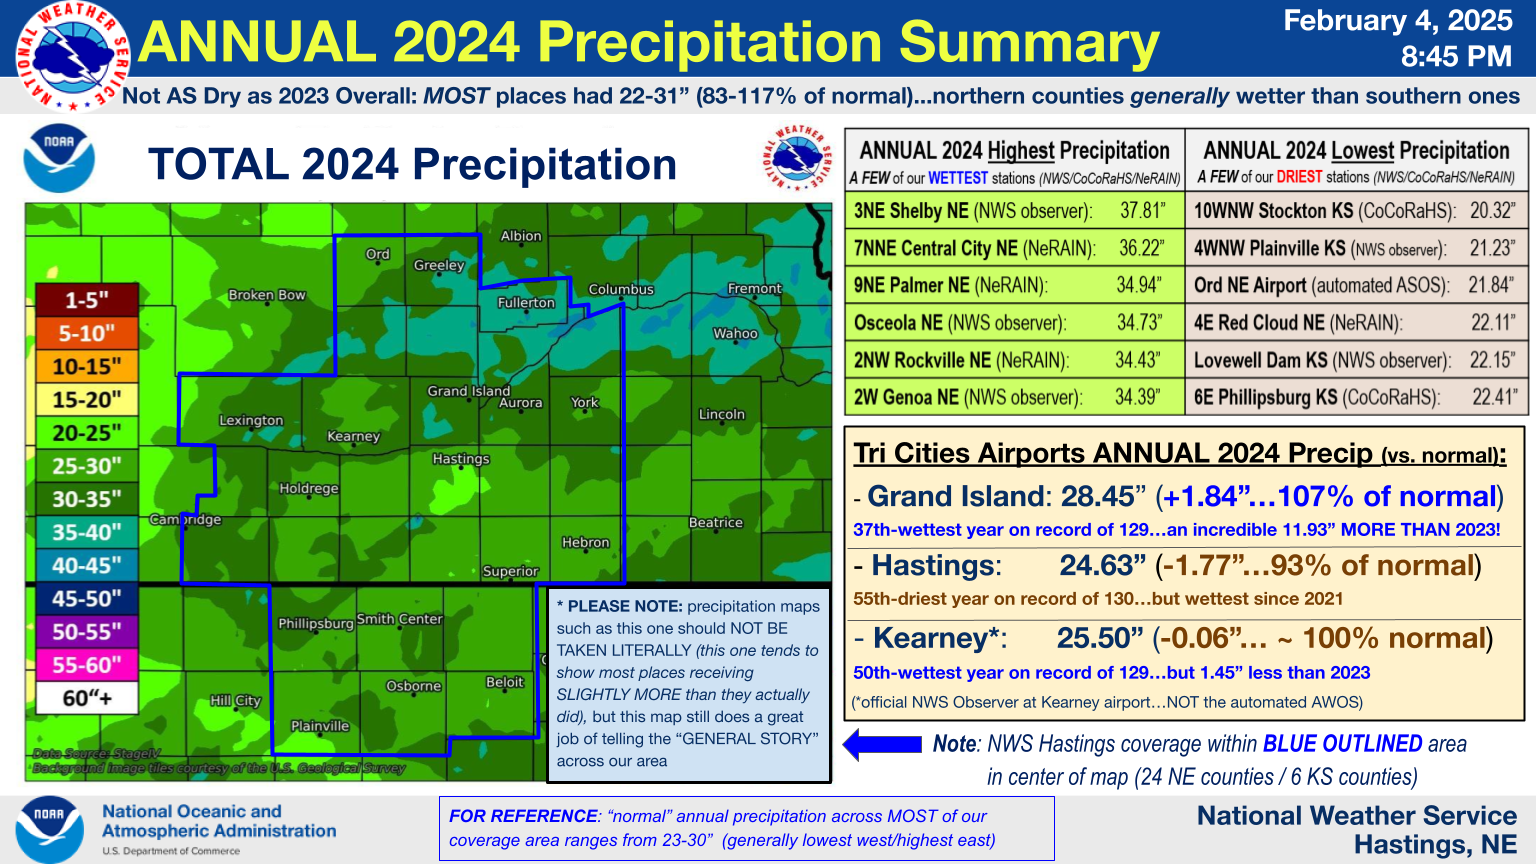
2024 Precipitation Recap for Our Entire Coverage Area...Including Map, Tables, Extremes, Tri Cities Details, etc.
(click tabs below for a wealth of 2024 precip data...including totals/extremes for not only the Tri Cities but also across our ENTIRE coverage area)
- BRIEF SUMMARY OF 2024 PRECIPITATION: |
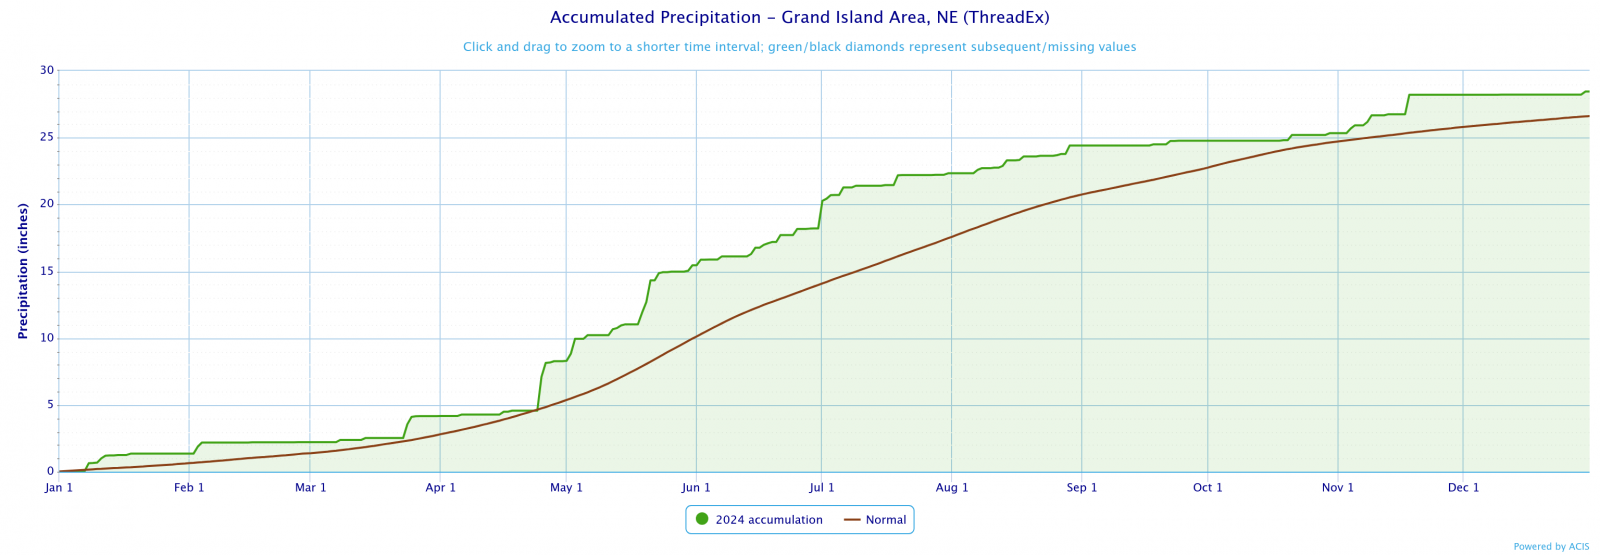
Grand Island - 2024 Monthly Data/Annual Extremes at Central Nebraska Regional Airport (GRI):
Nearly all data is from the official automated ASOS sensor. The only routine exception involves all snowfall measurements and some associated liquid equivalent (melted snow), which is measured manually by our official NWS observer near the airport. All data is collected on a "calendar day" basis (midnight-to-midnight CST).
| Grand Island (Regional Airport ASOS) - 2024 Details/Extremes | |||||||||||||
| Jan | Feb | Mar | Apr | May | Jun | Jul | Aug | Sep | Oct | Nov | Dec | 2024 | |
| Average High Temp | 28.8 | 53.6 | 55.1 | 66.9 | 74.4 | 86.6 | 86.3 | 85.6 | 84.7 | 73.6 | 51.9 | 43.3 | 65.9 |
| Average Low Temp | 13.0 | 26.4 | 29.1 | 39.6 | 51.1 | 62.1 | 62.8 | 63.1 | 56.4 | 43.4 | 30.7 | 21.0 | 41.6 |
| Overall Avg. Temperature | 20.9 | 40.0 | 42.1 | 53.2 | 62.8 | 74.4 | 74.6 | 74.4 | 70.6 | 58.5 | 41.3 | 32.1 | 53.7 |
| Departure From Normal | -5.0 | +10.3 | +1.4 | +2.2 | +0.8 | +1.6 | -2.4 | -0.2 | +4.0 | +5.4 | +1.7 | +3.2 | +1.9 |
| Precipitation | 1.35 | 0.86 | 1.95 | 4.11 | 7.18 | 2.75 | 4.13 | 2.08 | 0.36 | 0.56 | 2.88 | 0.24 | 28.45 |
| Departure From Normal | +0.74 | +0.12 | +0.56 | +1.59 | +2.48 | -1.26 | +0.62 | -1.12 | -1.64 | -1.43 | +1.78 | -0.60 | +1.84 |
| Snowfall | 17.4 | 0.3 | 4.4 | 0.0 | 0.0 | 0.0 | 0.0 | 0.0 | 0.0 | 0.0 | T | 0.5 | |
| Departure From Normal | +10.6 | -7.0 | +0.6 | -1.6 | 0.0 | 0.0 | 0.0 | 0.0 | -0.1 | -1.1 | -2.3 | -4.2 | |
| Hottest Daily HIGH Temperature: | 103°...June 24, Aug. 25 |
| Warmest Daily LOW Temperature: | 74°.....June 24 |
| Warmest Month (Avg Temp): | 74.6°....July |
| Warmest Month VERSUS NORMAL: | February...10.3° warmer than normal |
| 3rd-WARMEST FEBRUARY ON RECORD out of 129...warmest since 1954 | |
| Coldest Daily LOW Temperature: | -17°...Jan. 14 |
| Coldest Daily HIGH Temperature: | -3°...Jan. 14 |
| Coldest Month (Avg Temp): | 20.9°...January |
| Coldest Month VERSUS NORMAL: | January...5.0° colder than normal |
| Annual 2024 Average Temperature: | 53.3° (1.9º ABOVE normal) |
| 2024 was the 6th-WARMEST YEAR ON RECORD out of 129 years (warmest since 2012) | |
| Highest Daily Rainfall: | 2.53"...April 25 |
| Highest 2-Day Rainfall: | 3.57"...April 25-26 |
| Wettest Calendar Months: | May: 7.18"...July: 4.13" |
| Driest Calendar Months: | December: 0.24"...September: 0.36" |
| TIED 5th-DRIEST SEPTEMBER ON RECORD out of 129...driest since 1998 | |
| Annual 2024 Precipitation: | 28.45" (1.84" ABOVE normal / 107% of normal) |
| *** In 2024, Grand Island received 11.93" MORE PRECIPITATION THAN DURING 2023 ! *** | |
| Highest Calendar Day Snowfall: | 7.0"...Jan. 8 |
| Highest 2-Day Snowfall: | 7.5"...Jan. 8-9 |
| Deepest Snow Depth (6 AM CST): | 10"...Jan. 13 |
| Snowiest Calendar Month: | January...17.4" |
| 5th-SNOWIEST JANUARY ON RECORD out of 123...most since 2011 | |
| Highest Wind Gust: | 65 MPH on May 3...out of the north during a severe storm |
 |
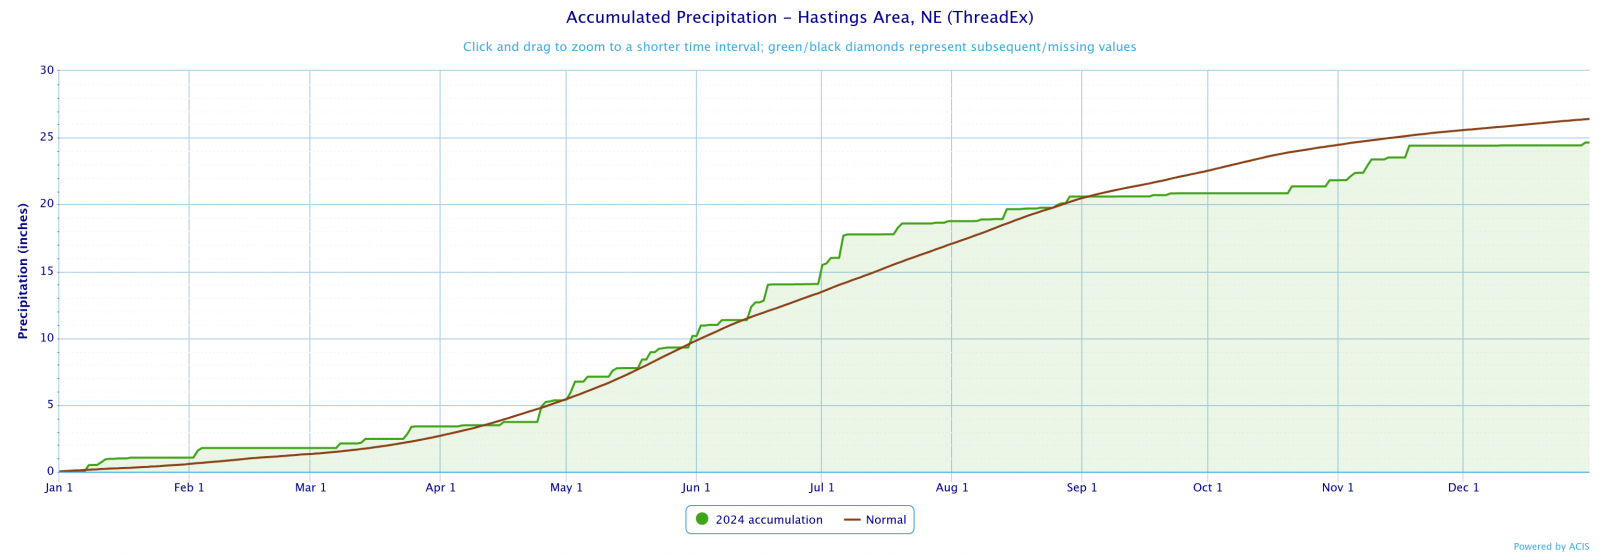
Hastings - 2024 Monthly Data/Annual Extremes at Hastings Municipal Airport (HSI):
Nearly all data is from the official automated ASOS sensor. The only routine exception involves all snowfall measurements and most associated snowfall liquid equivalent (melted snow), which is measured manually here at NWS Hastings. All data is collected on a "calendar day" basis (midnight-to-midnight CST).
| Hastings (Municipal Airport ASOS) - 2024 Details/Extremes | |||||||||||||
| Jan | Feb | Mar | Apr | May | Jun | Jul | Aug | Sep | Oct | Nov | Dec | 2024 | |
| Average High Temp | 28.6 | 53.1 | 54.3 | 66.3 | 73.8 | 85.6 | 85.7 | 84.9 | 83.9 | 73.5 | 52.6 | 44.1 | 65.5 |
| Average Low Temp | 13.2 | 26.8 | 29.2 | 40.1 | 51.5 | 62.7 | 63.5 | 63.5 | 57.2 | 44.3 | 32.5 | 22.4 | 42.3 |
| Overall Avg. Temperature | 20.9 | 39.9 | 41.7 | 53.2 | 62.6 | 74.2 | 74.6 | 74.2 | 70.6 | 58.9 | 42.6 | 33.3 | 53.9 |
| Departure From Normal | -5.5 | +9.9 | +0.8 | +2.2 | +0.8 | +1.5 | -2.4 | -0.3 | +4.2 | +5.7 | +2.9 | +4.1 | +2.0 |
| Precipitation | 1.05 | 0.72 | 1.62 | 1.95 | 4.82 | 3.89 | 4.70 | 1.84 | 0.24 | 0.98 | 2.59 | 0.23 | 24.63 |
| Departure From Normal | +0.50 | -0.03 | +0.29 | -0.75 | +0.47 | +0.22 | +1.08 | -1.58 | -1.82 | -0.98 | +1.46 | -0.63 | -1.77 |
| Snowfall | 15.6 | 0.1 | 5.3 | 0.0 | T (hail) | 0.0 | 0.0 | 0.0 | 0.0 | 0.0 | 0.0 | 0.5 | |
| Departure From Normal | +9.1 | -7.4 | +1.5 | -1.7 | 0.0 | 0.0 | 0.0 | 0.0 | 0.0 | -1.2 | -2.3 | -5.1 | |
| Hottest Daily HIGH Temperature: | 101°...June 24 |
| Warmest Daily LOW Temperature: | 72°....June 28 |
| Warmest Month (Avg Temp): | 74.6°....July |
| Warmest Month VERSUS NORMAL: | February...9.9° warmer than normal |
| 3rd-WARMEST FEBRUARY ON RECORD out of 112...warmest since 1954 | |
| Coldest Daily LOW Temperature: | -16°...Jan. 13 |
| Coldest Daily HIGH Temperature: | -2°....Jan. 13, Jan. 14 |
| Coldest Month (Avg Temp): | 20.9°....January |
| Coldest Month VERSUS NORMAL: | January...5.5° colder than normal |
| Annual 2024 Average Temperature: | 53.9° (2.0º ABOVE normal) |
| 2024 tied with 2016/1941 for 10th-WARMEST YEAR ON RECORD out of the 98 years with no more than 30 days of incomplete temperature data |
|
| Highest Daily Rainfall: | 1.66"...July 6 |
| Highest 2-Day Rainfall: | 1.76"...July 6-7 |
| Wettest Calendar Months: | May: 4.82"...July: 4.70" |
| Driest Calendar Months: | December: 0.23"...September: 0.24" |
| 3rd-DRIEST SEPTEMBER ON RECORD out of 129...driest since 1991 | |
| Annual 2024 Precipitation: | 24.63" (1.77" BELOW normal / 93% of normal) |
| In 2024, Hastings received 3.82" MORE PRECIPITATION THAN DURING 2023 | |
| Highest Calendar Day Snowfall: | 6.1"...Jan. 8 |
| Highest 2-Day Snowfall: | 7.2"...Jan. 11-12 |
| Deepest Snow Depth (6 AM CST): | 10"...Jan. 13 |
| Snowiest Calendar Month: | January...15.6" |
| 6th-SNOWIEST JANUARY ON RECORD out of 123...most since 2011 | |
| Highest Wind Gust: | 69 MPH on July 6...out of the west during a severe storm |
 |
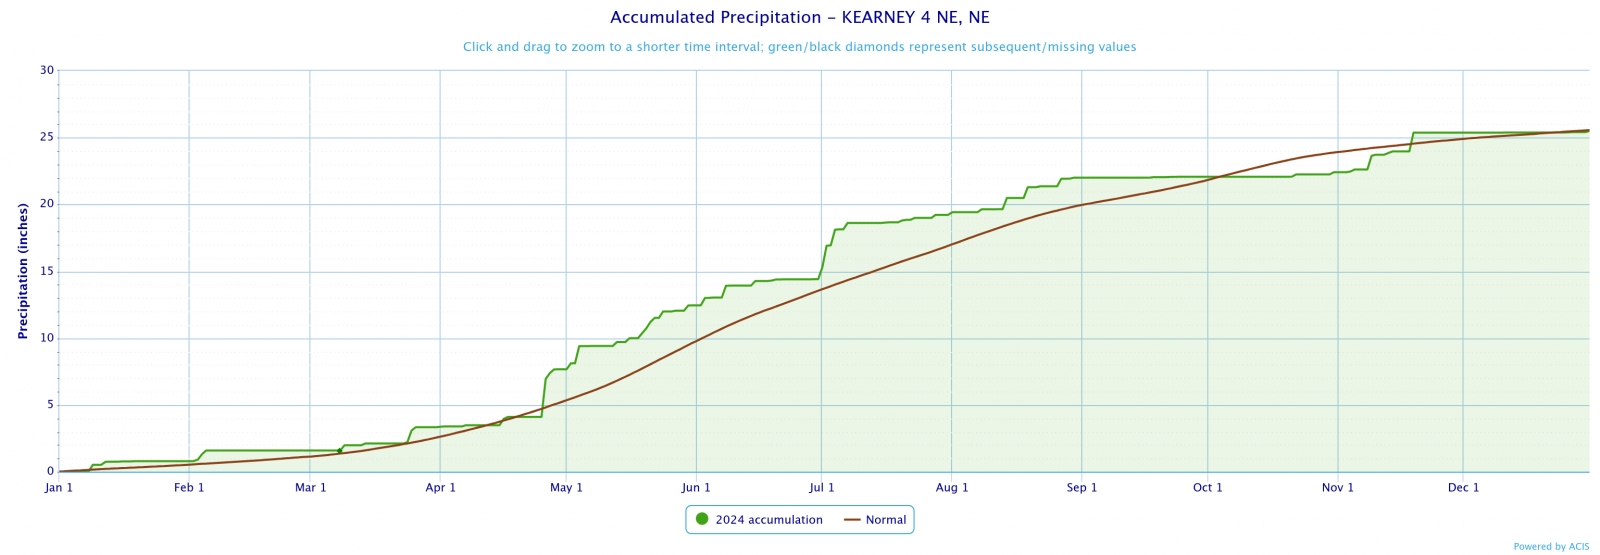
Kearney - 2024 Monthly Data/Annual Extremes from NWS COOP Observer at Kearney Airport (KRNN1):
| Kearney Airport (NWS COOP Observer) - 2024 Details/Extremes | |||||||||||||
| Jan | Feb | Mar | Apr | May | Jun | Jul | Aug | Sep | Oct | Nov | Dec | 2024 | |
| Average High Temp | 28.6 | 52.9 | 54.5 | 64.5 | 73.9 | 86.3 | 85.8 | 85.3 | 84.0 | 73.2 | 52.9 | 45.4 | 65.6 |
| Average Low Temp | 11.9 | 25.4 | 26.6 | 36.9 | 49.3 | 61.3 | 61.7 | 62.1 | 54.4 | 41.3 | 30.6 | 20.7 | 40.2 |
| Overall Avg. Temperature | 20.3 | 39.2 | 40.5 | 50.7 | 61.6 | 73.8 | 73.7 | 73.7 | 69.2 | 57.2 | 41.8 | 33.0 | 52.9 |
| Departure From Normal | -4.5 | +11.1 | +2.2 | +2.1 | +2.1 | +3.4 | -1.1 | +1.1 | +4.7 | +5.9 | +3.9 | +5.6 | +3.1 |
| Precipitation | 0.79 | 0.80 | 1.74 | 4.34 | 4.78 | 1.96 | 4.81 | 2.78 | 0.07 | 0.34 | 2.96 | 0.13 | 25.50 |
| Departure From Normal | +0.28 | +0.21 | +0.28 | +1.66 | +0.38 | -1.94 | +1.45 | -0.23 | -1.77 | -1.79 | +1.96 | -0.55 | -0.06 |
| Snowfall | 10.3 | Trace | 8.9 | 0.0 | 0.0 | 0.0 | 0.0 | 0.0 | 0.0 | 0.0 | Trace | 0.4 | |
| Departure From Normal | +6.6 | -5.6 | +5.4 | -1.9 | -0.1 | 0.0 | 0.0 | 0.0 | 0.0 | -0.8 | -2.8 | -3.0 | |
| Hottest Daily HIGH Temperature: | 103°...reported June 25 (actually occurred June 24) |
| Warmest Daily LOW Temperature: | 70°....reported June 28 |
| Warmest Month (Avg Temp): | 73.8°....June |
| Warmest Month VERSUS NORMAL: | February...11.1° warmer than normal |
| 3rd-WARMEST FEBRUARY ON RECORD out of 119...warmest since 1954 | |
| Coldest Daily LOW Temperature: | -14°...reported Jan. 14 |
| Coldest Daily HIGH Temperature: | -7°... reported Jan. 14 (actually occurred Jan. 13) |
| Coldest Month (Avg Temp): | 20.3°....January |
| Coldest Month VERSUS NORMAL: | January...4.5° colder than normal |
| Annual 2024 Average Temperature: | 52.9° (3.1º ABOVE normal) |
| 2024 tied with 2012/1954 for 4th-WARMEST YEAR ON RECORD out of the 102 years with no more than 30 days of incomplete temperature data |
|
| Highest 24-Hour Rainfall (7am-7am) | 2.85"...reported April 26 |
| Highest 48-Hour Rainfall (7am-7am): | 3.28"...reported April 26-27 |
| Wettest Calendar Months: | July: 4.81"...May: 4.78" |
| Driest Calendar Months: | September: 0.07"...December: 0.13" |
| 2nd-DRIEST SEPTEMBER ON RECORD out of 130...driest since 1984 | |
| Annual 2024 Precipitation: | 25.50" (0.06" BELOW normal / 99.8% of normal) |
| In 2024, Kearney received 1.45" LESS PRECIPITATION THAN DURING 2023 | |
| Highest 24-Hour Snowfall (7am-7am): | 5.4"...reported Jan. 9 |
| Highest 48-Hour Snowfall (7am-7am): | 5.4"...reported Jan. 9 (same as highest 24-hour) |
| Deepest Snow Depth (7 AM CST): | 7"...Jan. 12-14 |
| Snowiest Calendar Month: | 10.3"...January |
 |
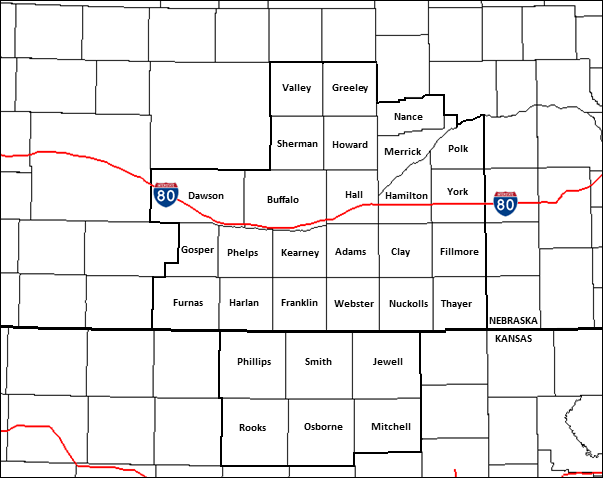
2024 SOUTH CENTRAL/CENTRAL NEBRASKA
NWS COOPERATIVE OBSERVER PRECIPITATION
(for 24 counties in the NWS Hastings coverage area)
The highest reported amount under each month indicated in BLUE, the lowest amount in RED.
M indicates incomplete/missing data
According to 30-year NCEI "normals" (1991-2020), annual precipitation across this 24-county area generally ranges from 23-30", with the lowest part of this range including far western locations such as Gothenburg/Cambridge, and the highest part of this range including far eastern locations near Highway 81 such as York/Hebron.
| Station | Jan | Feb | Mar | Apr | May | Jun | July | Aug | Sep | Oct | Nov | Dec | 2024 Total |
| Arcadia 2W | 0.66 | 0.59 | 1.51 | 3.46 | 5.20 | 4.59 | 4.06 | 1.12 | 0.01 | 0.15 | 1.64 | 0.14 | 23.13 |
| Beaver City | 0.37 | 1.19 | 1.88 | 3.18 | 5.50 | 3.09 | 2.45 | 3.76 | 0.50 | 1.11 | 2.84 | T | 25.87 |
| Belgrade | 1.02 | 0.72 | 1.73 | 2.73 | 6.83 | 7.80 | 4.76 | 3.79 | 0.88 | 0.36 | 2.68 | 0.41 | 33.71 |
| Blue Hill 4SW | 1.07 | 0.89 | 1.89 | 1.10 | 5.00 | 3.58 | 4.42 | 3.24 | 0.54 | 1.50 | 2.93 | 0.15 | 26.31 |
| Bradshaw | 1.07 | 0.68 | 1.24 | 3.19 | 4.22 | 3.63 | 3.34 | 3.91 | 0.05 | 1.77 | 2.53 | 0.47 | 26.10 |
| Cambridge | 0.40 | 0.78 | 0.70 | 3.31 | 4.67 | 2.71 | 5.04 | 4.68 | 0.66 | 0.45 | 2.52 | 0.00 | 25.92 |
| Lexington 6SSE (Canaday) | 0.38 | 1.36 | 1.08 | 4.46 | 5.64 | 2.06 | 5.60 | 4.01 | 0.59 | 1.17 | 2.22 | T | 28.57 |
| Central City | 1.58 | 0.75 | 1.24 | 3.26 | 6.58 | 6.37 | 5.50 | 2.66 | 0.59 | 0.72 | 3.13 | 0.34 | 32.72 |
| Clay Center 6ESE | 1.98 | 1.05 | 1.35 | 1.78 | 4.22 | 5.25 | 3.74 | 2.16 | 0.26 | 2.11 | 2.82 | 0.28 | 27.00 |
| Clay Center | 1.35 | 0.74 | 1.39 | 1.67 | 3.74 | 5.45 | 4.73 | 1.98 | 0.25 | 1.92 | 3.11 | 0.27 | 26.60 |
| Edison | 0.33 | 1.13 | 1.39 | 3.40 | 3.78 | 2.40 | 2.77 | 4.17 | 0.49 | 0.93 | 2.26 | T | 23.05 |
| Elwood 8S | 0.32 | 1.15 | 1.59 | 4.57 | 3.70 | 2.21 | 4.05 | 3.73 | 0.63 | 1.14 | 2.59 | T | 25.68 |
| Genoa 2W | 1.13 | 0.69 | 1.39 | 4.03 | 7.87 | 8.25 | 4.15 | 3.31 | 0.08 | 0.67 | 2.21 | 0.61 | 34.39 |
| Gothenburg | 0.55 | 1.54 | 1.53 | 4.10 | 4.98 | 4.52 | 3.42 | 2.40 | 0.25 | 0.89 | 1.98 | 0.01 | 26.17 |
| Grand Island Airport | 1.35 | 0.86 | 1.95 | 4.11 | 7.18 | 2.75 | 4.13 | 2.08 | 0.36 | 0.56 | 2.88 | 0.24 | 28.45 |
| Greeley | 0.47 | 0.83 | 1.46 | 4.46 | 6.54 | 4.26 | 4.46 | 2.98 | 0.15 | 0.12 | 2.98 | 0.31 | 29.02 |
| Gresham 3W | 1.40 | 0.57 | 1.22 | 3.68 | 5.51 | 5.84 | 3.96 | 1.91 | 0.28 | 1.06 | 2.62 | 0.64 | 28.69 |
| Harlan County Lake | 0.39 | 1.34 | 1.33 | 3.16 | 6.55 | 4.17 | 2.27 | 3.32 | 0.37 | 0.75 | 3.43 | T | 27.08 |
| Hastings Airport | 1.05 | 0.72 | 1.62 | 1.95 | 4.82 | 3.89 | 4.70 | 1.84 | 0.24 | 0.98 | 2.59 | 0.23 | 24.63 |
| Hastings NWS Office | 1.05 | 0.88 | 1.97 | 2.87 | 4.47 | 3.86 | 5.13 | 1.56 | 0.40 | 0.88 | 2.54 | 0.26 | 25.87 |
| Hebron | 1.47 | 0.93 | 0.70 | 1.40 | 4.44 | 3.37 | 3.14 | 2.96 | 0.25 | 0.57 | 3.36 | 0.89 | 23.48 |
| Holdrege | 0.62 | 1.33 | 1.18 | 3.58 | 5.07 | 2.25 | 5.27 | 3.41 | 0.23 | 0.56 | 2.97 | 0.04 | 26.51 |
| Hubbell | 1.66 | 1.00 | 0.89 | 1.43 | 4.86 | 5.44 | 3.23 | 1.75 | 0.26 | 0.87 | 3.24 | 0.80 | 25.43 |
| Kearney Airport | 0.79 | 0.80 | 1.74 | 4.34 | 4.78 | 1.96 | 4.81 | 2.78 | 0.07 | 0.34 | 2.96 | 0.13 | 25.50 |
| Loup City | 0.68 | 0.65 | 1.13 | 4.05 | 7.46 | 4.36 | 5.16 | 1.96 | 0.05 | 0.31 | 2.46 | 0.12 | 28.39 |
| Miller | 0.75 | 1.31 | 1.66 | 4.32 | 4.90 | 3.65 | 5.65 | 3.07 | 0.21 | 0.45 | 2.43 | 0.15 | 28.55 |
| Minden | 0.76 | 1.07 | 1.08 | 3.28 | 4.34 | 3.69 | 4.57 | 2.90 | 0.54 | 0.30 | 3.94 | T | 26.47 |
| Naponee | 0.71 | 1.14 | 1.60 | 2.96 | 6.47 | 3.47 | 2.40 | 4.21 | 0.15 | 0.75 | 3.72 | T | 27.58 |
| North Loup | 0.96 | 0.65 | 1.66 | 3.84 | 6.70 | 3.49 | 3.33 | 2.16 | 0.33 | 0.38 | 2.95 | 0.32 | 26.77 |
| Orleans 1W | 0.66 | 1.30 | 1.42 | 2.89 | 5.74 | 2.67 | 2.02 | 2.87 | 0.46 | 0.42 | 3.33 | 0.01 | 23.79 |
| Ord Airport | 0.70 | 0.47 | 1.32 | 3.33 | 5.16 | 3.36 | 3.22 | 1.47 | 0.30 | 0.21 | 1.89 | 0.41 | 21.84 |
| Ord | 0.74 | 0.65 | 1.32 | 3.62 | 5.55 | 3.59 | 3.32 | 1.42 | 0.31 | 0.25 | 1.89 | 0.40 | 23.06 |
| Osceola | 1.55 | 0.52 | 0.99 | 4.73 | 8.02 | 7.82 | 4.16 | 3.04 | 0.31 | 1.19 | 2.14 | 0.26 | 34.73 |
| Oxford 6NNW | 0.56 | 1.03 | 1.23 | 3.19 | 5.06 | 2.50 | 3.44 | 3.69 | 0.28 | 0.99 | 2.35 | T | 24.32 |
| Polk | 1.13 | 0.75 | 1.21 | 4.63 | 6.62 | 5.00 | 4.01 | 4.97 | 0.34 | 0.98 | 2.11 | 0.56 | 32.31 |
| Ravenna | 0.76 | 0.56 | 2.34 | 5.56 | 6.76 | 4.68 | 5.16 | 2.10 | T | 0.20 | 2.66 | 0.19 | 30.97 |
| Red Cloud | 0.92 | 1.23 | 2.07 | 1.09 | 5.09 | 3.12 | 2.85 | 1.76 | 0.94 | 0.90 | 3.44 | 0.07 | 23.48 |
| St. Paul | 0.84 | 0.68 | 1.56 | 3.46 | 8.84 | 6.67 | 5.39 | 3.19 | 0.15 | 0.34 | 2.88 | 0.33 | 34.33 |
| Shelby 3NE | 1.53 | 0.20 | 1.07 | 4.14 | 8.63 | 8.22 | 5.12 | 4.14 | 0.21 | 1.15 | 2.81 | 0.59 | 37.81 |
| Shickley 4S | 1.43 | 0.70 | 0.86 | 1.36 | 4.35 | 3.35 | 4.07 | 3.08 | 0.05 | 0.54 | 2.87 | 0.53 | 23.19 |
| Superior | 1.06 | 0.88 | 1.15 | 1.13 | 5.72 | 2.15 | 3.53 | 2.44 | 0.57 | 0.65 | 3.13 | 0.40 | 22.81 |
| Wilsonville | 0.81 | 0.99 | 1.35 | 3.27 | 6.06 | 2.07 | 3.34 | 5.58 | 0.76 | 0.39 | 2.73 | T | 27.35 |
| York 3N | 1.18 | 0.66 | 1.68 | 4.06 | 4.18 | 6.13 | 4.04 | 2.55 | 0.12 | 0.89 | 2.28 | 0.73 | 28.50 |
2024 NORTH CENTRAL KANSAS
NWS COOPERATIVE OBSERVER PRECIPITATION
(for 6 counties in the NWS Hastings coverage area)
The highest reported monthly/annual totals indicated in BLUE, the lowest in RED
M indicates incomplete/missing data
According to 30-year NCEI "normals" (1991-2020), annual precipitation across this six-county area generally ranges from 24-27",
with the highest amounts favoring the eastern-most counties of Jewell and Mitchell.
| Station | Jan | Feb | Mar | Apr | May | Jun | July | Aug | Sep | Oct | Nov | Dec | 2024 Total |
| Alton | M | M | M | M | M | M | 2.42 | 2.96 | 1.36 | 0.34 | 3.97 | 0.21 | M |
| Beloit | 1.08 | 1.30 | 0.99 | 2.03 | 3.41 | 2.34 | 1.89 | 2.81 | 1.38 | 0.50 | 3.80 | 0.89 | 22.42 |
| Burr Oak 4S | 0.89 | 1.10 | 1.31 | 3.04 | 6.36 | 2.29 | 2.13 | 3.62 | 1.36 | 0.34 | 3.36 | 0.13 | 25.93 |
| Cawker City | 1.06 | 0.75 | 1.06 | 0.65 | 2.71 | 2.40 | 2.98 | 3.30 | 5.52 | 0.17 | 3.98 | 0.58 | 25.16 |
| Glen Elder Dam | 0.99 | 1.01 | 0.96 | 0.80 | 3.26 | 2.65 | 2.23 | 3.03 | 3.26 | 0.53 | 4.52 | 0.66 | 23.90 |
| Ionia | 0.97 | 1.26 | 1.15 | 1.97 | 3.71 | 3.20 | 2.19 | 3.28 | 2.52 | 0.14 | 3.53 | 0.29 | 24.21 |
| Kirwin Dam | 1.11 | 1.31 | 1.71 | 0.93 | 6.58 | 2.57 | 2.67 | 4.04 | 1.69 | 0.22 | 3.41 | 0.04 | 26.28 |
| Lebanon | 1.01 | 1.10 | 2.24 | 2.36 | 4.42 | 1.13 | 3.01 | 2.67 | 3.55 | 0.92 | 3.13 | 0.15 | 25.69 |
| Lovewell Dam | 0.69 | 0.76 | 1.00 | 1.43 | 4.87 | 4.05 | 2.17 | 2.09 | 0.64 | 0.71 | 3.39 | 0.35 | 22.15 |
| Natoma | 1.00 | 2.05 | 1.94 | 0.78 | 5.44 | 1.40 | 3.55 | 3.42 | 0.77 | 0.19 | 3.48 | 0.65 | 24.67 |
| Phillipsburg | 0.74 | 1.53 | 1.62 | 0.97 | 5.83 | 2.26 | 2.90 | 4.99 | 0.55 | 2.85 | 3.69 | 0.01 | 27.94 |
| Plainville 4WNW | 1.45 | 1.71 | 2.74 | 0.99 | 2.95 | 1.75 | 1.20 | 3.15 | 0.51 | 0.22 | 4.56 | T | 21.23 |
| Smith Center | 1.30 | 1.60 | 2.51 | 1.42 | M | M | M | M | M | 0.23 | 2.93 | 0.06 | M |
| Webster Dam | 0.89 | 1.62 | 1.30 | 0.49 | 3.96 | 2.27 | 2.94 | 3.92 | 0.86 | 0.28 | 3.67 | 0.09 | 22.29 |
 |
Media use of NWS Web News Stories is encouraged! Please acknowledge the NWS as the source of any news information accessed from this site. |
|


