 |
NWS Wilmington Spotter Page |  |
| Spotter Guide |
|
||||||||||||||||||||||||||
| The National Weather Service (NWS) office in Wilmington, Ohio uses Doppler radar as the primary technology to detect severe weather. However, the most important tool for observing thunderstorms is the trained eye of the storm spotter. Doppler radar provides information about the motion of wind and precipitation inside a storm, but will not show the wind at ground level. It is impossible for any radar to detect every severe weather event in its coverage area, and radar occasionally suggests severe weather when, in fact, none is present. As a trained spotter, you perform an invaluable service for the NWS. Your real-time, ground-truth observations of tornadoes, hail, wind, and significant cloud formations provide a truly reliable information base for severe weather detection and verification. By providing observations, you are assisting the meteorologists at Wilmington in their warning decisions, and enabling the NWS to fulfill its mission of protecting life and property. Your spotter report can literally mean the difference between life and death! |
||||||||||||||||||||||||||
|
||||||||||||||||||||||||||
| The NWS in Wilmington does not recommend chasing storms! Our goal is to have enough storm spotters in each county to relay frequent reliable information from the safety of their homes or business directly to our office. We issue severe weather warnings for 52 counties across southwestern and central Ohio, northern Kentucky, and southeast and east central Indiana. We have over 3000 spotters, which is an average of about 60 per county. Of course, there are more spotters in the metropolitan areas of Cincinnati, Dayton, and Columbus. Figure 1 shows the distribution of most of the spotters across Wilmington's county warning area. If you happen to be caught outside during a thunderstorm, lightning is the first threat. Lightning is very dangerous due to its unpredictable behavior and its frequency. Keep in mind that although lightning is very dangerous, it is not part of the definition of a severe thunderstorm. Remember that every thunderstorm contains lightning, like figure 2, but typically the stronger storms will contain more frequent lightning. The safest place to be is in a building. The next safest place to be is a vehicle. A vehicle carries the electrical current through its frame, including the tires, to the ground. If caught outside away from shelter during a thunderstorm, there is little to no protection. Seeking shelter quickly is the best option, but staying away from tall trees and metal objects can help minimize the risk. Preparedness is very important for any severe weather safety plan. The best way to avoid thunderstorms while outdoors is to stay indoors when thunderstorms are possible, or make plans to return to shelter well before thunderstorms are imminent. Lightning can strike as far as 10 miles from a thunderstorm, so all outdoor activities should be postponed whenever thunder is heard. We recommend the use of NOAA Weather Radio to stay informed of possible weather hazards. |
 Figure 1 - Green (*) show the distribution of spotters across the NWS Wilmington, Ohio Forecast Area. 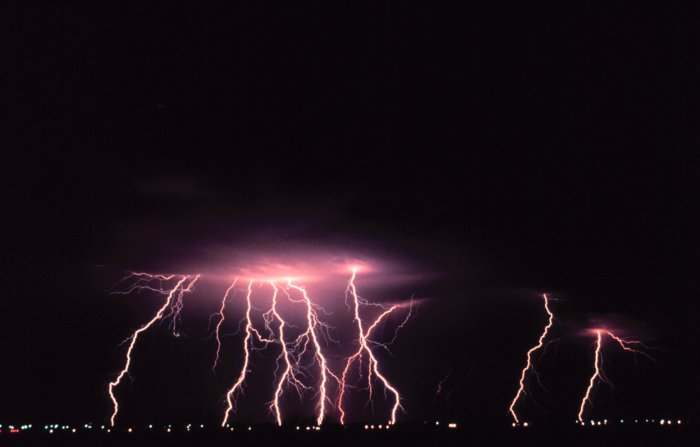 Figure 2 - A time-lapse photo captures multiple cloud-to-ground lightning strokes during a night-time thunderstorm. Photo courtesy of NSSL Photo library.  Figure 3 - The NOAA All-Hazards Weather Radio logo. |
|||||||||||||||||||||||||
|
||||||||||||||||||||||||||
| Please report any of the following events to the Wilmington NWS office. Please use the unlisted severe weather reporting number for urgent reports, or contact us via Facebook or Twitter. Significant or Severe Weather:
|
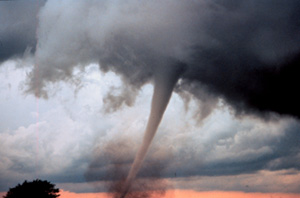 Figure 4 - Oklahoma tornado (May 1999). Photo courtesy of NSSL Photo library. 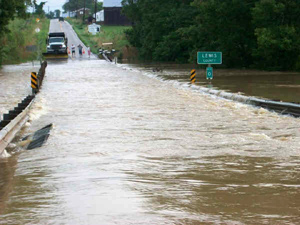 Figure 5 - Flash flooding washed out this bridge on the Lewis/Fleming County line in Kentucky in June 2010. Photo courtesy of the Lewis County Herald. 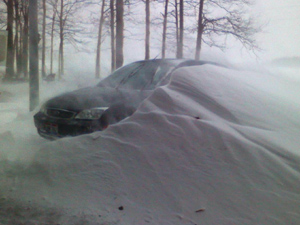 Figure 6 - A snow storm in early February 2010 produced up to a foot of snow in parts of Ohio. Photo courtesy of Brian Counts, W of Kossuth, Ohio. |
|||||||||||||||||||||||||
|
||||||||||||||||||||||||||
| Single Cell Thunderstorm: The single cell thunderstorm has a lifetime of only 20-40 minutes. They usually do not produce severe weather and can be thought of as a "garden variety" type storm, such as Figure 7. They typically occur on a day with little wind shear. Some single cell storms with stronger updrafts may produce brief severe weather events. These storms are capable of producing marginal severe hail and brief downbursts. Multi-Cell Thunderstorm: Multi-cell storms are the most common type of thunderstorm. These storms are simply a collection of single cell storms. Sometimes these multi-cells are in clusters, while other times they are organized in lines (commonly referred to as a squall line). Figure 8 shows a squall line approaching from the west. The squall line is approximately 50 miles away. Each cell in a multi-cell storm may last only 20 minutes, but the organized multi-cell storm may persist for many hours. These storms are more intense than single cell storms, but are weaker than super cells. Multi-cell storms can produce very heavy rainfall, downburst winds of 80 MPH or higher, hail the size of golf balls, and occasionally weak tornadoes. Figure 9 shows a squall line about 5 miles away, approaching from the west (right) with a shelf cloud denoting the gust front. The gust front marks the leading edge of gusty winds from the thunderstorm downdraft. Near and just behind the gust front is the location for severe straight-line winds. The heaviest rain and largest hail also occurs shortly behind the gust front. The severe weather most associated with a squall line is damaging straight-line winds. Supercell Thunderstorm: Supercells are rare across northern Kentucky, the southwest half of Ohio, and southeast and east central Indiana. However, when they do occur they pose an extremely high threat to life and property. What sets the supercell storm apart from the others is its strong rotation. The intense updraft of the storm rotates and is called a mesocyclone. This is the most likely location for tornado formation. A supercell storm can produce all types of severe weather with giant hail more than 2 inches in diameter, powerful downbursts of 100 MPH or more, and strong to violent tornadoes all being possible. Figure 10 shows what a supercell looks like from about 50 miles away. Two visual clues of an approaching supercell are the anvil and overshooting top (both are denoted in yellow). The storm is located to the west. Figure 11 shows the appearance, from a few miles away, under the rain-free base of a supercell with a tornado and wall cloud. |
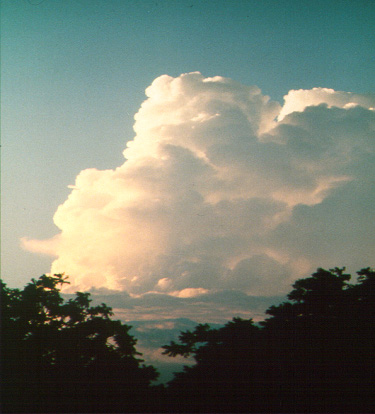 Figure 7 - A single cell thunderstorm. 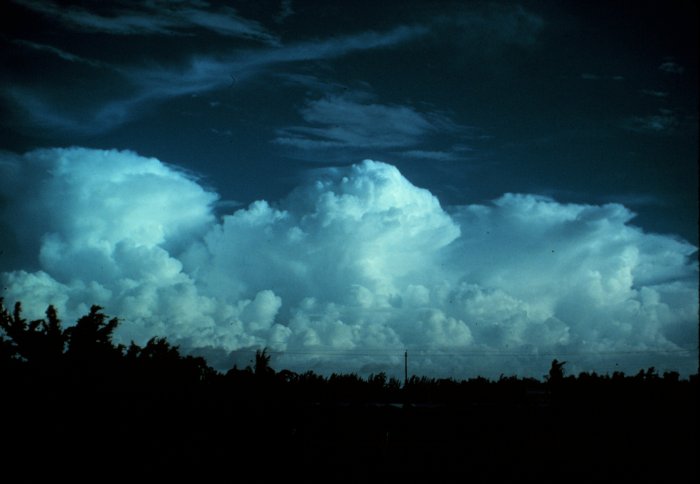 Figure 8 - Multi-cell thunderstorms (squall line). Photo courtesy of NSSL Photo library. 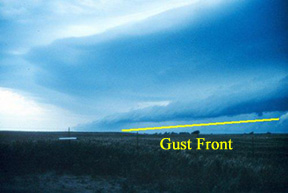 Figure 9 - A squall line approaching from the west. The shelf cloud denotes where the gust front is located (right above the yellow line) approaching from the right (west). Image is looking south. Photo courtesy of NSSL Photo library. 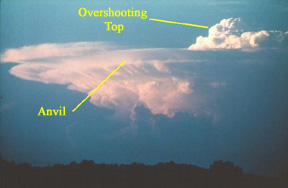 Figure 10 - Supercell is located 50 miles to the west. Note, anvil and overshooting tops denoted in yellow. Photo courtesy of NSSL Photo library. 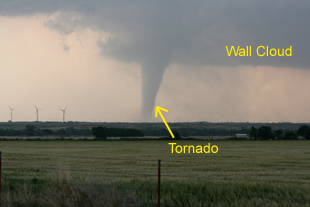 Figure 11 - A picture from the rain free base underneath a supercell. Photo courtesy of NSSL photo library. |
|||||||||||||||||||||||||
|
||||||||||||||||||||||||||
| Wall Cloud: A wall cloud (figure 12) is defined as an isolated cloud lowering attached to the rain-free base. The wall cloud is generally to the rear (mainly south or southwest) of the visible precipitation area. Wall clouds are usually about 2 miles in diameter (can range from a fraction of a mile up to 5 miles), and mark the strongest updraft in the storm. When seen from within several miles, many wall clouds exhibit rapid upward motion and counterclockwise rotation. However, not all wall clouds rotate. Rotating wall clouds usually precede strong or violent tornadoes, by anywhere from a few minutes up to nearly an hour. Wall clouds should be watched for signs of persistent, sustained rotation and rapid vertical motion. Shelf Clouds and Roll Clouds: Shelf clouds and roll clouds are examples of "accessory clouds" that you may see beneath the cloud base of a storm (figure 13). Shelf clouds are long wedge-shaped clouds attached to the parent cloud above (i.e. thunderstorm). The shelf cloud is associated with the gust front. Rising cloud motion often can be seen in the outer part of the shelf cloud, while the underside often appears turbulent, boiling, and wind torn. A roll cloud is a low horizontal tube-shaped cloud associated with a gust front. Roll clouds are relatively rare. They are completely detached from the thunderstorm base or other cloud features. Roll clouds usually appear to be "rolling" about a horizontal axis, but should not be confused with funnel clouds. The possibility of a tornado forming beneath a shelf or roll cloud is quite small. The main threat is damaging straight-line winds. Wall Cloud vs. Shelf Cloud: A big challenge as a spotter will be to discern between a shelf cloud and a legitimate wall cloud. The table below will help to distinguish between the two.
Many spotters in this part of the country may not see a legitimate wall cloud for a few years or longer, and only a few of these wall clouds will actually produce tornadoes. Your main clue as to the tornado potential of the wall cloud will be its rotation, especially if it is persistent. Another clue of tornadic potential will be if you notice vertical motion, especially rapid vertical motion. |
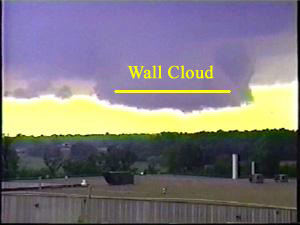 Figure 12 - Wall cloud over central Minnesota. Yellow line denotes wall cloud. Photo courtesy of NWS Minneapolis. 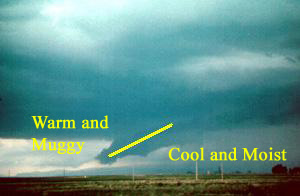 Figure 13 - Shelf cloud (Yellow). The Shelf Cloud denotes the difference between cool moist air associated with the downdraft (rain cooled air) and the warm muggy air surrounding the thunderstorm which is feeding the updraft. Photo courtesy of NSSL Photo library. 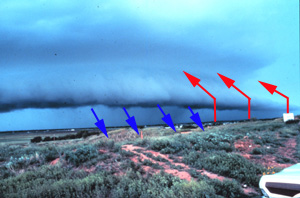 Figure 14 - Shelf cloud with streamlines showing air flow in and around the shelf cloud. Red denotes the upward motion ahead of the shelf cloud. Blue denotes the downward motion behind the shelf cloud. Remember that a shelf cloud suggests downdraft and outflow. It moves away from the precipitation area and slopes downward and away from the precipitation area. Photo courtesy of NSSL Photo library.  Figure 15 - Wall cloud with streamlines (red) showing air flow in and around the wall cloud. Remember that a wall cloud suggests updraft and inflow. It maintains its position with respect to the precipitation area and slopes upward and away from the precipitation area. Photo courtesy of NSSL Photo library. |
|||||||||||||||||||||||||
|
||||||||||||||||||||||||||
| Experienced spotters are probably aware that a number of features (both natural and man-made) can bear a resemblance to a tornado or a funnel cloud. Some of these features include virga, rain shafts, scud clouds, mammatus clouds, and smoke. By far, the most commonly mistaken funnel clouds are scud clouds. Shelf clouds and roll clouds can also be mistaken for wall clouds, funnel clouds, or tornadoes. Scud Clouds: Scud clouds are small, ragged, low cloud fragments that are unattached to a larger cloud base (Figure 16). These clouds are often seen behind thunderstorm gust fronts. These clouds are generally associated with cool moist air, such as thunderstorm outflow. Virga: Virga is streaks or wisps of precipitation falling from a cloud, but evaporating before reaching the ground. In certain cases, shafts of virga may precede a downburst. Rain Shaft: A rain shaft is a streak of precipitation falling from a cloud and reaching the ground (Figure 17). Mammatus Clouds: Mammatus clouds (Figure 18) are rounded, smooth, sack-like protrusions hanging from the underside of a cloud (usually a thunderstorm anvil). Mammatus clouds often accompany severe thunderstorms, but do not produce severe weather. They may accompany non-severe storms as well. Smoke: A smokestack or fire can produce a plume of smoke that sometimes resembles a tornado, especially from a distance. Unlike a tornado, the bottom of the smoke will not be rotating. To distinguish a tornado look-alike from a legitimate tornado, a spotter must look for organized and sustained rotation about a nearly vertical axis. |
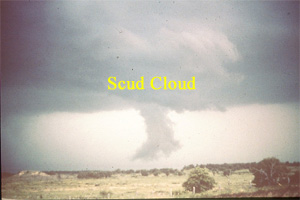 Figure 16 - A scud cloud is the lower hanging cloud, located just below the yellow text. It could easily be mistaken for a wall cloud or a tornado. Study the cloud feature to make sure it is what you think it is. Photo courtesy of NSSL Photo library. 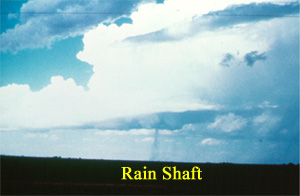 Figure 17 - A rain shaft is located just above the yellow text. These features can resemble a tornado. Rain shafts will change shape and move around. If you see a feature like this, study it for a few minutes and see if it changes shape. Photo courtesy of NSSL Photo library. 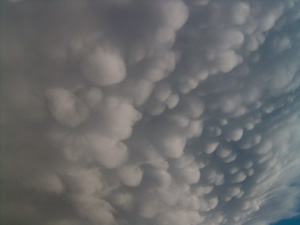 Figure 18 - Photo of mammatus clouds near Wilmington after thunderstorms. Photo courtesy of Mark Duquette. |
|||||||||||||||||||||||||
|
||||||||||||||||||||||||||
A thunderstorm is defined as severe if it produces:
Hail: Hail can come in many sizes. Figure 19 shows the relationship between the size of marbles and coins. Marbles come in many different sizes, so when reporting hail size, please report a coin size. Figure 20 shows hail stones the size of baseballs. Below is a table that compares a measured hail size with coins and other objects.
Wind speeds associated with downburst winds can exceed 100 mph. Figure 21 shows a downburst in a drier atmosphere. In the Ohio Valley this is rarely seen so clearly. Moisture from the Gulf of America gives our thunderstorms plenty of moisture to work with, which masks these features with precipitation, mist, or haze. Below is a table that compares wind speeds with the kind of damage that can be expected.
Tornadoes are rated using the Enhanced Fujita Scale. The strength of tornadoes ranges from EF0 to EF5. In general, weak tornadoes (Figure 22) are the most common. These make up 86% of all tornadoes. These tornadoes account for less than 5% of all tornado deaths, have an average life span of less than 10 minutes, and a path length of usually less than a mile. Strong tornadoes (Figure 23) account for 13% of all tornadoes. These tornadoes account for less than 30% of all tornado deaths, have an average life span of 10-20 minutes, and a path length that can exceed 15 miles. Violent tornadoes (Figure 24) account for 1% of all tornadoes. These tornadoes account for 70% of all tornado deaths, can last for over an hour, and can have path lengths of over 50 miles. Below is a chart of the Enhanced Fujita Scale, which assigns a rating to a tornado based on the observed damage it caused.
|
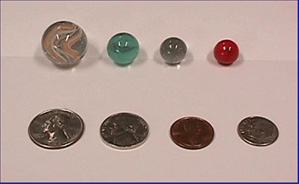 Figure 19 - Marbles come in many different sizes. Please report coin size instead of marble size. Note: quarter size hail is 1", which meets severe criteria. 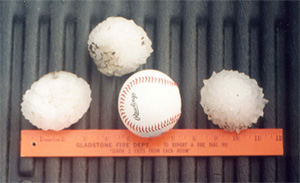 Figure 20 - Baseball size hail near Eagan, Minnesota. Photo courtesy of Chris Levine and Peter Boulay. 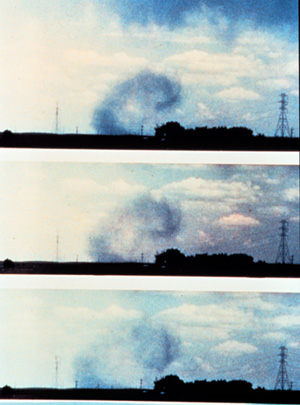 Figure 21 - Downburst from a great plains thunderstorm. Photo courtesy of NSSL Photo library. 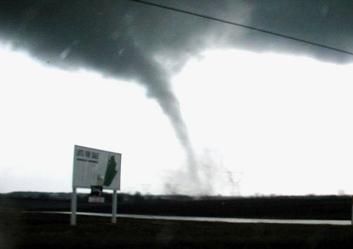 Figure 22 - Example of a Weak Tornado (EF0 to EF1) from November 10, 2002 in Logan County. Photo Courtesy of Jeff McCall. 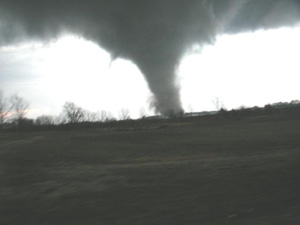 Figure 23 - Example of a Strong Tornado (EF2 to EF3) from November 10, 2002 in Union County. Photo Courtesy of Jeff McCall. 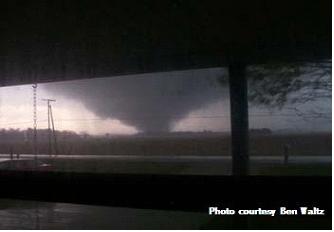 Figure 24 - Example of a Violent Tornado (EF4 to EF5) from November 10, 2002 in Van Wert County. Photo Courtesy of Ben Waltz. |
|||||||||||||||||||||||||
|
||||||||||||||||||||||||||
| Severe straight-line winds and large hail are much more common than tornadoes. From October 2007 through September 2011, the area has seen 1574 severe wind and hail events and only 79 tornadoes. Tornadoes account for only about 5 percent of our severe weather. Over the same time frame, the area saw 223 flash flood events. This shows we experience flooding much more frequently than tornadoes. On many occasions, straight-line wind damage is mistaken for tornado damage. Whenever possible, after widespread wind damage or suspected tornadic damage, the staff at our office will perform a damage survey in the area hardest hit. On rare occasions, we will do an aerial survey of the damage when an aircraft is available, but in most cases a ground survey is done. For more details on severe weather climatology for the NWS Wilmington forecast area, please see the Severe Weather Climatology research paper (PDF format). For a look at past severe weather events, see the Past Storm Events webpage. |
||||||||||||||||||||||||||
|
||||||||||||||||||||||||||
| Watch: A NWS product which specifies locations in which conditions are favorable for hazardous weather to develop. A watch is a recommendation for planning, preparation, and increased awareness. For severe weather, watches typically cover periods of 4 to 10 hours, and include large portions of a state or forecast area. Warning: A NWS product which indicates that a particular weather hazard is either imminent or is occurring. A warning indicates the need to take action to protect life and property. Warnings for tornadoes and severe thunderstorms typically cover periods of an hour or less, and are issued for polygons that may only cover portions of a few counties. Types of Weather: Watches and warnings are issued for all types of hazardous weather. This includes tornadoes, severe thunderstorms, floods, flash floods, high winds, and winter storms. Whenever a severe weather watch or warning is issued, the information will be toned and broadcasted over the NOAA Weather Radio. |
||||||||||||||||||||||||||

