|
Here is a look at some Christmas Day weather statistics for Cincinnati, with data going back to 1871. As can be seen in the data below, there has been a fairly wide spectrum of temperatures and precipitation on Christmas in Cincinnati, but high temperatures have generally been in the 30s and low temperatures in the 20s. While it is not uncommon for the area to see a small amount of precipitation on Christmas Day, only a small fraction of Christmas Days in Cincinnati have had measurable snowfall. Scroll to the bottom of the page to find out how common a white Christmas is in the Cincinnati area.
Christmas Day Climate Extremes (1871-2023):
Warmest High Temperature: 69 degrees (2021)
Coldest High Temperature: 3 degrees (1983)
Coldest Low Temperature: -12 degrees (1983)
Warmest Low Temperature: 58 degrees (1889)
Most Precipitation: 1.12 inches (1957)
Most Snowfall: 3.7 inches (1909)
Greatest Snow Depth: 9 inches (2004)
Christmas Day Climate Averages (1871-2023):
Average High Temperature: 39 degrees
Average Low Temperature: 25 degrees
Average Precipitation: 0.11 inches
Average Snowfall: 0.2 inches
Average Snow Depth: 1 inch
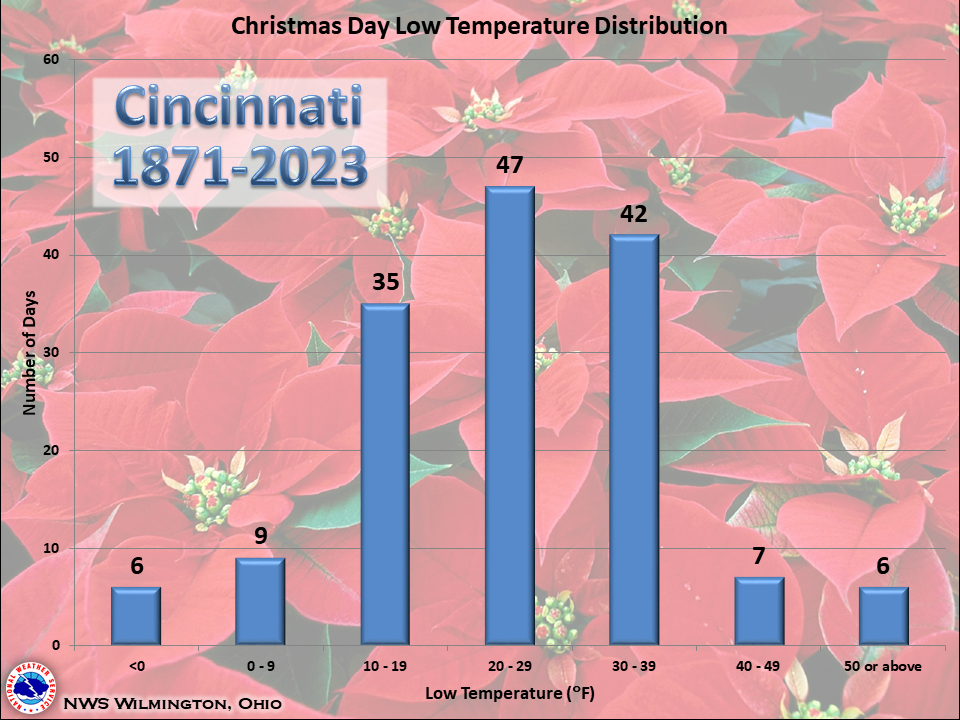
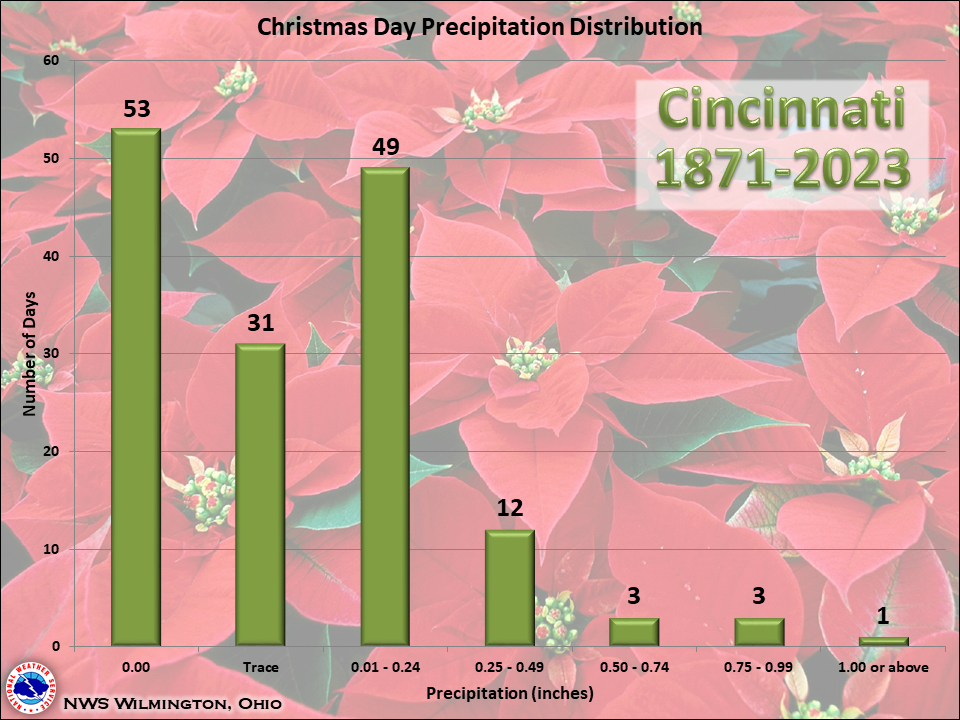
Below are graphs showing the frequency distribution of Christmas Day high/low temperatures, precipitation, and snowfall for Cincinnati. Click here for a full listing of Cincinnati's Christmas Day climate records.


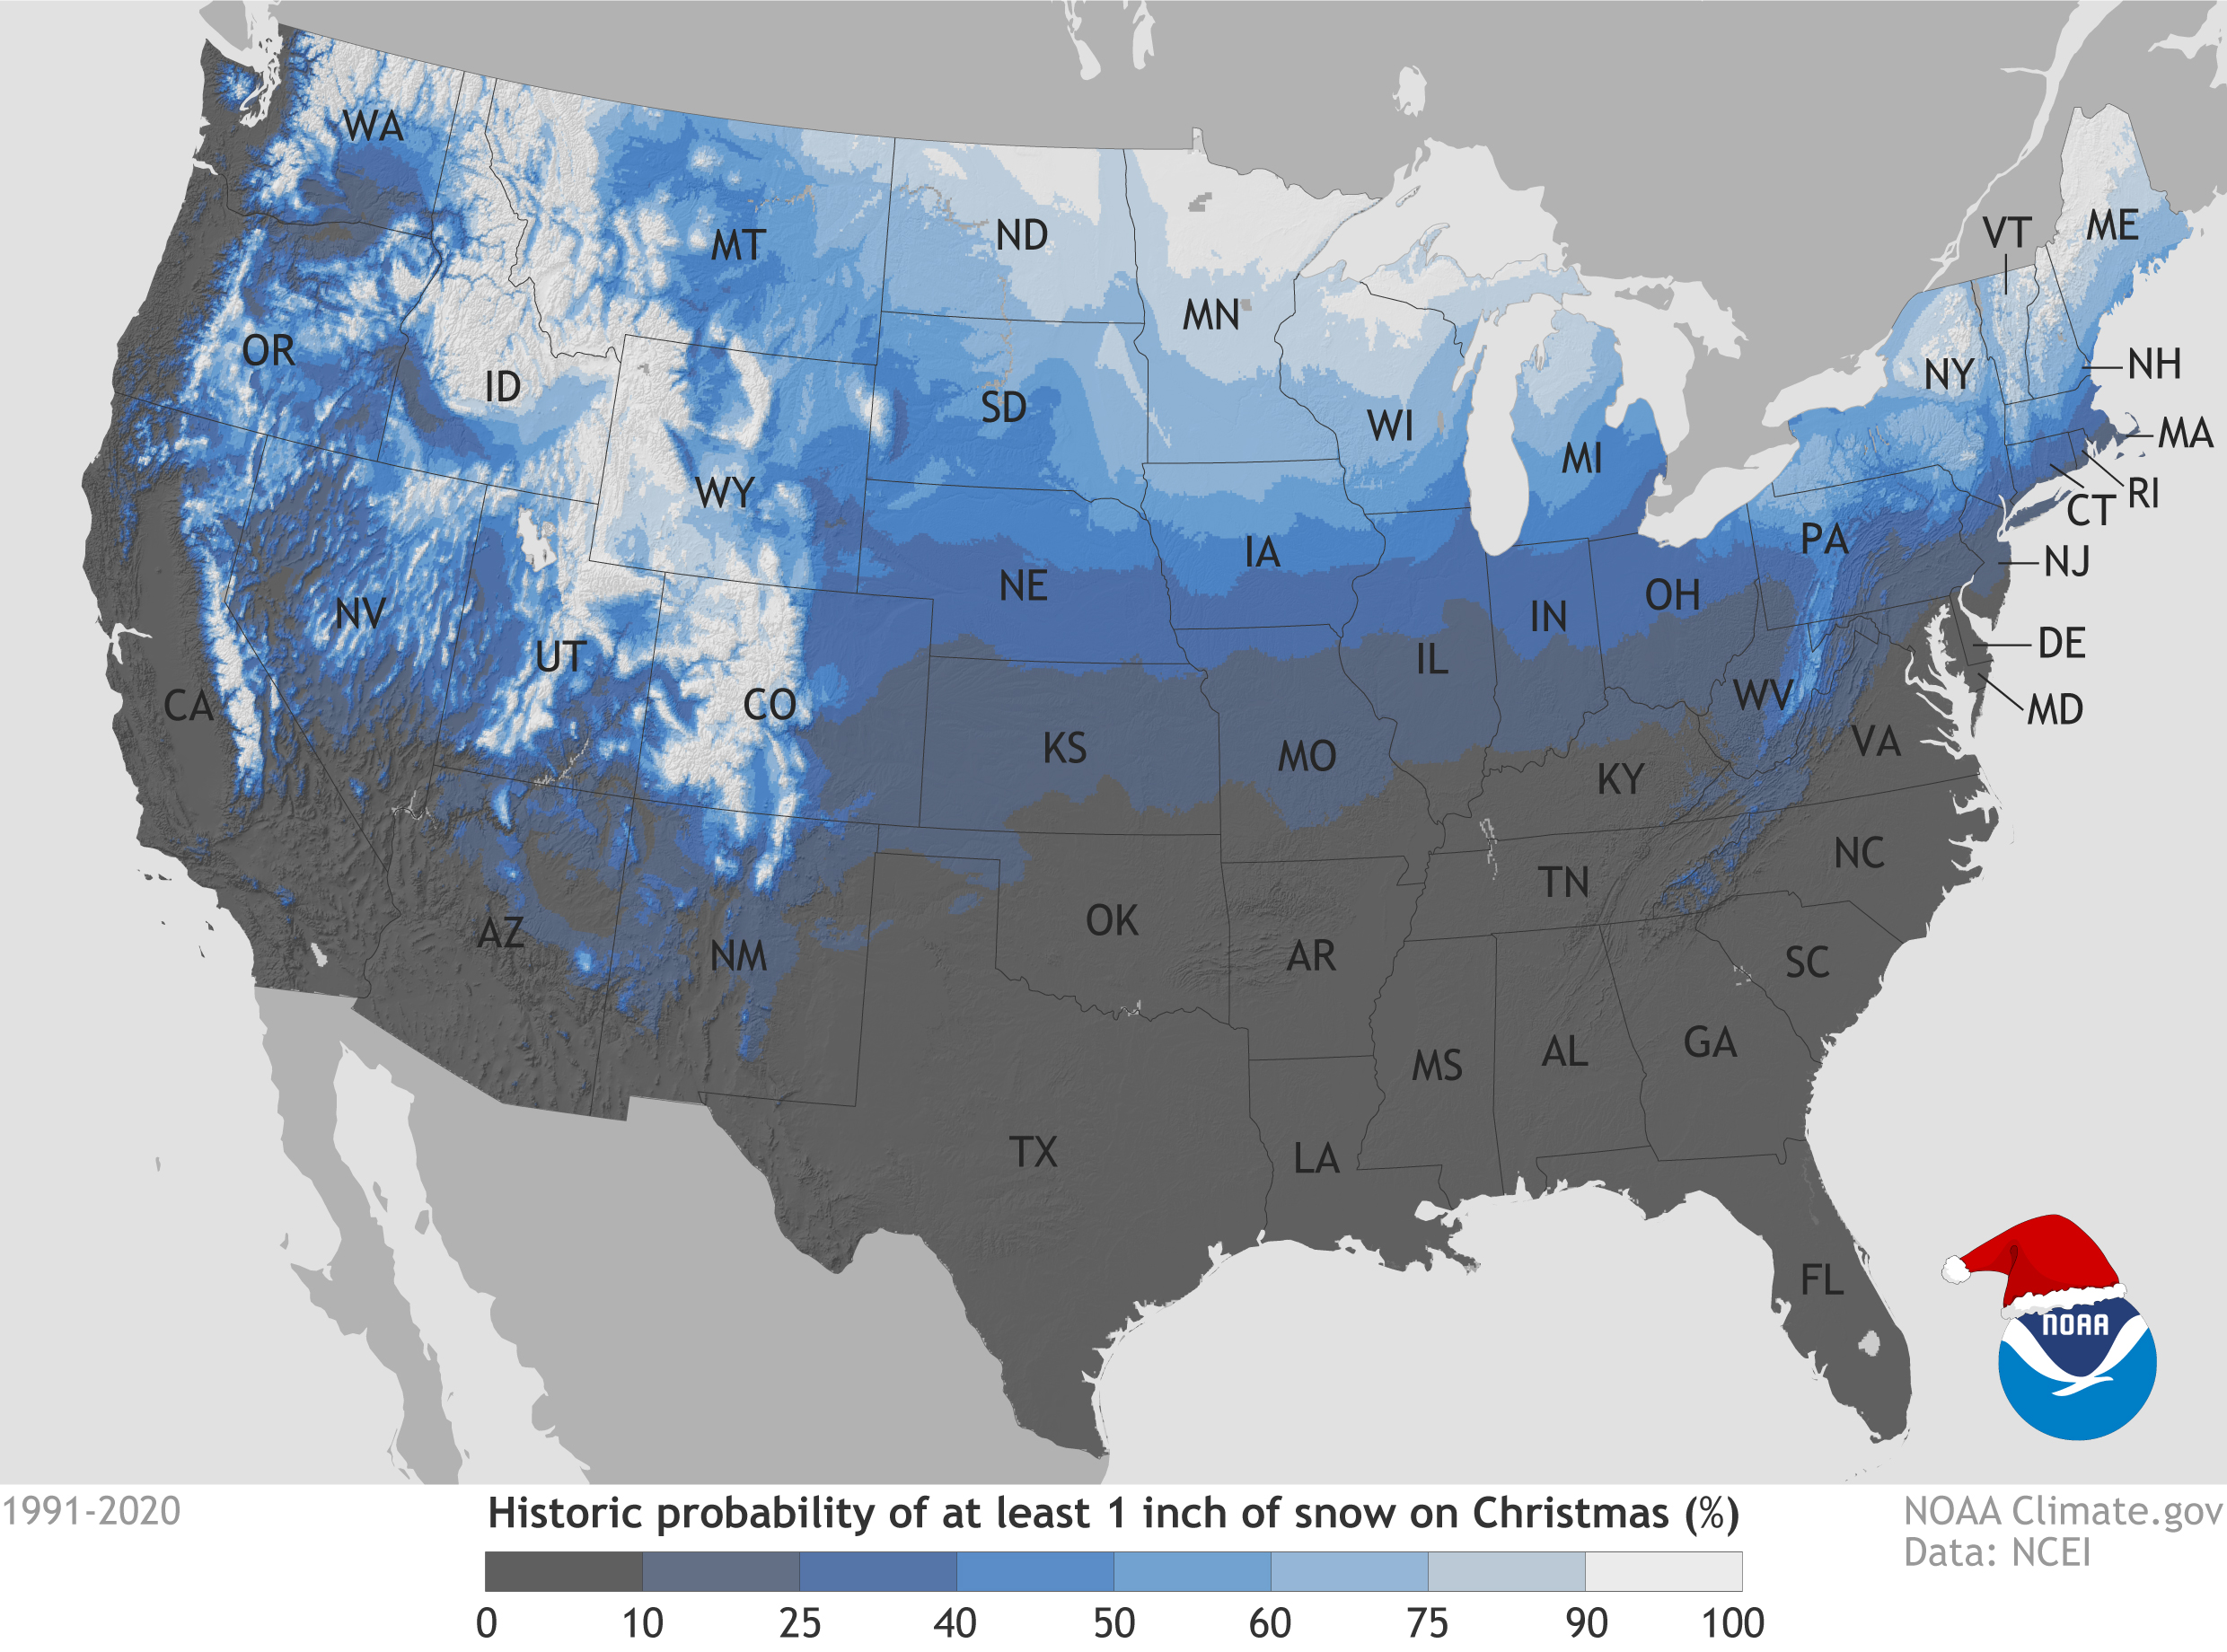
A "white Christmas" is defined as having an inch or more of snow on the ground on Christmas morning. How common is that in the Cincinnati area? Since snow depth measurements began in Cincinnati in 1916, the area has experienced a white Christmas only 18 times (about 17 percent of the time). During the most recent 30-year climatological normal period (1991-2020), the area experienced a white Christmas just 7 times (23 percent of the time). Cincinnati's most recent white Christmas occurred in 2022 when there was 2 inches of snow on the ground in the morning.
The white Christmas probability map below (click for larger version) was created by NOAA's National Centers for Environmental Information (NCEI) and incorporates data from observing stations with at least 25 years or more of snow depth measurements during the period 1991-2020.
|


