Scattered strong to severe storms capable of sporadic large hail and severe winds are expected this afternoon and evening across portions of western Texas. Widespread showers and thunderstorms may produce isolated flash flooding across the Ozarks today and the Southeast into next week. Read More >
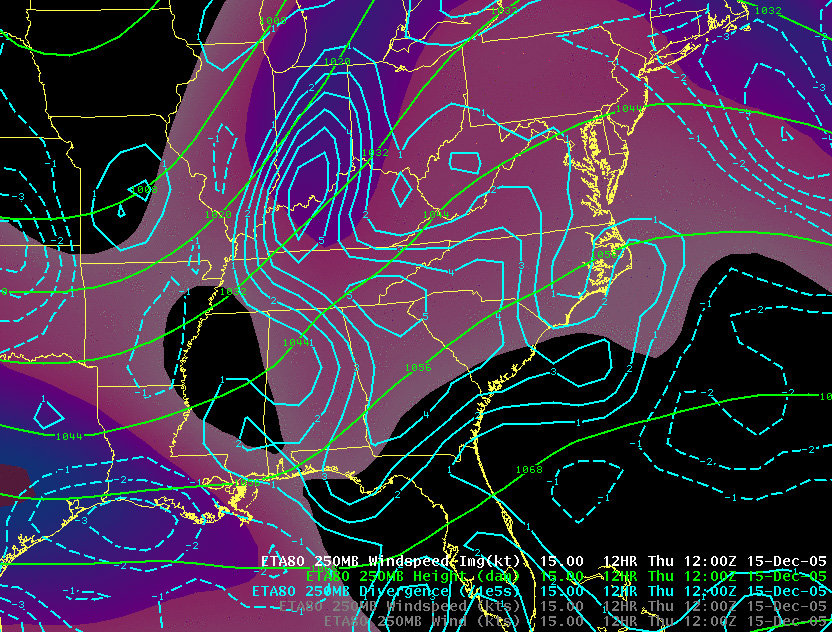
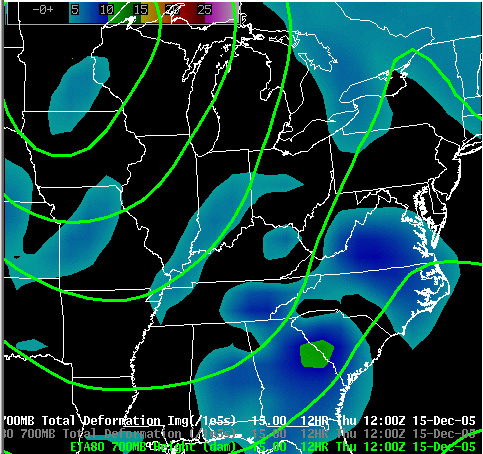
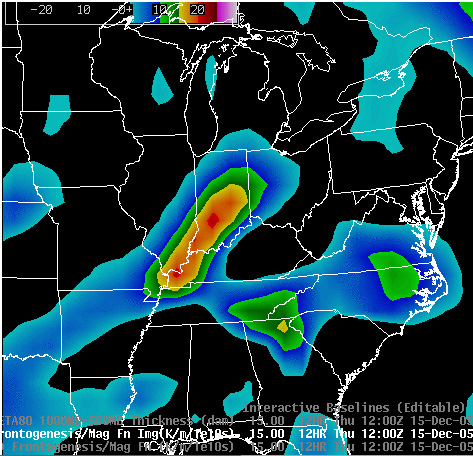
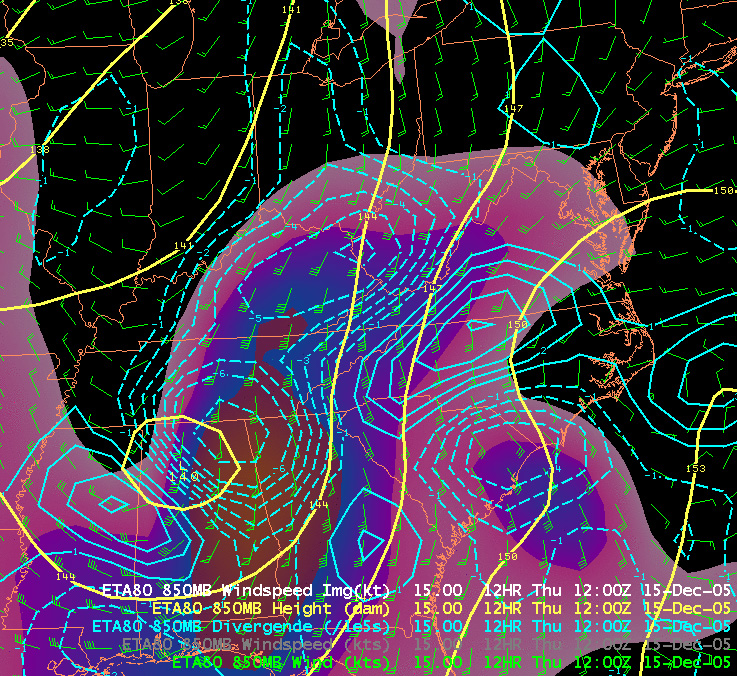
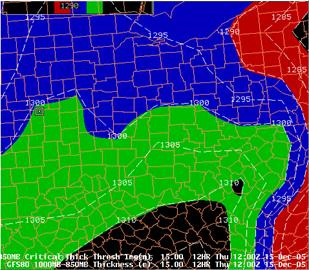
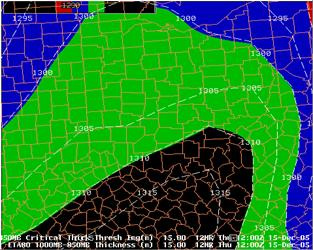
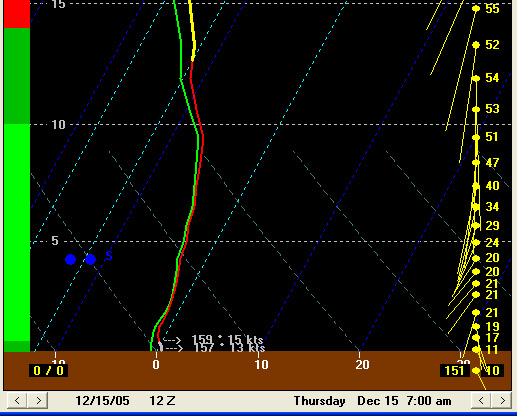
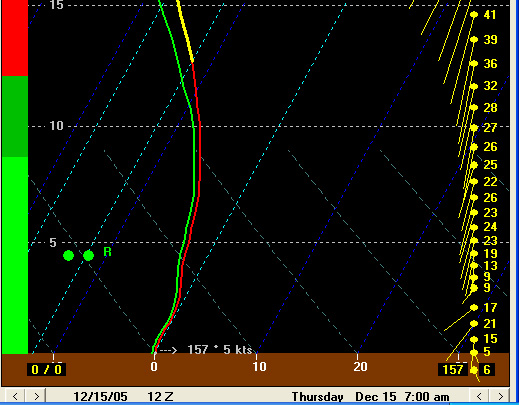
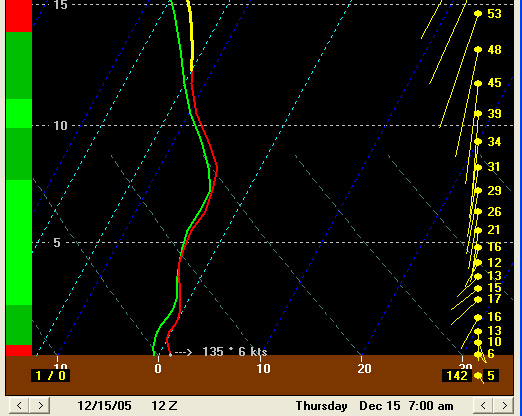
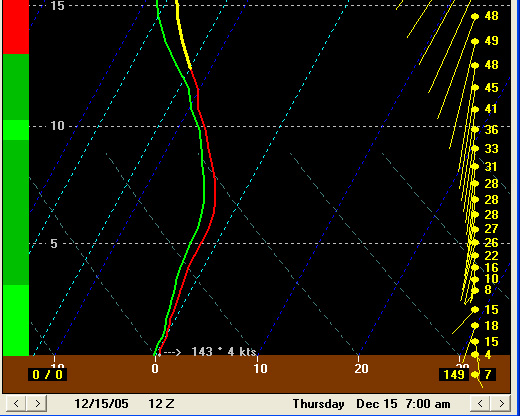
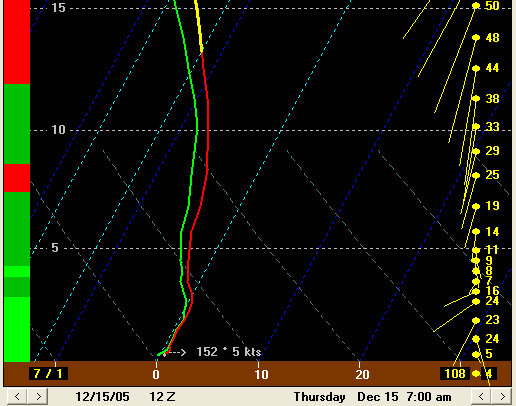
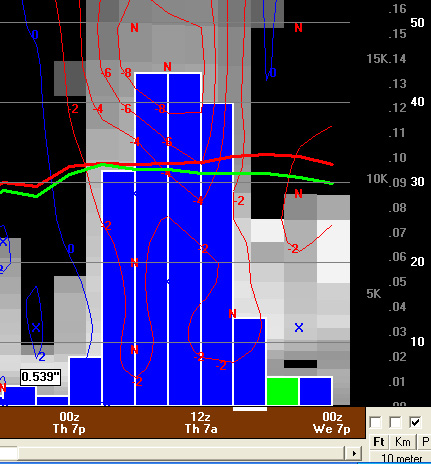
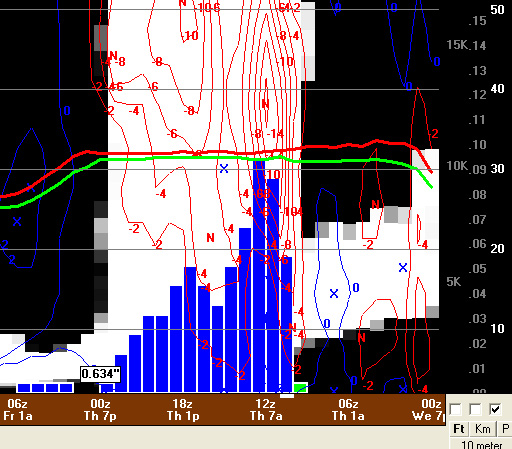
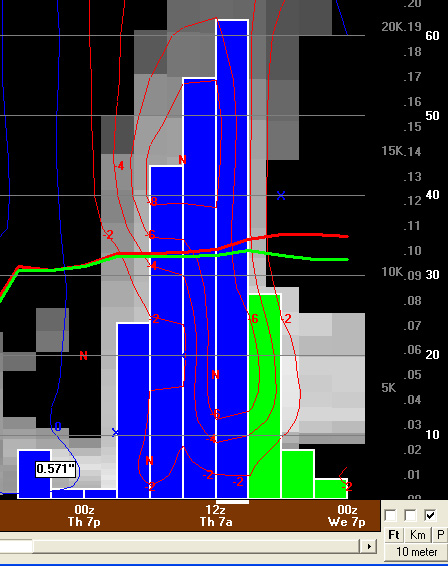
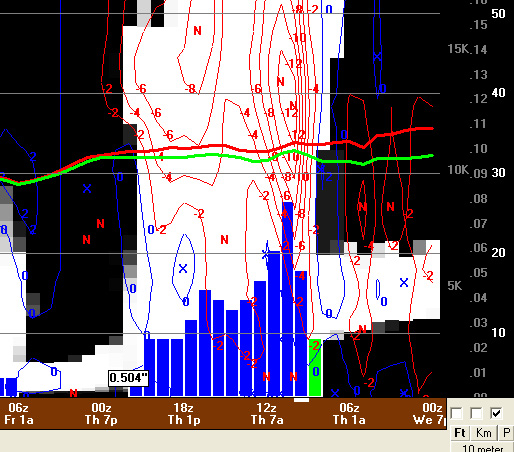
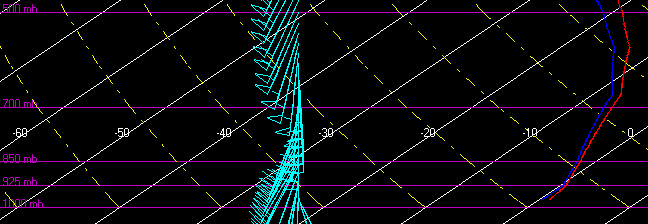
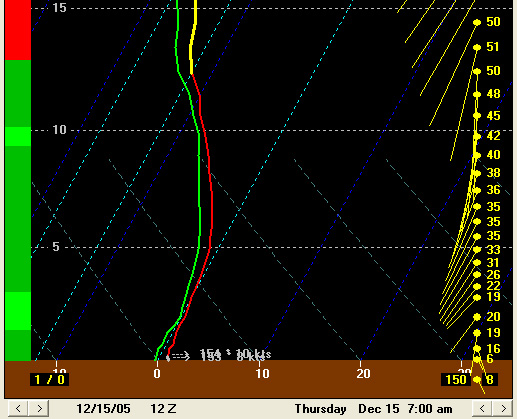
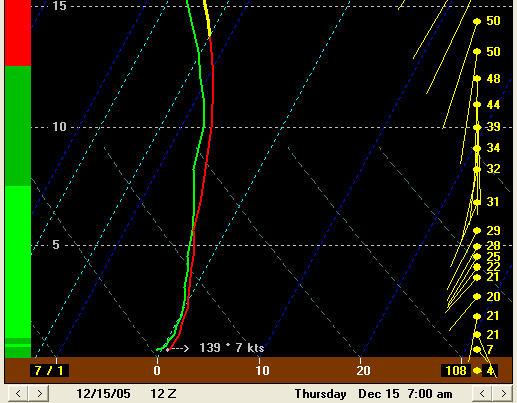
| Section 1 -- Section 2 -- Section 3 -- Section 4 With the models being relatively consistent with the synoptic features leading up the event, the forecast came down to the strength of forcing and the structure of the low level thermal fields. Both of these parameters are discussed below. Forcing Upper Level Jet Structure A hint of a duel jet was present at 00Z by both GFS and NAM (Figure 5) during this event. The Wilmington CWA was in the right rear portion of the polar jet allowing for good upper level divergence while the subtropical jet was over Texas into the lower Mississippi Valley. Isentropic The 00Z NAM and GFS both showed favorable isentropic lift at 290K and 295K (800 mb to 700mb) through 12Z. However, between 12Z and 18Z the flow became neutral before turning into to isentropic descent after the snow event ended. 700 mb Deformation The 00Z NAM and GFS total deformation at 700 mb (Figure 6a) correlated well with the heaviest snowfall. The axis of 800 to 600 mb 2D Frontogenesis from both models was strongest to the west of the greatest snowfall at 12Z, which is to be expected as the best snowfall typically falls on the warm side of the mid-level frontogenesis axis (Figure 6b). The placement by the GFS (not shown) was more closely related to the heavier snowfall and was forecasted to be more intense. The 00Z GFS and NAM both developed the 700 mb deformation and 2D frontogenesis between 06Z and 12Z and then weakened both areas as it propagated southeast of the area of interest by 18Z. It appears large scale ascent combined with enhanced lift due to 700 mb deformation and frontogenesis caused the column to slightly cool due to either evaporative or dynamical cooling. This cooling was evident ever so slightly in the 1000-850 mb thickness fields and allowed a bulk of the precipitation to fall as snow across the northwestern 1/3 of the forecast area. Mid Level Forcing A deep closed 500 mb low was located over Upper Mississippi Valley during the event. Both the 00Z NAM and GFS showed a vorticity maximum rotating around the base of the 500 mb trough that would affect the region around 12Z. The NAM was a bit stronger and slower than the GFS with this feature. Low Level Forcing At 850 mb, weak low level convergence was forecasted across the area of interest by both the 00Z GFS and NAM. The strongest convergence (Figure 7) was located southeast of the area of heaviest snow. The GFS showed an area of strong 850 mb convergence across the area associated with the heaviest snowfall. The NAM showed a weaker 850 mb convergence signature over the same area. At 925 mb, the 00Z GFS was slightly stronger than the NAM with the strongest convergence noted across central Kentucky and northeast Ohio. Both models showed weaker convergence over the area where the heaviest snow fell. Both the 00Z GFS and NAM also showed weak warm air advection between 12Z and 18Z at 925 mb and 850 mb. The axis of strongest warm air advection was to the south and east of the area of heaviest snowfall. Thermal Profile Precipitation type was the most challenging aspect of this case. Below is an evaluation of the lowest 300 mb thermal layer. Thickness Layers The 850-700 mb layer thicknesses for both the 00Z GFS and NAM suggested snow would be the main precipitation type as values were below 1540 m for the threat area through the entire event. However, slight differences were evident in the 1000-850 mb thickness thresholds over the same threat area for the same run and models. The GFS displayed colder 1000-850 mb thickness values than the NAM leading up to and during the entire event (Figure 8a and Figure 8b). Remember, 1000-850 mb thickness values between 1290 m and 1300 m would favor wet snow or rain and snow mix given that snow is falling into this layer. Greater than 1300 m would yield complete melting, thus rain. Note the GFS seemed to have a better handle on the boundary layer thicknesses as opposed to the NAM, and when compared with the weather that occurred. The RUC 1000-850 mb thickness values aligned more closely with the colder GFS once the event came to within 12 hours. Once the 12Z model run started coming in the RUC and GFS had a real good handle on 1000-850 mb thicknesses. At 15Z from the 12Z RUC the 1300m line was from Richmond to Dayton to Marysville. A subtle feature that was evident on the both the 00Z and 12Z model runs on the GFS, NAM, and RUC was a slight cooling in the 1000 to 850 mb layer between 12Z and 18Z. Evaporative cooling may have played a role here. Model Sounding Forecast model soundings, utilizing BUFKIT, were a better discriminator between rain and snow when the area and energy methods were utilized. The 00Z NAM and GFS model sounding for Dayton both indicated precipitation would begin as a mix of rain and snow before changing to snow around 12Z. Figure 9a and Figure 9b show the forecast sounding for 12z from the 00Z model runs of the NAM and GFS. When the 12Z model output arrived, the NAM was a bit cooler than the GFS in the lowest several hundred feet for the initialization, but the near surface wet bulb temperatures were fairly similar (Figure 10a and Figure 10b). However, by 13Z both models clearly indicated the precipitation type would be snow (not shown). The 12Z RUC initialization showed a warmer near surface layer, indicating rain. However, by 13Z it suggested all snow similar to the NAM and GFS (Figure 10c). When looking at an overview model sounding for Dayton the high resolution output from both the GFS and NAM produced 0.54 inches and 0.63 inches of liquid precipitation, respectively (Figure 11a and Figure 11b). The Bourgouin PType (area) method used here suggests that all of the precipitation would fall as snow. In reality, Dayton received 0.64 inches of liquid precipitation for the calendar day with 4.5 inches of snowfall. The forecast precipitation type and amount for Dayton was remarkably consistent from run to run. It should be noted that using this output can be risky with the ultimate challenge of finding the correct signal or kernel of truth within the details. When looking at this same output for Cincinnati (Figure 11c and Figure 11d), both models suggests a mainly snow event. After starting out as rain the NAM suggests 0.5 inches of liquid is expected to fall as snow using the Bourgouin PType and the GFS 0.57 inches. When checking with reality Cincinnati only saw 0.2 inches of snowfall with 0.53 inches of precipitation for the day. However, using SoundingPro to look closer at the details form the 00Z NAM, we find that the actual freezing level for Cincinnati is forecast at ~1.2 kft AGL for the event. This would imply, at best, a mixed rain/snow event, thus drastically cutting down on the amount of accumulations south and east of the I-71 corridor. When comparing 12Z KILN sounding (Figure 12a) with initialized forecast soundings it appears that both the NAM and RUC initialized well (Figure 12b and Figure 12c). Note, the GFS 12z initialization for KILN was not available. The freezing level off the 12Z KILN sounding was 2 kft AGL which matched up fairly closely with the initialized forecast sounding from the NAM and RUC.
|
||||||||||||||||||||||||||||||||||||||||