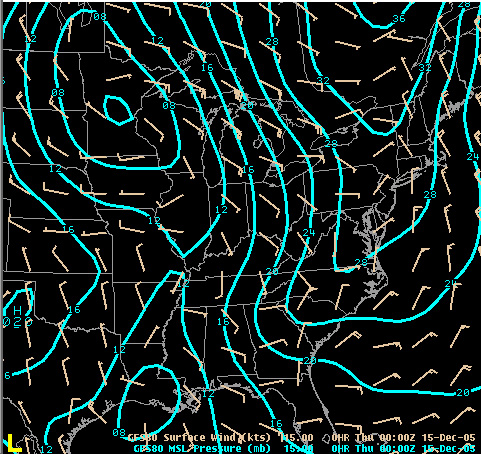
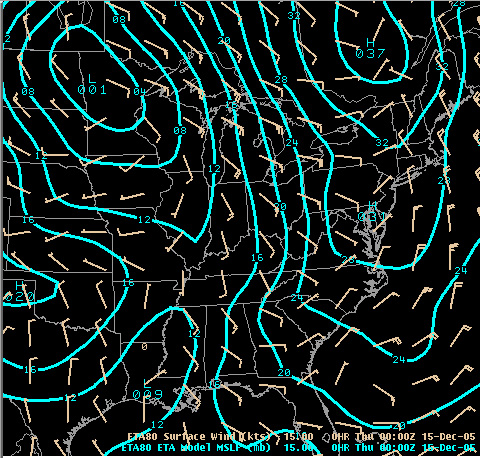
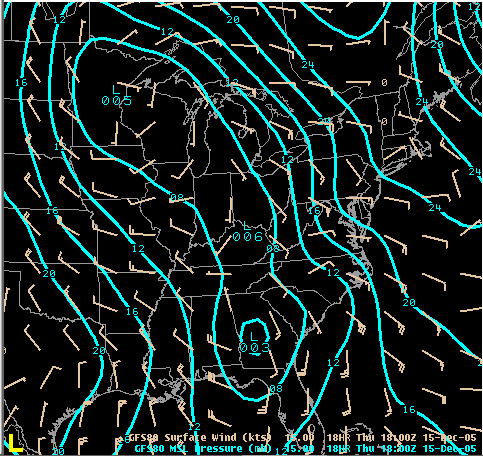
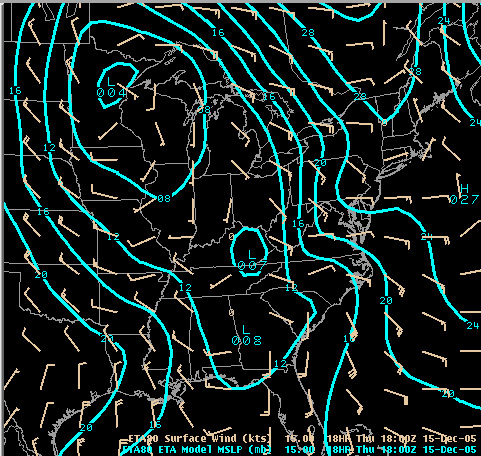
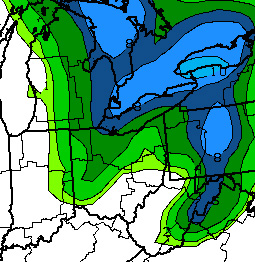
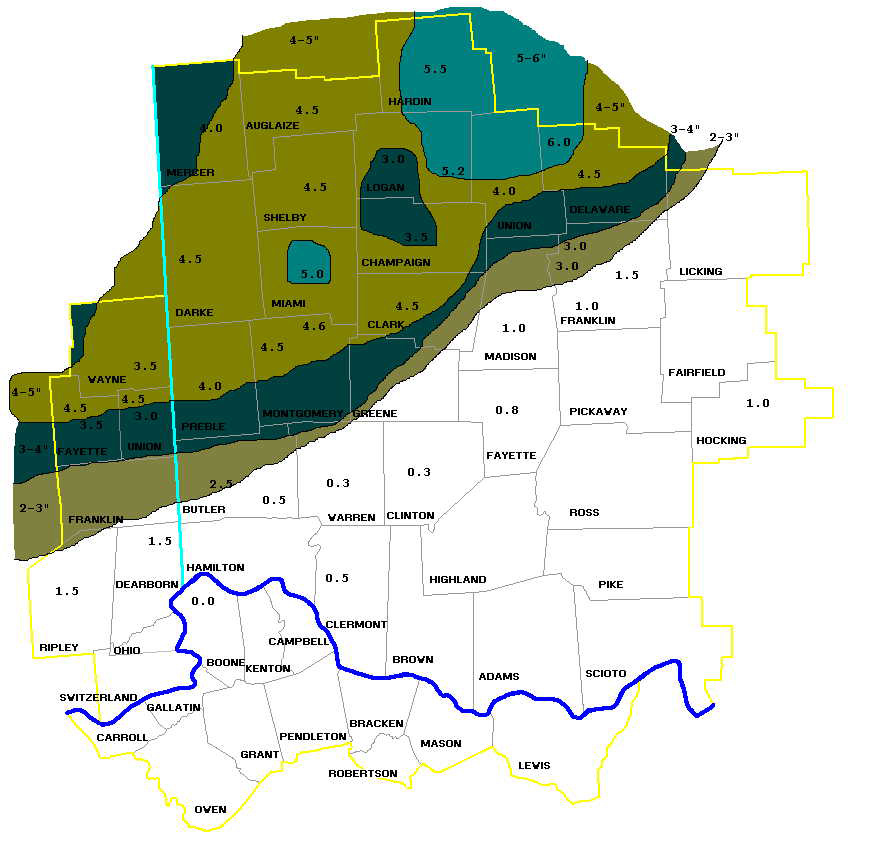
| Section 1 -- Section 2 -- Section 3 -- Section 4 Synopsis The GFS and NAM (models) were remarkably consistent leading up to the wet snow event between 12Z and 18Z on Thursday morning. The 500 mb upper low was placed over the upper Mississippi Valley up to 60 hours before the event. This put the Ohio Valley in broad southwesterly flow prior to the event, which transported moisture from the Gulf of America into the region. At the surface, models remained consistent with placing a low over the upper Mississippi Valley with a secondary low over the lower Mississippi Valley. These lows were connected by a frontal trough which extended through the western Ohio Valley. By 12Z (12-14-05), the models were still in relatively good agreement with the overall pattern for the impending winter storm. However, the GFS was a bit cooler with its low level thermal fields suggesting an impending snow event, while the NAM suggested a rain event. The HPC Winter Weather Desk (WWD) and our forecasters leaned toward the colder GFS solution. By 00Z, the models initialized well placing a surface low along the Minnesota/Iowa border and a secondary low over Alabama, with a frontal trough connecting the two (Figure 1a and Figure 1b). The 12 hour forecast placed the frontal trough over eastern Indiana by 12z. By 18z it was expected to be along the Indiana/Ohio border with a weak reflection of a surface wave (Figure 2a and Figure 2b). At 500 mb the upper trough kept its strength as it went from a positive to a negative tilt between 00Z and 18Z, suggesting significant synoptic lift. Both models suggested about a third of an inch from the 6hr QPF by 18Z. The 00z GFS was the model of choice as its low level thermal fields appeared to handle the current precipitation type better than the NAM. A freezing rain advisory was posted for Wednesday night based on temperatures expected to fall to around or below freezing with light precipitation expected. Temperatures never dropped below freezing and the warmer surface layer observed at 06Z aided in the decision to choose the GFS. The GFS continued to predict a slightly warmer surface layer for the time immediately preceding the snow event. HPC Winter Weather Desk (WWD) HPC WWD proved to be inconsistent through the several days leading up to the event. Ice accumulations were forecast along and ahead of the frontal trough, and the placement from one issuance of WWD to the next jumped significantly across the Ohio Valley. Snowfall amounts during this time frame were progged to be less than two inches over the northern portion of the warning area and appeared to have the highest snow totals located in central PA and north of Lakes Erie and Ontario. The last issuance of WWD (Figure 3) was quite close to ground truth (Figure 4) but did not bolster the confidence in the forecasters as it had shown to be inconsistent over the past several runs. Concluding Remarks Even though the models where relatively consistent with the overall pattern and strength, it was tough to resolve two features which ultimately would make the difference in the precipitation type and amount for this event. It came down to assessing the strength of forcing and the low level thermal fields. These items are reviewed in the Meteorological Assessment section.
|