January 2005 Historic Flooding
Throughout The State of Ohio
A large snowstorm at the end of December 2004 that left 20+ in. of snow in some areas of Ohio, followed by unseasonably warm temperatures in early January 2005, caused snowmelt water to begin filling river channels. Widespread rain during the first part of January ofv 2005 combined with this snowmelt to cause flooding throughout Ohio and mudslides in some areas. Record peak streamflows occurred at nine USGS streamgages. Damages caused by the snowstorms, flooding, and mudslides were severe enough for 62 counties in Ohio to be declared Federal disaster areas. In all, approximately over 3500 private structures were damaged or destroyed, and an estimated $238 million in damages occurred.
Weather Setup
Unseasonably warm temperatures in the Ohio Valley (with daytime highs ranging from 50 to 60°F) at the end of December 2004 through the beginning of January 2005 caused snow that had fallen in late December 2004 to melt This snowmelt and runoff was followed by a series of storms that tracked through the region through the first half of January. This combination of runoff from snowmelt and runoff from rainfall caused many area rivers and waterways to overtop their banks throughout much of Ohio.
The Snow
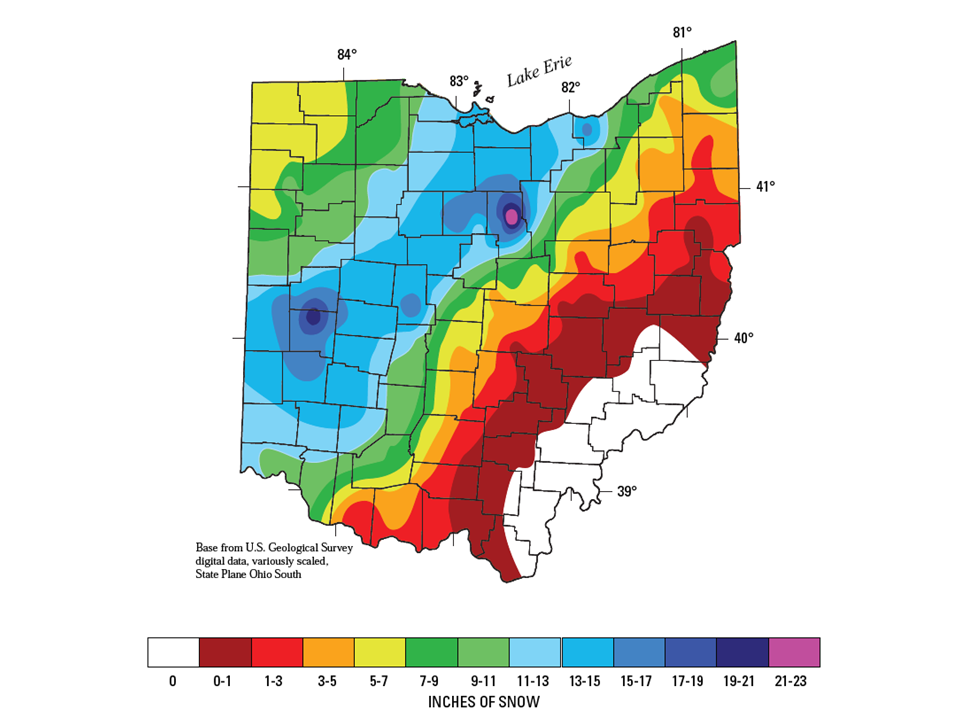
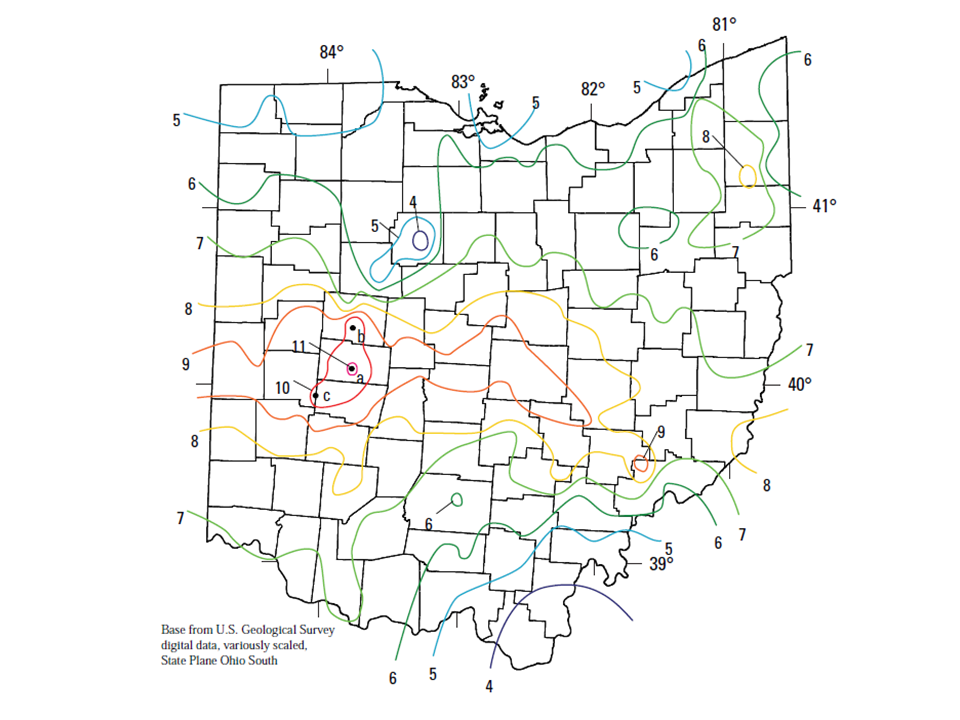
The historic winter storm of December 22-24, 2004 set the stage for the widespread flooding that would ensue only weeks later. A thick blanket of snow and ice covered most of the state of Ohio by Christmas of 2004. Following this winter storm, very cold temperatures settled into the region for several days before the warmth returned by the new year. Although the snow and ice melted quickly once air temperatures warmed into the 50s and 60s, the ground was still frozen from the arctic chill only several days before. As such, much of the water generated from the snowmelt turned into runoff (opposed to being absorbed by the ground itself). This resulted in rises on area rivers even before the very wet period of early January.
 |
The Rain
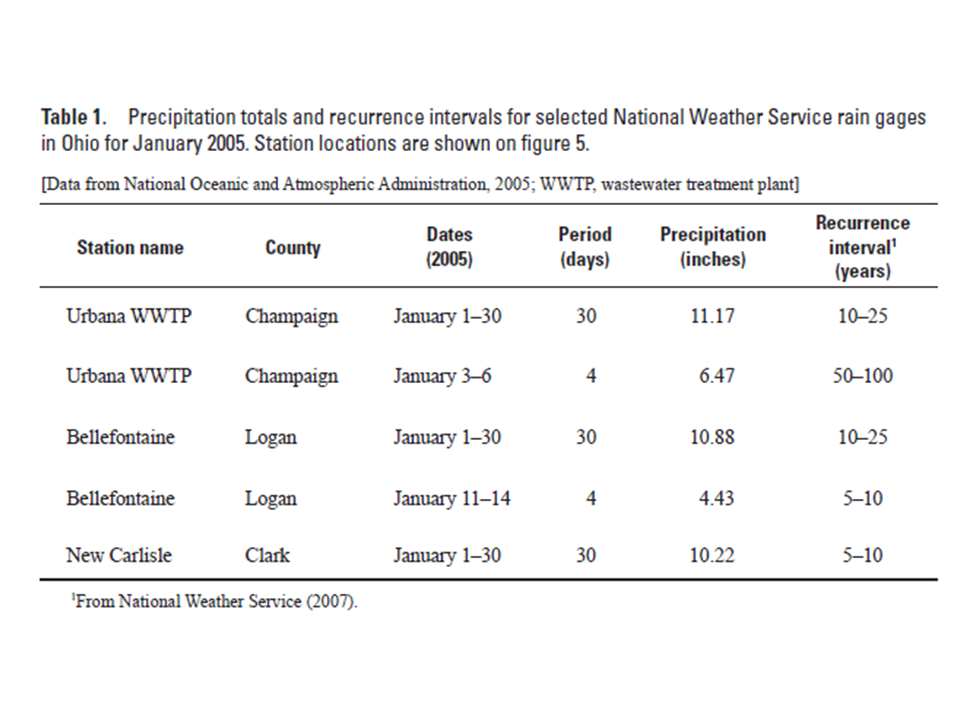
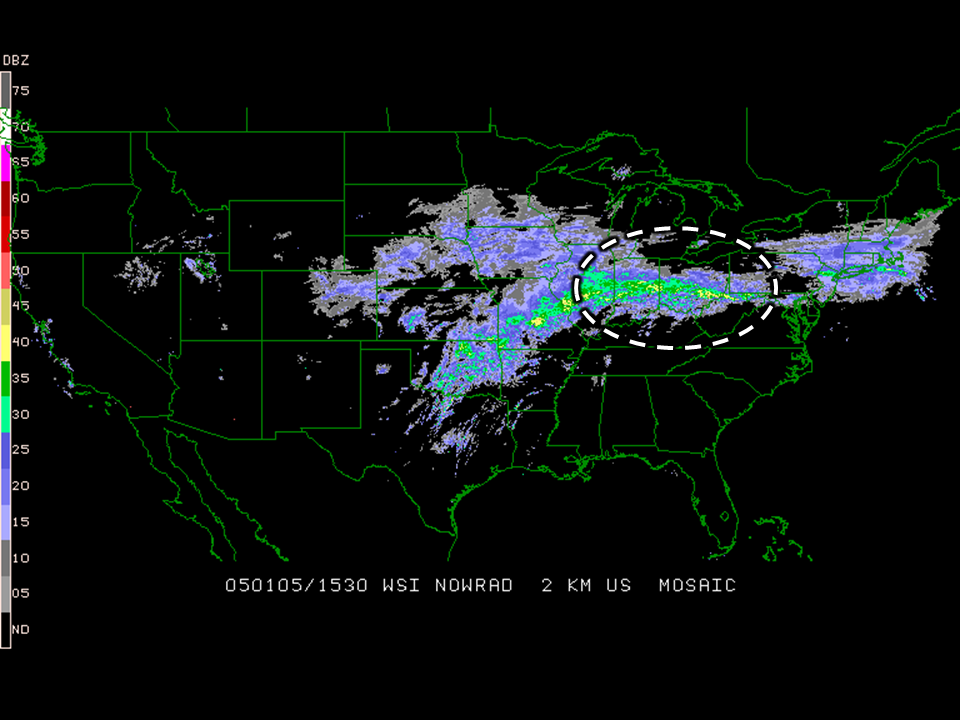
Starting on December 31, 2004, temperatures in the region began to rise as a warm front pivoted through the area. During much of the first half of the month, high temperatures reached into the 50s and 60s across much of the Ohio Valley. On January 3, 2005, a stationary front developed over the Ohio River Valley, providing repeated rounds of rain for parts of the area for several days. Then, on January 6, 2005, this front began to move northeastward as an area of low pressure developed over northern Kentucky. Rain continued over central and southern Ohio until the afternoon of January 6. During this 4-day event, Urbana (Champaign County) received an astounding 6.47 in. of rain. On January 11, 2005, a widespread area of rain ahead of a low pressure system and attendant warm front again moved through the local area. Periods of rain continued for days, with Bellefontaine, in Logan County having recieved 4.43 in. of rain just in this 4-day period alone. Throughout the entire month, Urbana received 11.17 in. of rain (nearly 9 inches above normal for the site). Rainfall intensities and recurrence intervals for selected sites from the storms that affected Ohio during January 2005 are shown below. The time period used in table 1 is variable in order to show the most intense period of rainfall at each of the selected rain gage sites.
 |
 |
|
Precipitation totals and recurrence intervals for selected rain gages in Ohio for January 2005. |
 |
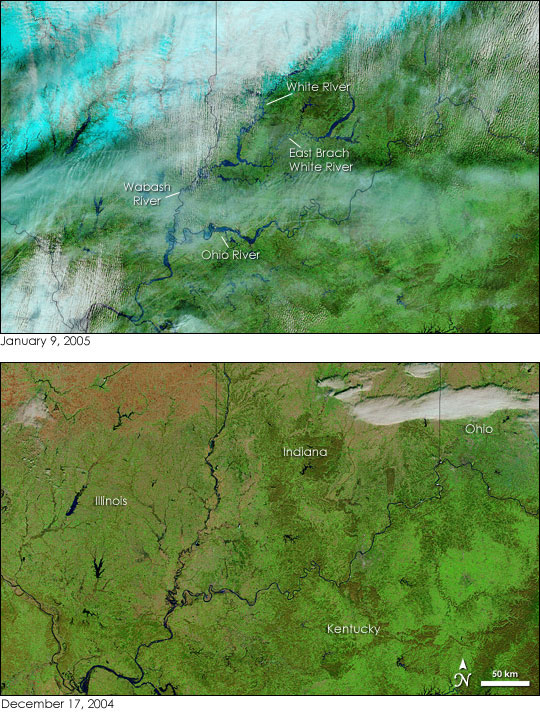
A Satellite Perspective
A small break in the clouds on January 9, 2005, provided the Moderate Resolution Imaging Spectroradiometer (MODIS) flying aboard NASA’s Terra satellite a peek at the swollen rivers of the Ohio River Valley in the Central Lowlands of the United States. Winter weather had pushed the Ohio River and many of its tributaries past flood stage. In the top MODIS image, the Ohio River, Wabash River, White River and the East Branch White River are all swollen compared to conditions on December 17, 2004, shown in the lower image. A false-color band combination has been used to make the flood waters more apparent. In both images, water is dark blue and black, clouds are light blue and white, vegetation is bright green, and bare earth is pink.
 |

