1937 Ohio River Record Flood
The Greatest Natural Disaster In Tri-State History
From Portsmouth to Markland
| The 1937 flood remains the flood of record for many locations along the Ohio River, leaving an estimated 350 dead and nearly 1 Million homeless. The entire river was in flood, with record flooding from Point Pleasant, WV down to the Ohio's confluence with the Mississippi at Cairo, IL. Content in the above tabs features the weather and river response and communities impacted from Portsmouth to near Markland Dam. 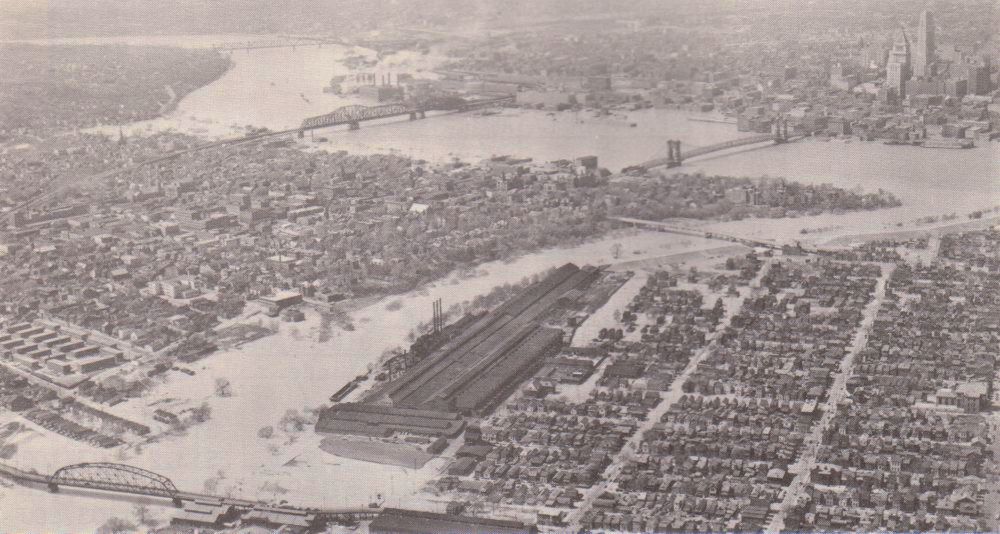 |
|
Image Courtesy of Northern Kentucky Views |
Basic Facts and Statistics
|
The record crest along the Ohio River in 1937 surpassed previously- known records by 6 to 9 feet from near Huntington, WV to the confluence near Cairo, IL. |
|
Much of the January 1937 record rainfall fell in just a 12 day period, from January 13-24. |
|
To this day, January 1937 remains the wettest month on record in Cincinnati. This record of wettest month was nearly surpassed in April 2011. |
|
While 2011 would eventually set a record of wettest year on record at Cincinnati (Cheviot Cooperative Observer Station) and several other Ohio Valley/Great Lakes cities. |
|
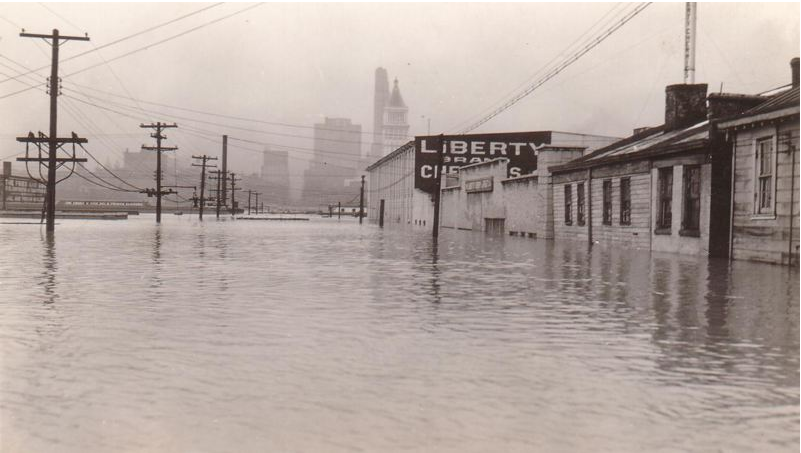
While 15-20% of the City of Cincinnati itself was water-covered, leaving thousands homeless, much of the city outside of the flooded area was largely paralyzed due to lack of fresh water, electricity and heat. |
|
The Roebling suspension bridge in Cincinnati was the only bridge to remain open for the duration of the flood from Pittsburgh all the way to Cairo, IL. |
|
Along the entire length of the Ohio River, it is estimated that 1 Million were left homeless, with 100,000 in the Cincinnati Tri State area. |
|
While the 1937 flood was particularly deadly in Kentucky, the deadliest disaster in both Ohio and Indiana was yet another disastrous flood, the 1913 flood. |
|
Top Ohio River Crests |
|||||
|
Location |
Record Crest Stage/Date |
2nd Highest Crest/Date |
3rd Highest Crest/Date |
4th Highest Crest/Date |
5th Highest Crest/Date |
|
Portsmouth, OH |
74.23' 1/27/1937 |
67.90' 3/31/1913 |
66.3' 2/12/1884 |
64.9' 3/9/1945 |
64.1' 4/17/1948 |
|
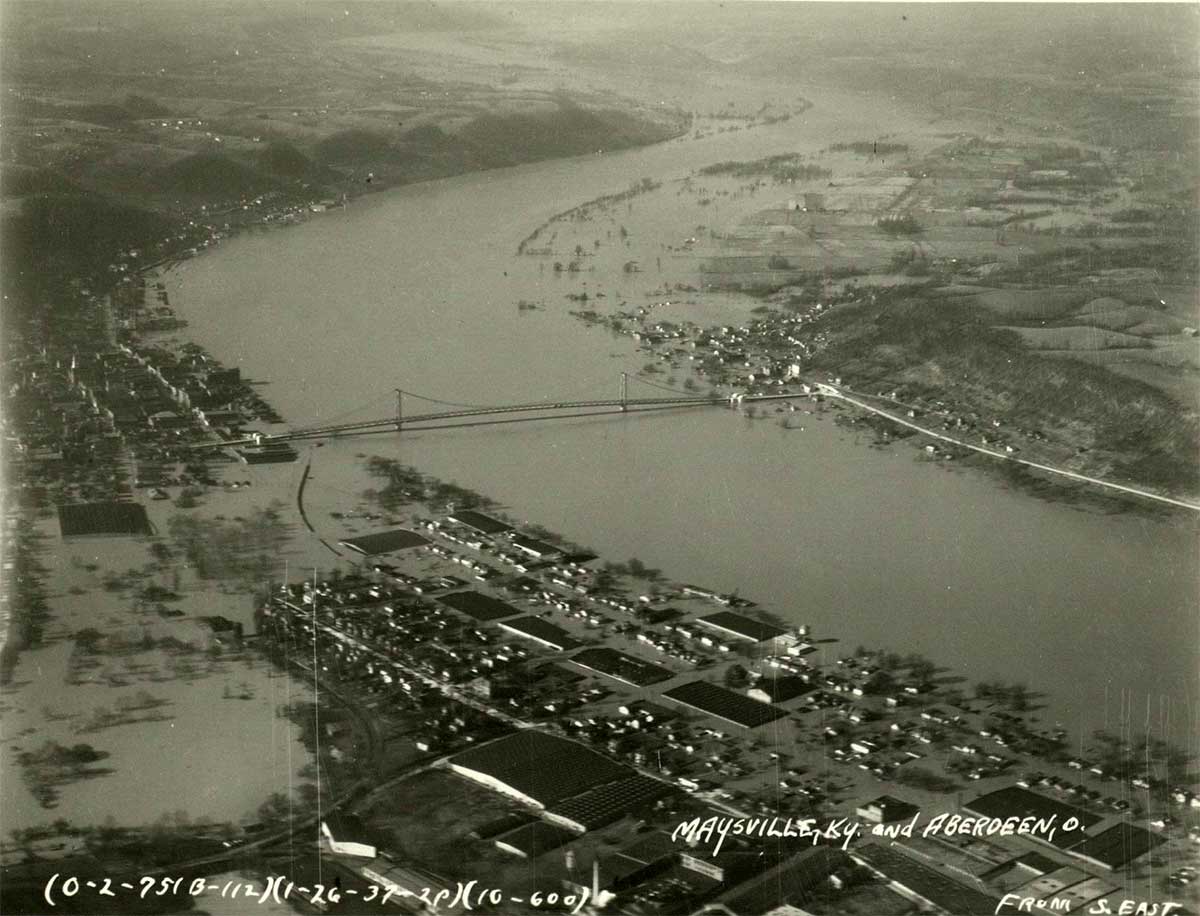
Maysville, KY |
75.3' 1/27/1937 |
68.8' 3/31/1913 |
65.7' 2/14/1884 |
65.5' 3/9/1945 |
64.05' 4/17/1948 |
|
Meldahl/Chilo, OH |
76.0' 1/26/1937 |
67.0' 3/31/1913 |
65.5' 3/6/1945 |
63.2' 3/13/1964 |
62.5' 3/5/1997 |
|
Cincinnati, OH |
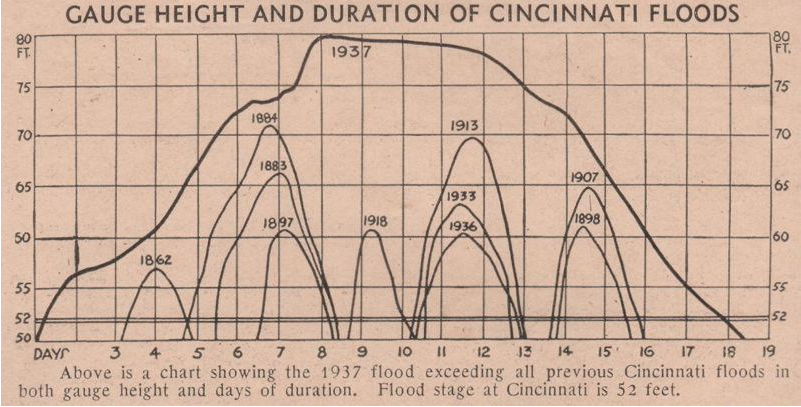
80.0' 1/26/1937 |
71.1' 2/14/1884* |
69.9' 4/1/1913 |
69.2' 3/7/1945 |
66.3' 2/15/1883 |
|
Markland, KY |
76.1 1/26/1937 |
66.7' 4/1/1913 |
65.2' 3/8/1945 |
64.5' 3/12/1964 |
60.7' 3/6/1997 |
|
*The 1884 flood crests are not available at Meldahl and Markland, with continuous records not available at that time. Of the communities above, the most complete river history is in Cincinnati: |
|
Complete History of the Ohio River at Cincinnati
|
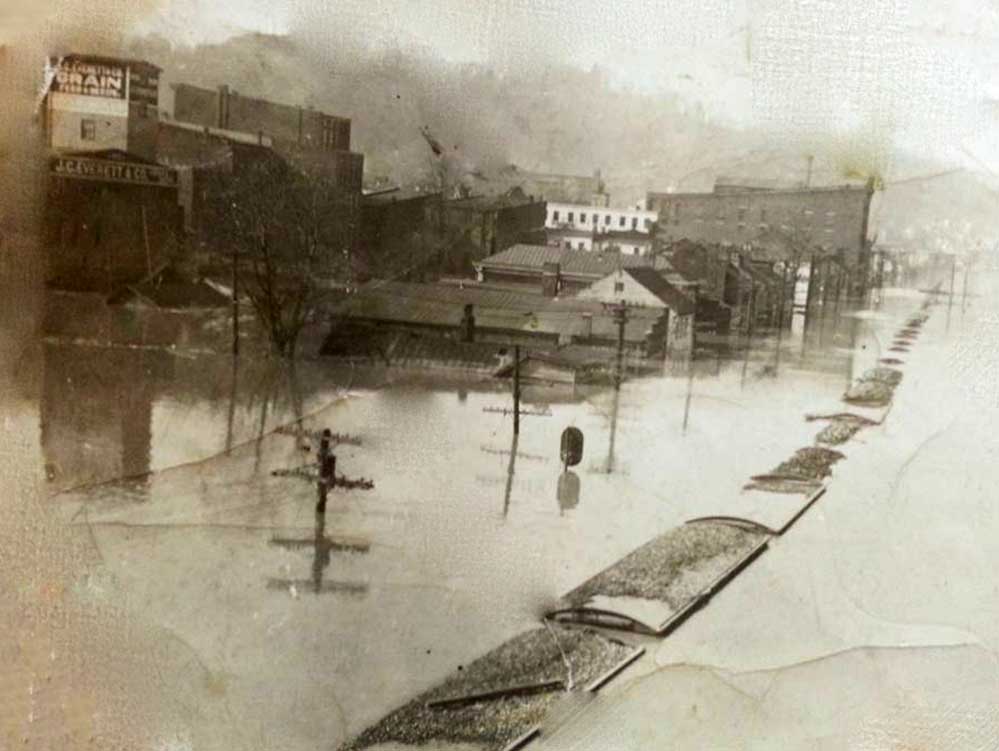
The 1937 flood affected nearly all of the state of Kentucky, as well as southern Ohio/Indiana. The images below are used by permission from several historical societies and collections. Some communities never fully recovered from this epic disaster, while others enacted flood protection and mitigation measures.
Specific impacts/details of an individual community
Cincinnati Museum Center Archives
Scioto Historical
Pictures From The Event
 |
 |
|
Image Courtesy of Northern Kentucky Views |
Image Courtesy of Northern Kentucky Views |
 |
 |
|
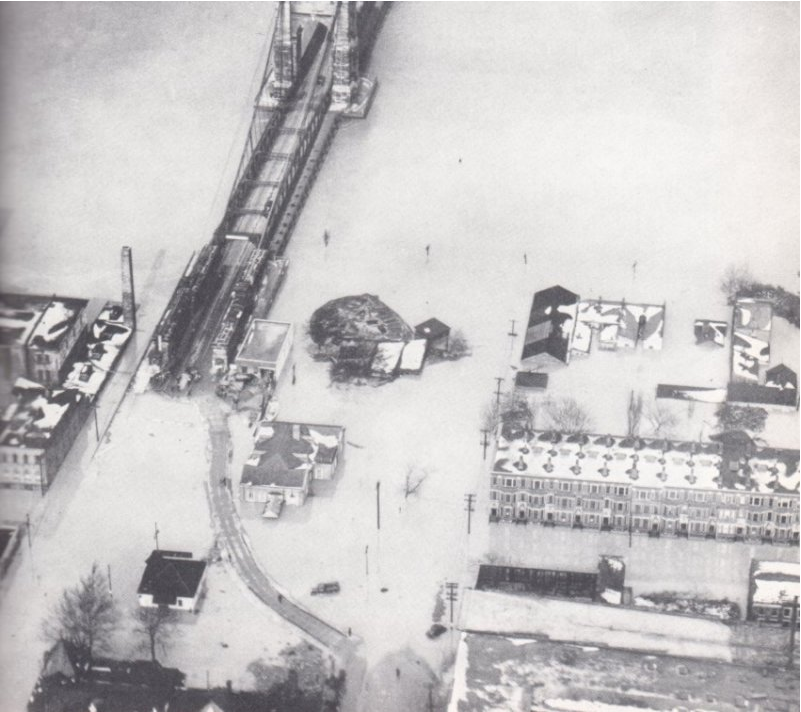
Aerial View of Madison Avenue in Covington in Northern Kentucky |
|
|
Image Courtesy of Northern Kentucky Views |
Image Courtesy of Northern Kentucky Views |
 |
 |
 |
|
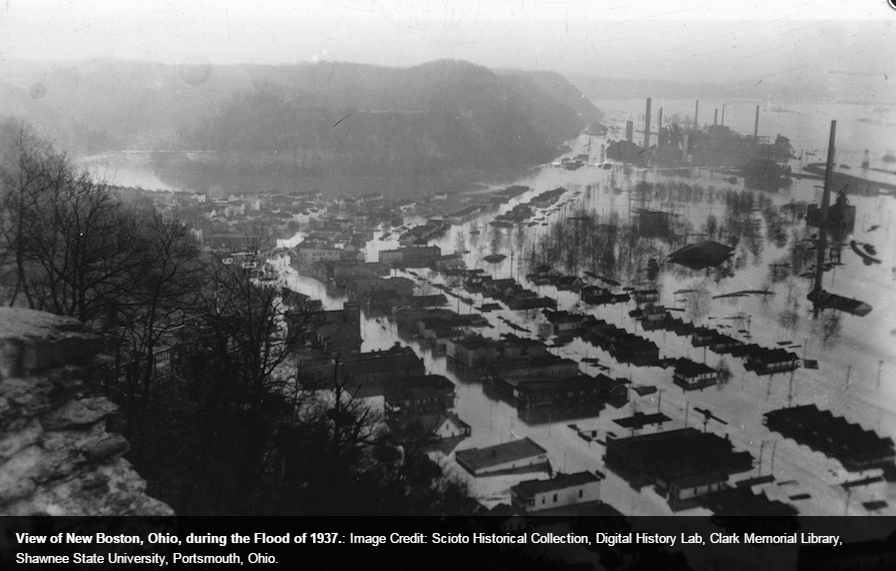
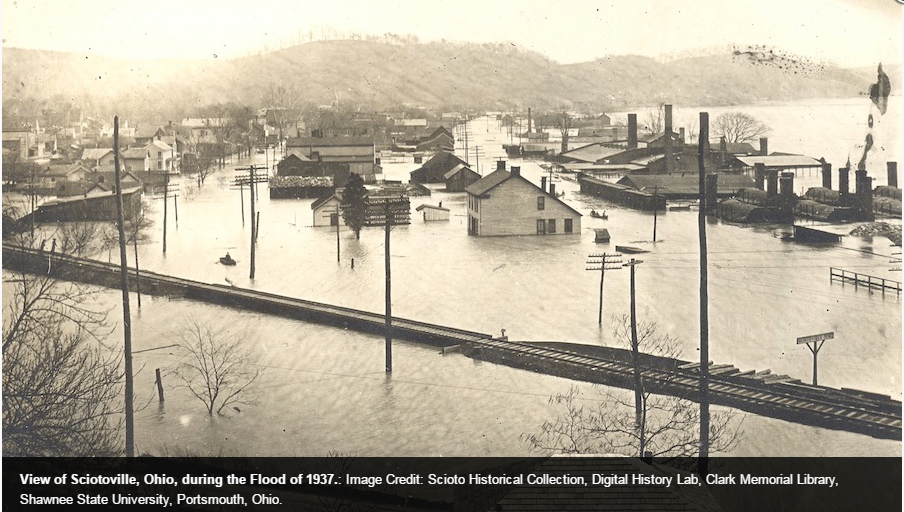
Image Courtesy of the Scioto Historical Collection, Digital History Lab, Clark Memorial Library, Shawnee State University, Portsmouth, Ohio. Image/content taken from Scioto Historical |
Image Courtesy of Northern Kentucky Views |
Image Courtesy of the Scioto Historical Collection, Digital History Lab, Clark Memorial Library, Shawnee State University, Portsmouth, Ohio. |
Weather and River Responses behind the 1937 Record Flood
Julia Dian-Reed, NWS Wilmington
|
In January 1937, the Ohio River reached a record crest from near Huntington, WV down to it's confluence with the Mississippi in a flood that remains the flood of records to date. The only exception is the Ohio River at Cairo, IL near the confluence with the Mississippi, where the decades-old 1937 record was surpassed in the flood of May, 2011. |
|
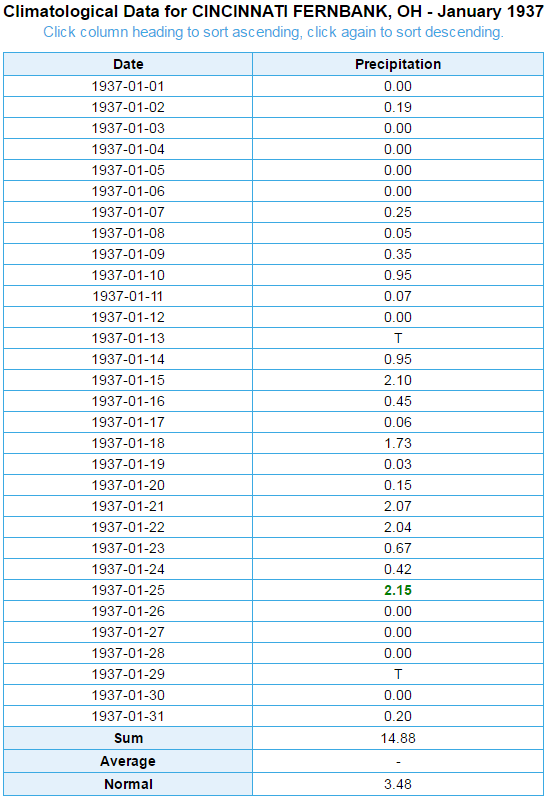
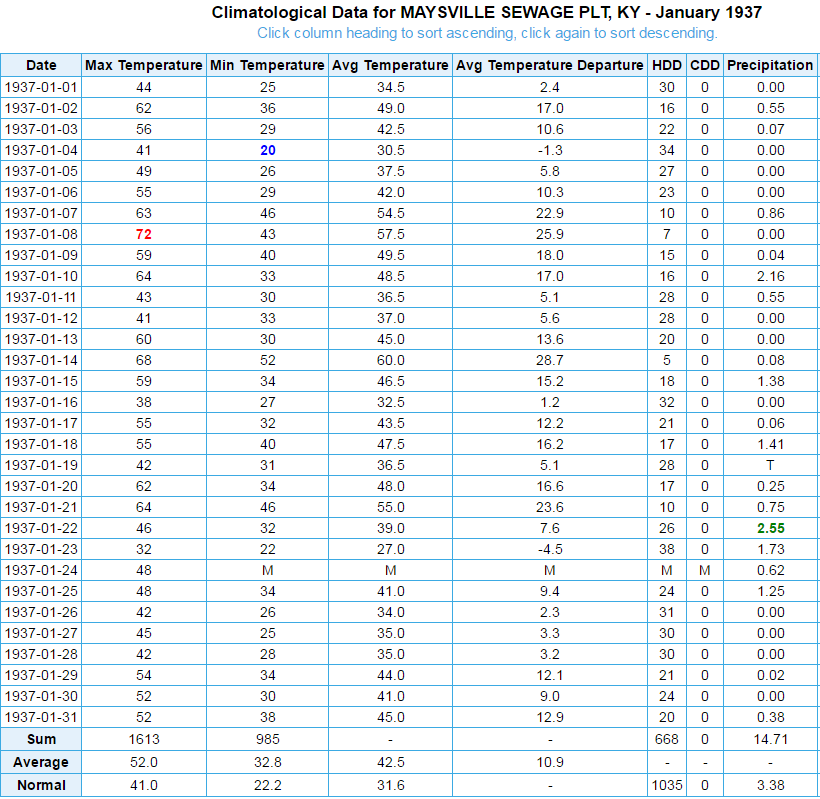
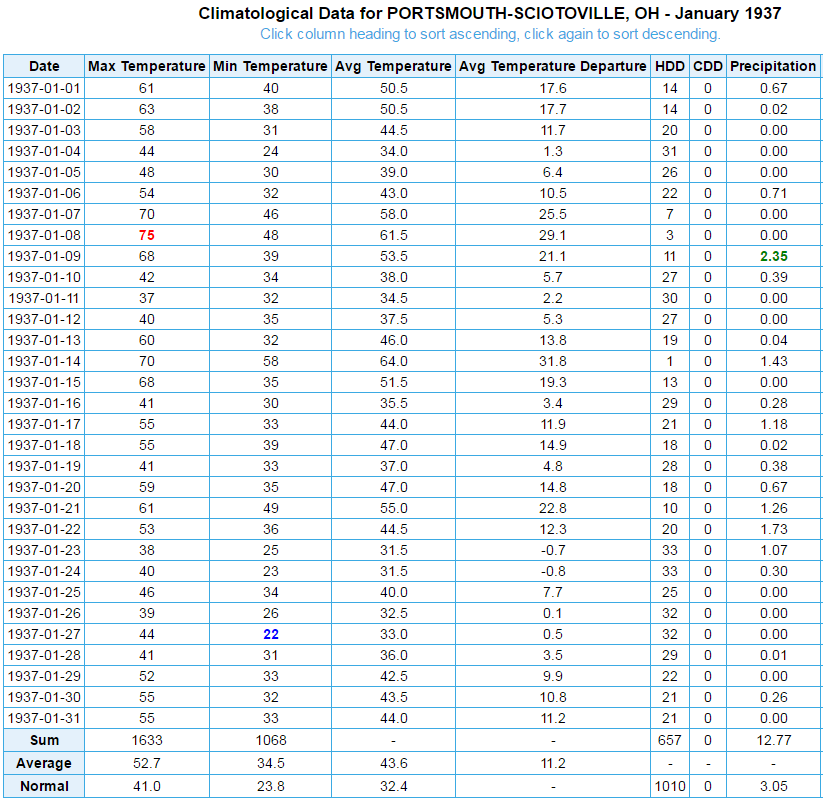
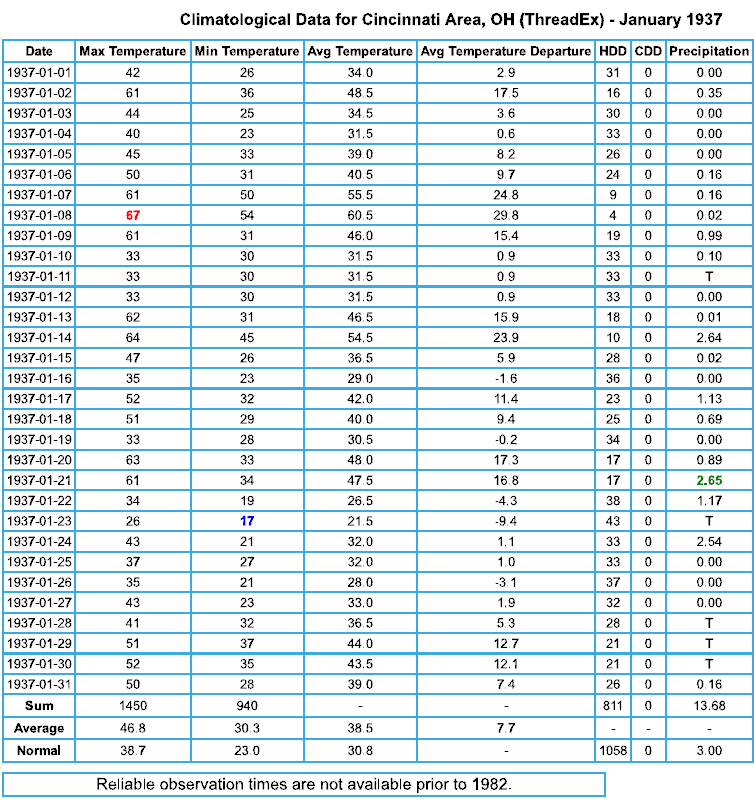
The January 1937 precipitation remains the all-time wettest month in Cincinnati records, at 13.68”. This record was narrowly missed in 2011, when April 2011 totaled 13.52”. Average precipitation for the month of January (using records extending back through 1871) is 3.26”. With no vegetation growth during the month of January, the soil is much more easily saturated, meaning a 13” rainfall has a greater impact on area rivers. The Ohio River flood was much worse downstream near Louisville and toward Paducah Kentucky, as January 1937 rain totals in central Kentucky ranged from 18 to just over 20 inches. |
|
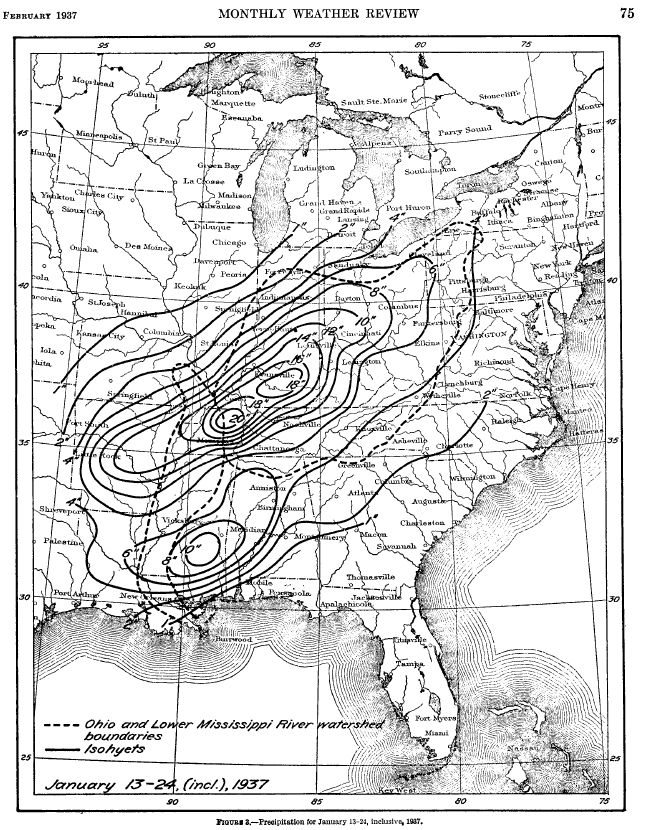
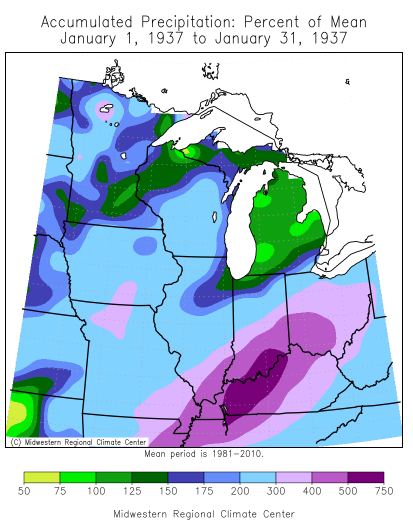
The “rainfall footprint” which caused the 1937 flood was similar to other very high floods along the Ohio River, where the heaviest rain was centered right along the axis of the Ohio River itself, thus allowing the runoff to reach the Ohio River without much delay. |
|
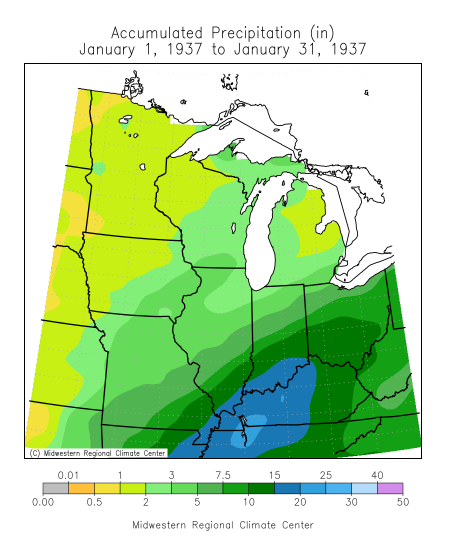
The first part of January 1937 did not experience particularly heavy precipitation, and the Ohio River at Cincinnati was only slightly elevated with a stage of 36.6’ on January 10. Tremendous precipitation would mark a 12 day period from Jan 13-24 (see image below of the rainfall analyses of this 12 day rain). The river surpassed its 52’’ flood stage on January 18. |
 |
 |
|
Historical Height Duration of Cincinnati Floods Through 1937 |
Twelve (12) Day Estimated Precipitation In the Ohio and Tennessee Valleys |
|
Image Courtesy of... |
Image Courtesy of... |
 |
 |
 |
 |
 |
 |
 |
|
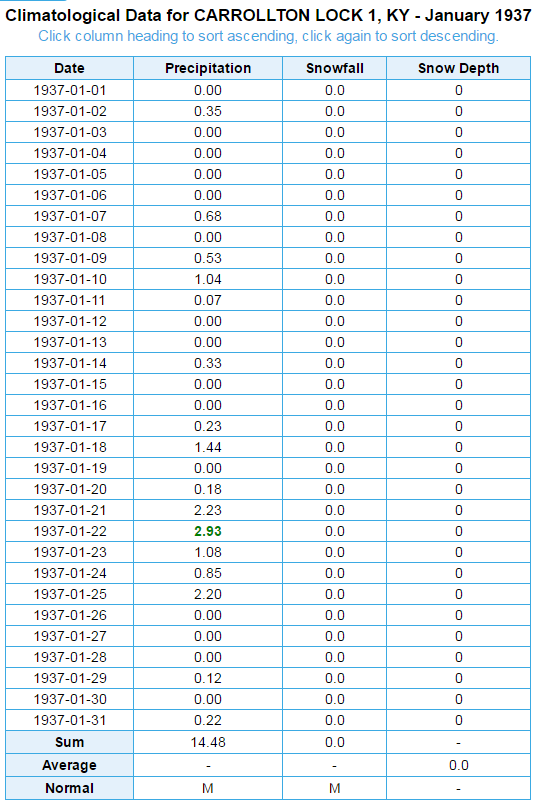
Data Courtesy of the Midwest Regional Climate Center |
Data Courtesy of the Midwest Regional Climate Center |
Ohio Valley Rainfall and River Forecasting, Monitoring and Navigation
|
In the flood of 1937, while there was a U.S. Weather Bureau at that time, river flood forecasting had not yet been established. Weather forecasting of the day was largely done via receiving reports via teletype of weather observations around the country and making attempts to extrapolate that weather to the central Ohio Valley. |
|
Per the History of the National Weather Service (https://www.weather.gov/timeline), the ‘Weather Bureau’ at that time began monitoring and began early forecasting of rivers in the late 1940s. The Cincinnati/Ohio River Forecast Center, along with the Kansas City River Forecast Centers, were the first 2 such offices in the country charged with providing forecasts for select rivers in the U.S. |
|
Early radar capabilities were not available until the 1950s, and radar estimates of rainfall at that time were very crude. Today, while radar rainfall estimates are much closer to approximating rainfall values and subsequently flood forecasting, accurate real-time rain gage observations are still superior to radar estimates. |
|
While the Weather Bureau back in the mid 20th century did own/operate some river gauge stations, the consistent effort at this critical stream flow monitoring was largely held by the U.S. Geological Survey. Today, the USGS partners with state, federal and local agencies in operating and maintaining gauging stations across the Ohio Valley. |
|
The U.S. Army Corps of Engineers is responsible for water management, ensuring safe navigation, as well as some flood mitigation within the Ohio River basin. A common misconception about the navigation locks and dams along the Ohio River is that they affect or control flooding. Although they appear to be large flood control structures like a reservoir, locks and dams do not store water; they cannot prevent or cause flooding and they have no flood control capabilities. The Ohio River navigation locks and dams were constructed to maintain a sufficiently deep channel for the safe transport of commodities by commercial tows and provide no benefits for flood control. |

