 |
|
| Latest Water Temp |
| 87° |
Myrtle Beach, located in Horry County, is a part of South Carolina's Grand Strand. From June through early October water temperatures are practically tropical making this area perfect for swimming and beach activities. The water cools significantly during the winter months due to cold offshore winds and longer nights. Water temperatures here tend to be both hotter during the summer and cooler during the winter than at Wrightsville Beach, probably due to shallower water depth atop the broad continental shelf. Other beach communities of Horry and Georgetown counties should have very similar water temperatures including Little River, North Myrtle Beach, Surfside Beach, Murrells Inlet, Litchfield Beach, and Pawleys Island.
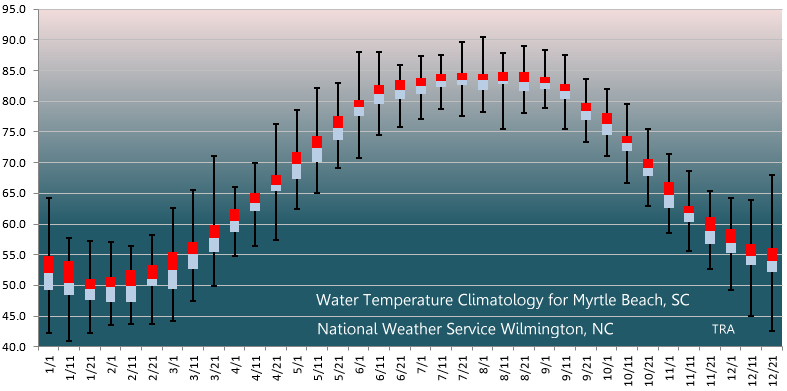
Average Water Temperatures for Myrtle Beach, SC
|
January |
February |
March |
April |
May |
June |
||||||||||||
|
1-10 |
11-20 |
21-31 |
1-10 |
11-20 |
21-29 |
1-10 |
11-20 |
21-31 |
1-10 |
11-20 |
21-30 |
1-10 |
11-20 |
21-31 |
1-10 |
11-20 |
21-30 |
|
52 |
50 |
49 |
50 |
50 |
51 |
52 |
55 |
58 |
60 |
63 |
66 |
70 |
72 |
76 |
79 |
81 |
82 |
|
July |
August |
September |
October |
November |
December |
||||||||||||
|
1-10 |
11-20 |
21-31 |
1-10 |
11-20 |
21-31 |
1-10 |
11-20 |
21-30 |
1-10 |
11-20 |
21-31 |
1-10 |
11-20 |
21-30 |
1-10 |
11-20 |
21-31 |
|
82 |
83 |
83 |
83 |
83 |
83 |
83 |
82 |
78 |
76 |
73 |
69 |
65 |
62 |
59 |
57 |
55 |
54 |
Average values are given for early (1st-10th), mid (11th-20th), and late (21st-31st) each month.
Detailed Water Temperature Statistics for Myrtle Beach, SC
Box and Whisker statistical plot. Colored boxes indicate the 25th through 75th percentiles, with the red/blue center of each box indicating the mean (average) value. The black whiskers indicate the highest and lowest temperatures ever observed during each roughly 10 day time period throughout the year.
Statistical table of water temperature data. In addition to mean, highest and lowest values for each time period, various percentiles are displayed.
|
|
|
Jan |
|
|
Feb |
|
|
Mar |
|
|
Apr |
|
|
May |
|
|
Jun |
|
|
|
1-10 |
11-20 |
21-31 |
1-10 |
11-20 |
21-29 |
1-10 |
11-20 |
21-31 |
1-10 |
11-20 |
21-30 |
1-10 |
11-20 |
21-31 |
1-10 |
11-20 |
21-30 |
|
Highest |
64.2 |
57.7 |
57.2 |
57.0 |
56.5 |
58.3 |
62.6 |
65.5 |
71.1 |
66.0 |
70.0 |
76.3 |
78.6 |
82.2 |
82.9 |
88.0 |
88.0 |
86.0 |
|
Upper 0.1% |
63.9 |
57.2 |
56.7 |
56.8 |
56.5 |
57.9 |
61.3 |
64.2 |
66.7 |
65.8 |
69.6 |
75.2 |
77.9 |
81.5 |
82.0 |
87.3 |
87.4 |
85.8 |
|
Upper 1% |
63.5 |
56.1 |
55.4 |
56.3 |
56.1 |
57.0 |
59.7 |
61.9 |
64.2 |
65.1 |
68.4 |
72.3 |
76.1 |
79.0 |
80.8 |
86.4 |
86.4 |
85.1 |
|
Upper 5% |
59.0 |
55.8 |
54.7 |
55.6 |
55.4 |
55.9 |
58.8 |
60.3 |
63.0 |
64.6 |
67.1 |
70.5 |
74.5 |
77.2 |
79.2 |
84.6 |
85.5 |
84.6 |
|
Upper 10% |
57.7 |
55.0 |
53.2 |
55.0 |
54.5 |
55.4 |
57.9 |
59.5 |
62.2 |
63.9 |
66.4 |
69.8 |
73.2 |
75.9 |
78.6 |
81.7 |
84.4 |
84.0 |
|
Upper 25% |
54.9 |
54.0 |
51.1 |
51.4 |
52.5 |
53.2 |
55.4 |
57.0 |
59.9 |
62.4 |
65.1 |
68.0 |
71.8 |
74.3 |
77.5 |
80.2 |
82.6 |
83.5 |
|
MEAN |
52.0 |
50.3 |
49.4 |
49.8 |
49.9 |
51.1 |
52.4 |
55.1 |
57.8 |
60.4 |
63.5 |
66.4 |
69.8 |
72.3 |
75.6 |
79.1 |
81.2 |
81.9 |
|
Lower 25% |
49.3 |
48.4 |
47.7 |
47.3 |
47.3 |
49.8 |
49.5 |
52.7 |
55.4 |
58.6 |
62.1 |
65.3 |
67.3 |
70.2 |
73.8 |
77.5 |
79.5 |
80.4 |
|
Lower 10% |
45.0 |
42.8 |
44.8 |
46.4 |
45.9 |
45.3 |
46.9 |
51.1 |
54.1 |
56.8 |
61.0 |
62.4 |
65.5 |
68.4 |
71.8 |
76.5 |
78.6 |
79.2 |
|
Lower 5% |
44.6 |
42.3 |
43.9 |
46.0 |
45.5 |
44.2 |
46.2 |
50.7 |
53.4 |
56.1 |
60.1 |
61.3 |
64.8 |
66.4 |
70.7 |
75.9 |
78.1 |
78.4 |
|
Lower 1% |
43.0 |
41.5 |
43.2 |
45.3 |
45.0 |
44.1 |
44.4 |
48.6 |
52.5 |
55.4 |
57.0 |
60.0 |
63.9 |
65.3 |
70.0 |
74.7 |
77.4 |
77.9 |
|
Lower 0.1% |
42.3 |
41.0 |
42.4 |
44.6 |
43.9 |
43.7 |
44.2 |
47.5 |
52.0 |
55.2 |
56.5 |
58.4 |
63.0 |
65.1 |
69.4 |
71.2 |
75.4 |
77.2 |
|
Lowest |
42.3 |
41.0 |
42.3 |
43.5 |
43.7 |
43.7 |
44.2 |
47.5 |
49.8 |
54.9 |
56.5 |
57.4 |
62.4 |
65.1 |
69.1 |
70.7 |
74.5 |
75.7 |
|
|
|
Jul |
|
|
Aug |
|
|
Sep |
|
|
Oct |
|
|
Nov |
|
|
Dec |
|
ANNUAL |
|
|
1-10 |
11-20 |
21-31 |
1-10 |
11-20 |
21-31 |
1-10 |
11-20 |
21-30 |
1-10 |
11-20 |
21-31 |
1-10 |
11-20 |
21-30 |
1-10 |
11-20 |
21-31 |
|
|
Highest |
87.4 |
87.6 |
89.6 |
90.5 |
87.8 |
89.1 |
88.3 |
87.6 |
83.7 |
82.0 |
79.5 |
75.6 |
71.4 |
68.7 |
65.3 |
64.2 |
63.9 |
68.0 |
90.5 |
|
Upper 0.1% |
86.4 |
87.3 |
89.1 |
90.1 |
87.8 |
88.3 |
88.2 |
87.4 |
83.5 |
82.0 |
79.2 |
74.1 |
70.7 |
68.5 |
65.3 |
64.0 |
63.9 |
67.8 |
88.5 |
|
Upper 1% |
85.8 |
86.9 |
88.0 |
89.2 |
87.6 |
86.9 |
87.4 |
86.9 |
82.9 |
81.3 |
77.5 |
73.0 |
70.3 |
68.2 |
64.8 |
63.5 |
63.1 |
65.5 |
86.4 |
|
Upper 5% |
85.3 |
86.2 |
86.7 |
87.6 |
86.9 |
86.0 |
86.0 |
86.2 |
82.0 |
79.9 |
77.2 |
72.1 |
70.0 |
66.6 |
63.1 |
61.3 |
61.7 |
61.3 |
84.6 |
|
Upper 10% |
84.7 |
85.6 |
85.6 |
86.0 |
86.0 |
85.5 |
85.1 |
84.4 |
81.5 |
79.2 |
76.5 |
71.4 |
69.4 |
65.7 |
62.2 |
60.3 |
59.0 |
59.4 |
83.5 |
|
Upper 25% |
83.8 |
84.4 |
84.6 |
84.4 |
84.7 |
84.7 |
84.0 |
82.8 |
79.7 |
78.1 |
74.3 |
70.5 |
66.9 |
63.0 |
61.2 |
59.2 |
56.7 |
56.1 |
80.2 |
|
MEAN |
82.4 |
83.4 |
83.4 |
83.4 |
83.3 |
83.1 |
83.0 |
81.6 |
78.4 |
76.3 |
73.2 |
69.1 |
64.8 |
61.8 |
58.9 |
57.0 |
54.9 |
53.9 |
67.2 |
|
Lower 25% |
81.1 |
82.4 |
82.6 |
81.9 |
82.8 |
81.7 |
82.0 |
80.4 |
77.0 |
74.5 |
72.0 |
67.8 |
62.6 |
60.3 |
56.7 |
55.2 |
53.2 |
52.2 |
55.4 |
|
Lower 10% |
79.9 |
81.7 |
81.0 |
81.0 |
79.2 |
80.2 |
80.8 |
78.6 |
75.2 |
73.2 |
71.1 |
65.8 |
61.5 |
58.8 |
55.2 |
53.8 |
50.5 |
45.9 |
50.2 |
|
Lower 5% |
79.5 |
80.6 |
79.9 |
80.6 |
76.8 |
79.3 |
80.2 |
77.7 |
74.8 |
72.7 |
70.3 |
64.9 |
60.4 |
57.7 |
54.9 |
52.7 |
46.6 |
45.0 |
47.5 |
|
Lower 1% |
78.3 |
79.3 |
77.7 |
79.3 |
75.9 |
78.4 |
79.7 |
77.0 |
73.9 |
72.0 |
68.2 |
64.0 |
59.0 |
57.0 |
54.1 |
50.5 |
45.5 |
43.3 |
44.2 |
|
Lower 0.1% |
77.2 |
78.8 |
77.5 |
78.4 |
75.7 |
78.3 |
79.3 |
75.9 |
73.6 |
71.8 |
66.9 |
63.5 |
58.6 |
55.9 |
53.4 |
49.5 |
45.1 |
43.0 |
42.1 |
|
Lowest |
77.2 |
78.8 |
77.5 |
78.3 |
75.6 |
78.1 |
79.0 |
75.6 |
73.4 |
71.1 |
66.7 |
63.0 |
58.5 |
55.6 |
52.7 |
49.3 |
45.0 |
42.6 |
41.0 |
After quality control, a total of 734,148 individual water temperature observations were available to calculate the values used in this climatology. Data was collected from the NOAA/NOS weather and tide station on Springmaid Pier over the period 2005 through 2016. Springmaid Pier and the weather station were destroyed by Hurricane Matthew on October 8, 2016. Historic weather and tide data for this site is available here.
|
Final weather and tide data from Springmaid Pier in Myrtle Beach, SC as Hurricane Matthew struck. Large crashing waves destroyed the pier and the weather station. |
Page Author and Statistical Analysis: Tim Armstrong
Page Created: July 31, 2014
Last Updated: February 28, 2019


 Coastal Flood