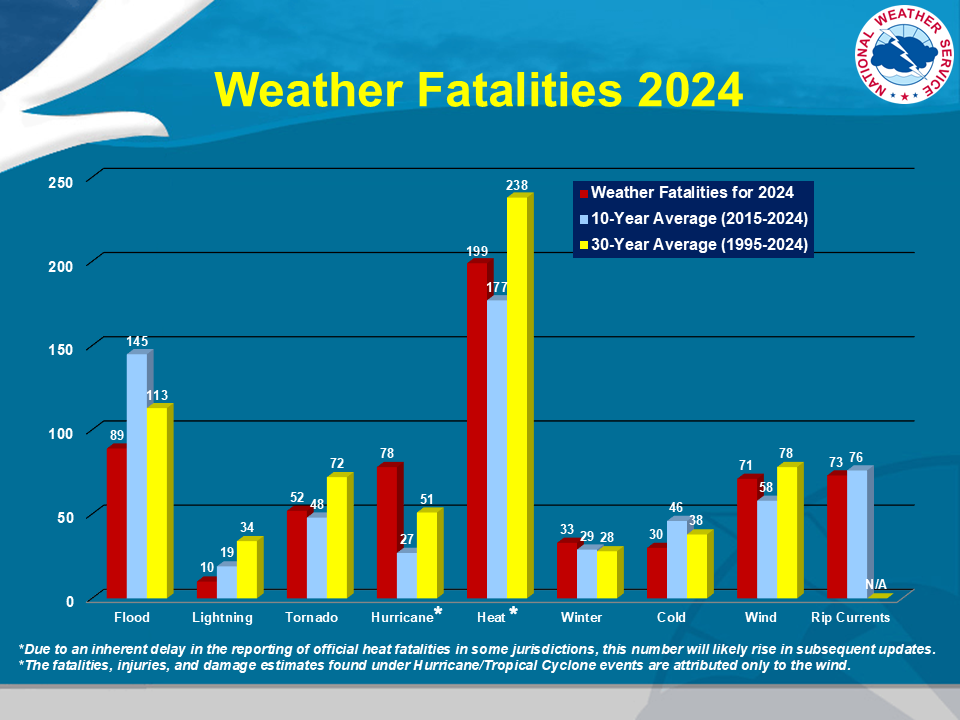
Disclaimer: The Centers for Disease Control and Prevention is the official government source of cause of death information in the U.S., including weather-related fatalities.
 |
 |
Learn more about heat index here. Learn more about heat index here. Learn more about WBGT via this info guide and webpage.
Local Heat Forecast Maps
Local Heat Index Risk & WBGT Risk Maps
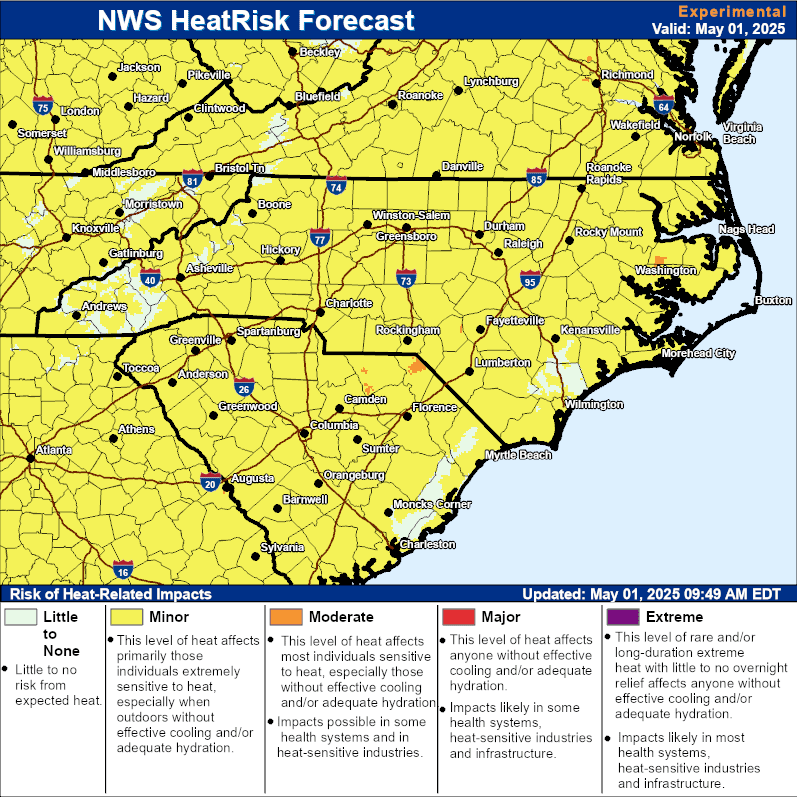
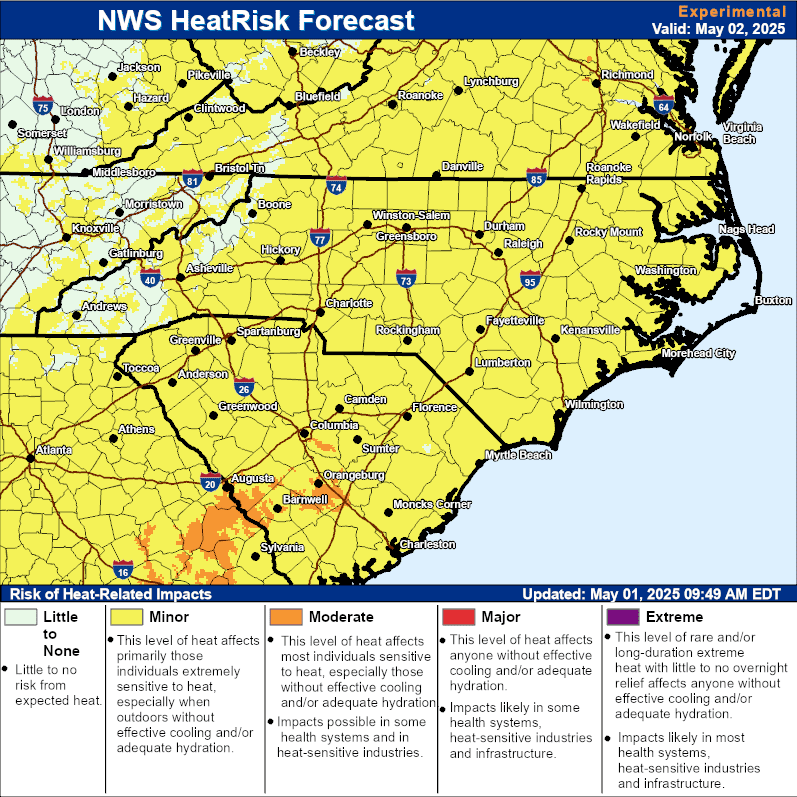
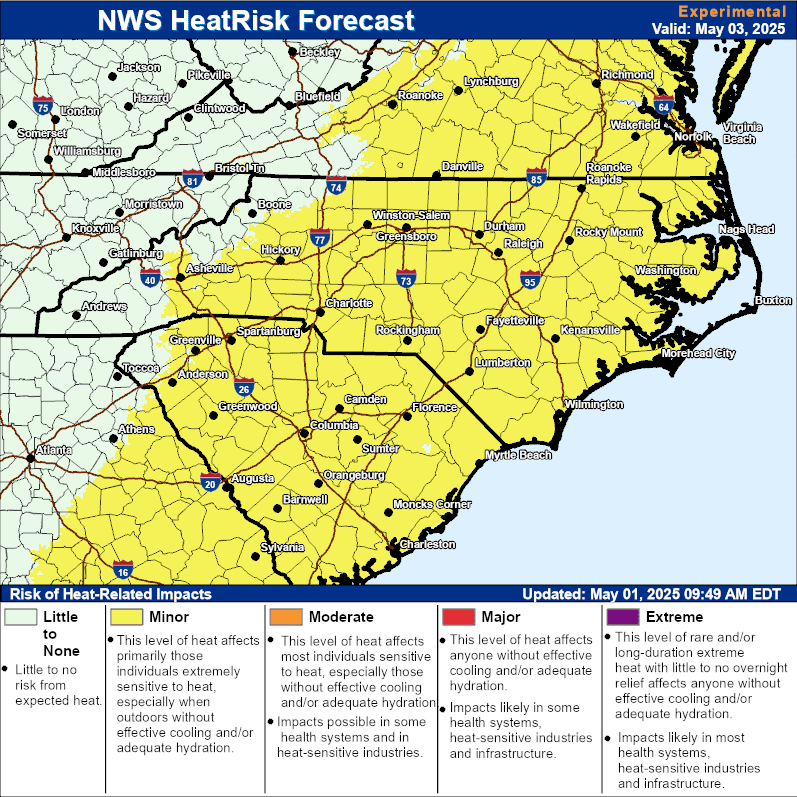
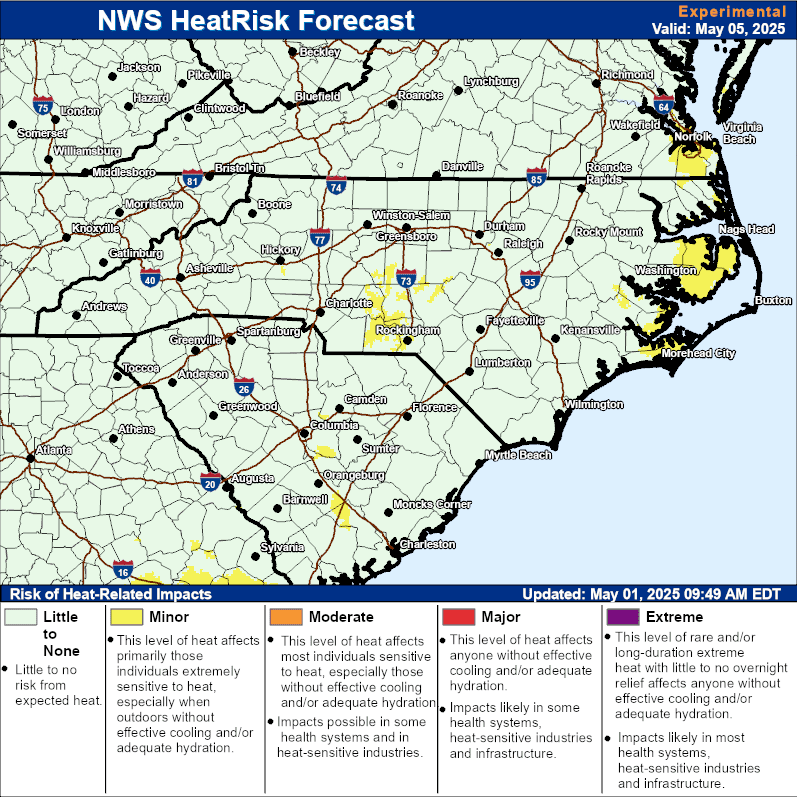
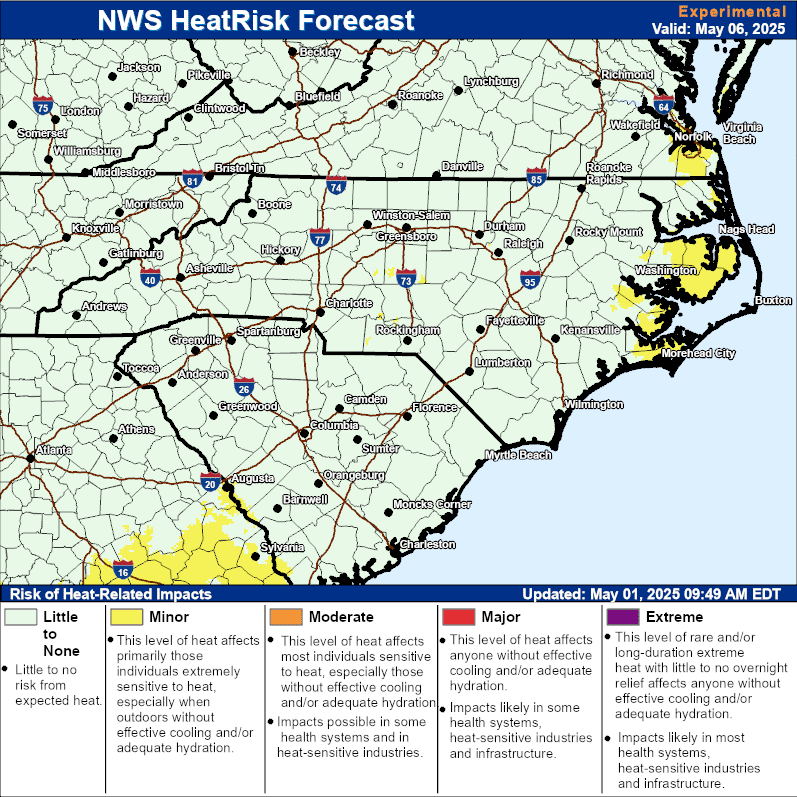
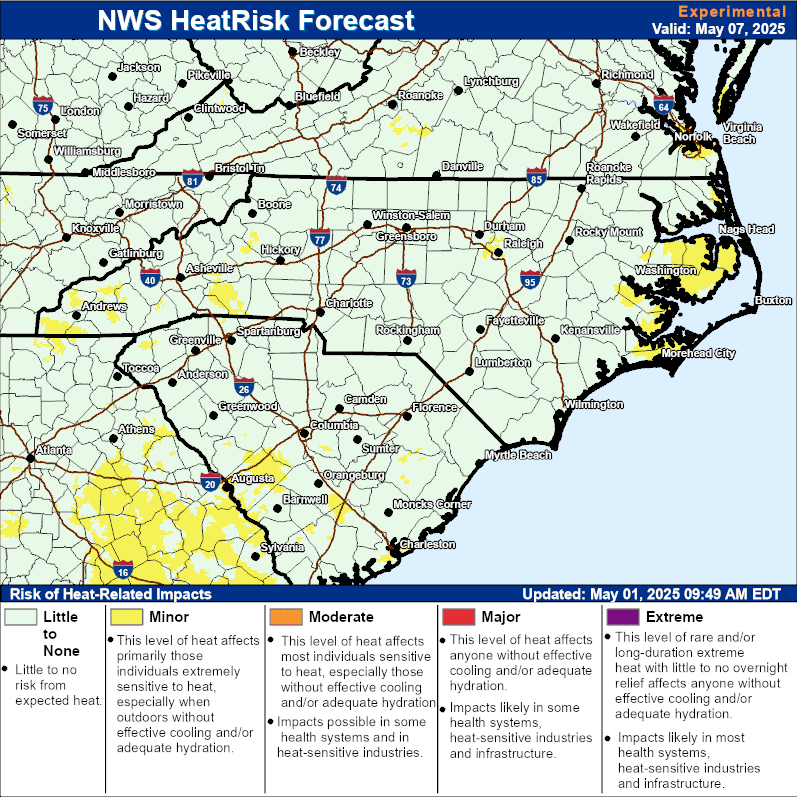
National HeatRisk Maps & Temp Outlooks
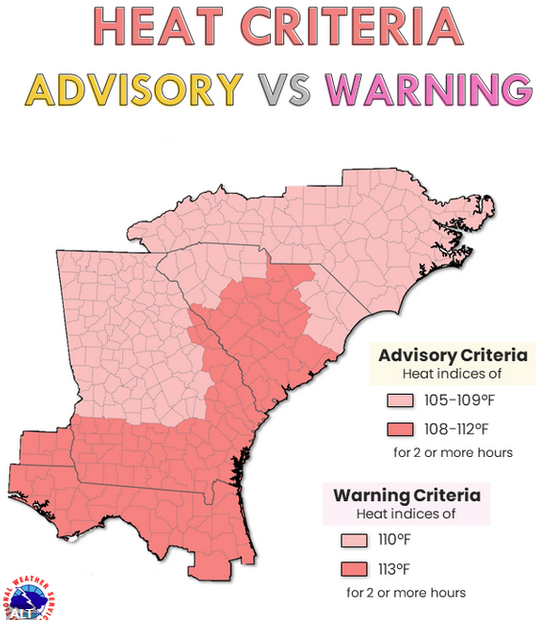
Local Heat Alert Criteria
Local Historic Heat Waves
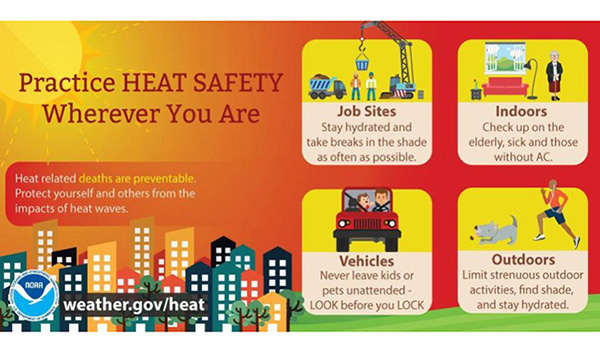
Heat Safety Info & Add'l Resources
Recursos térmicos españoles
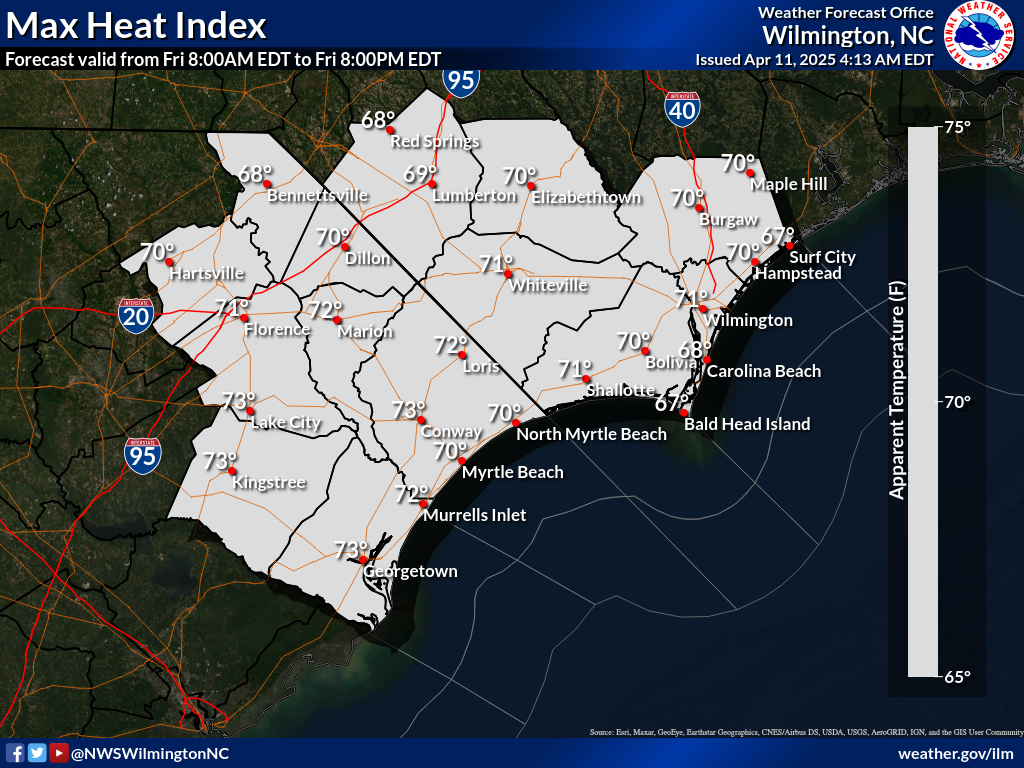
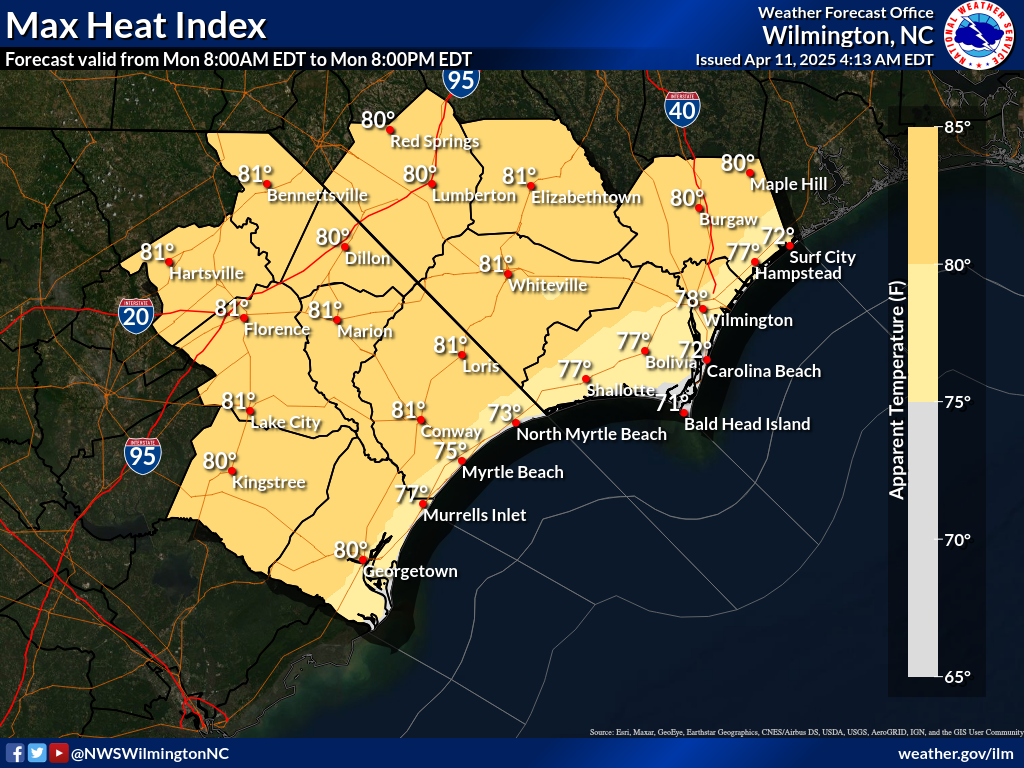
NOTE: Max Heat Index graphics are only valid April through October.
Click on the images to enlarge them.
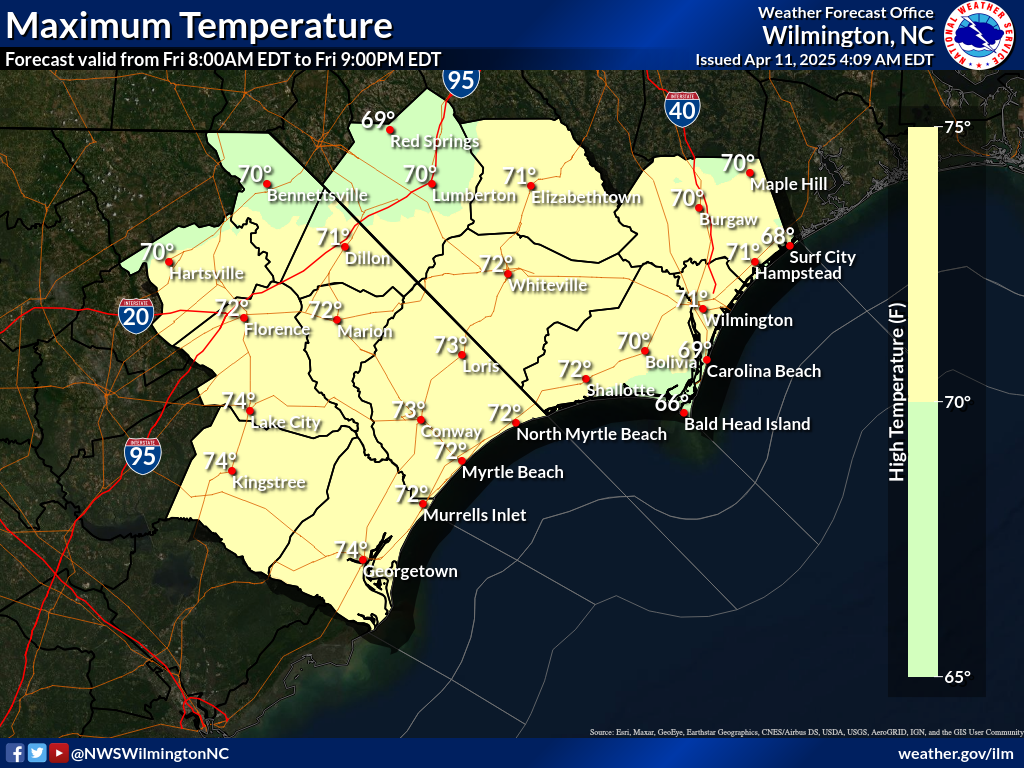
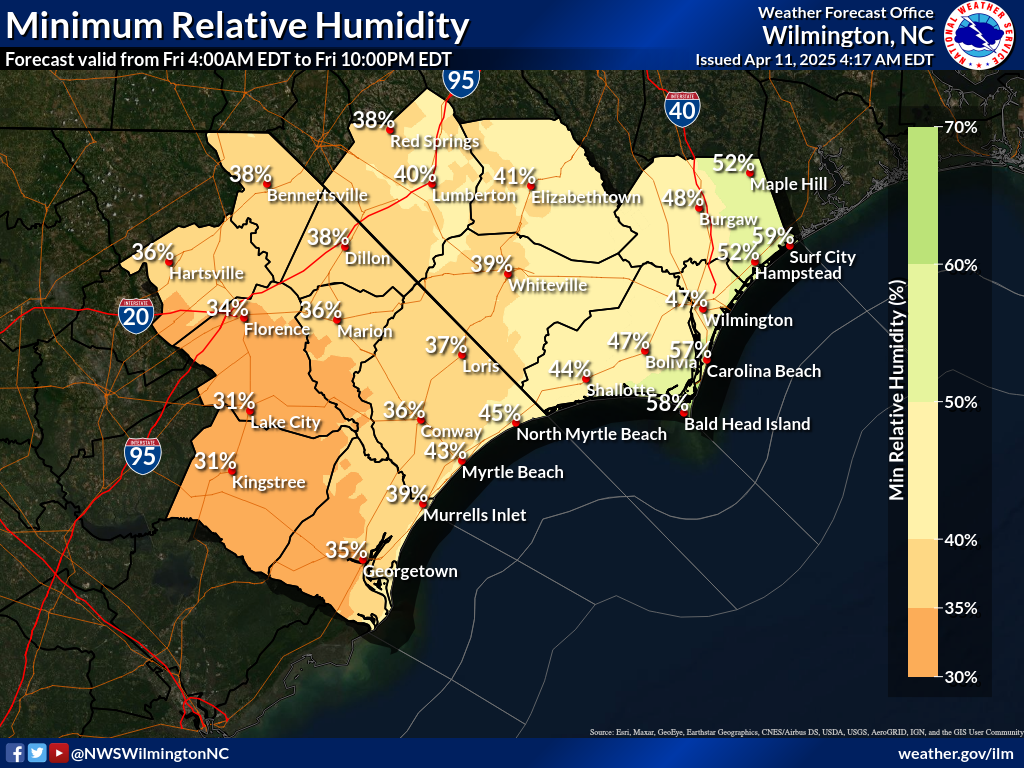
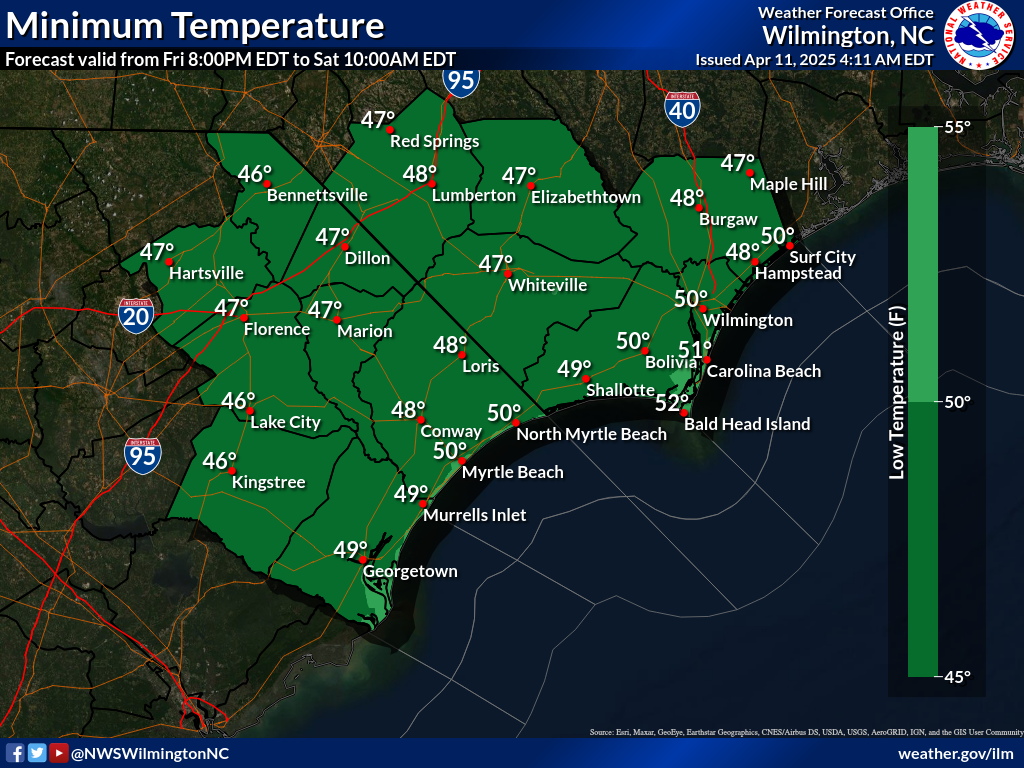
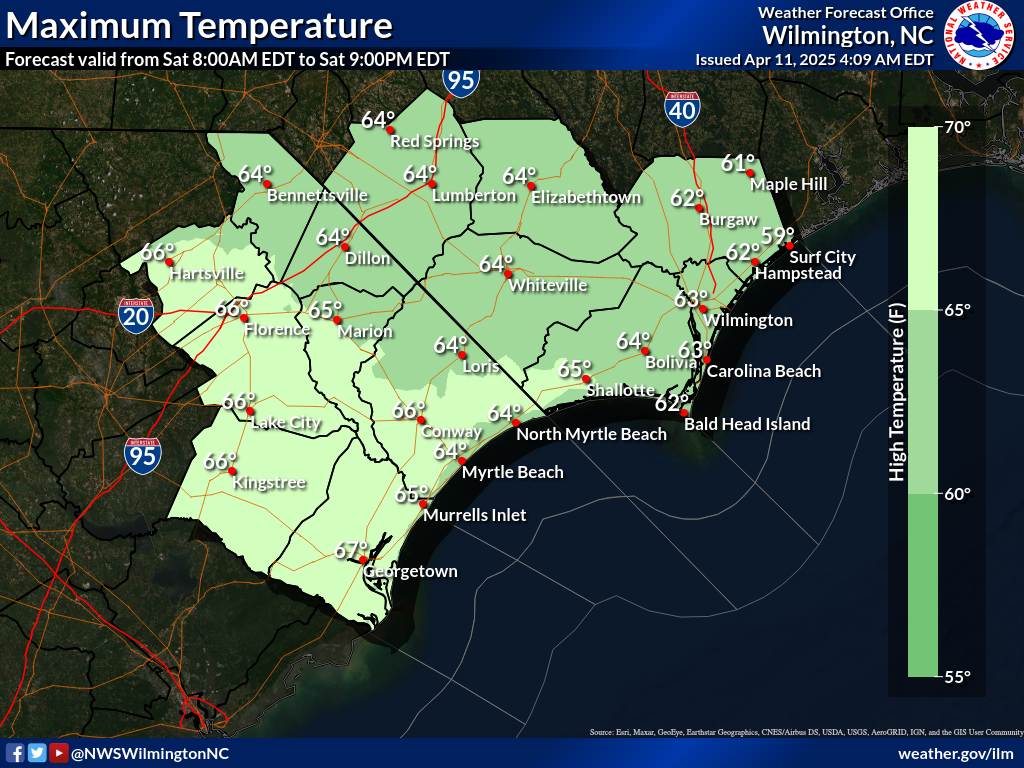
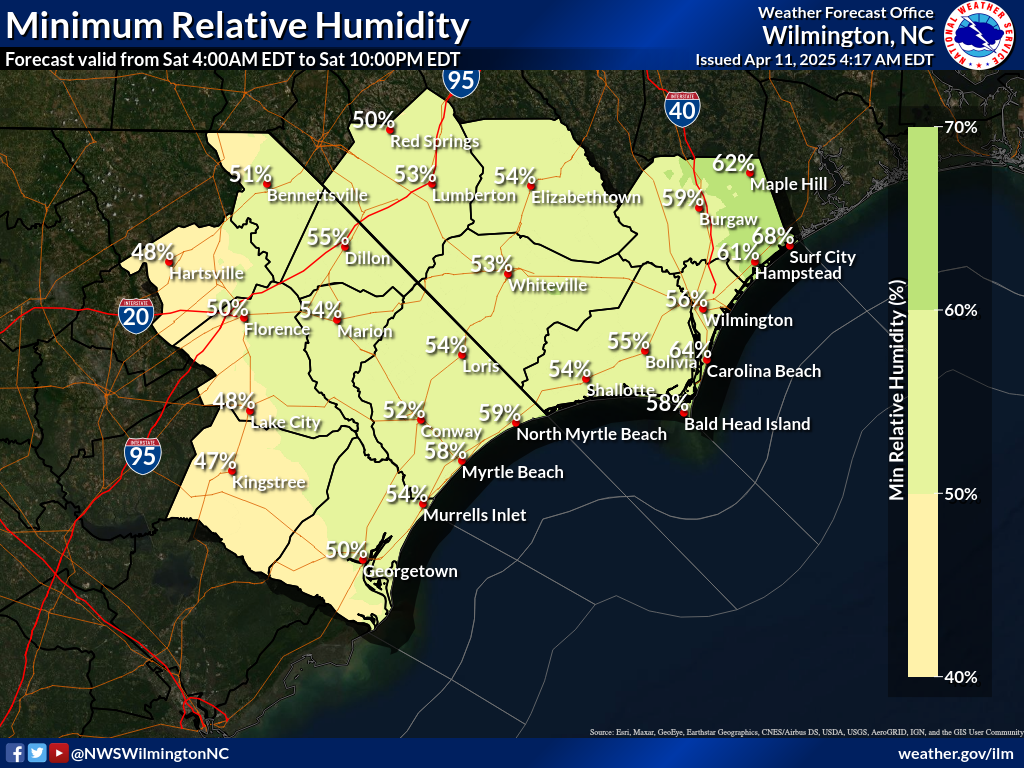
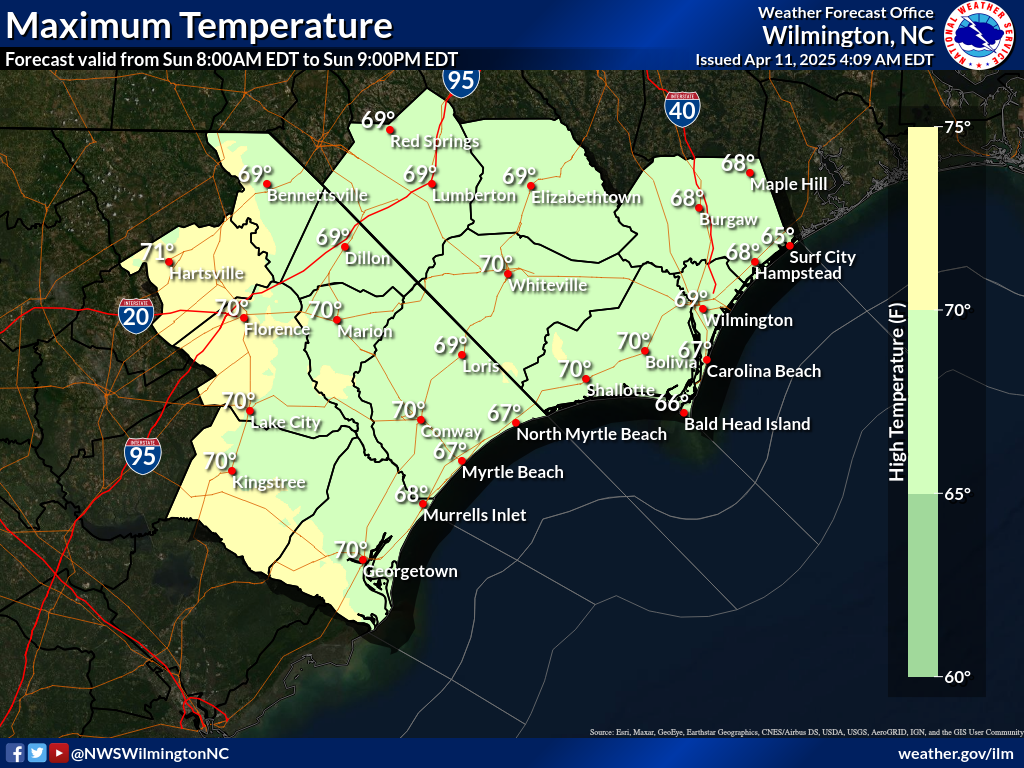
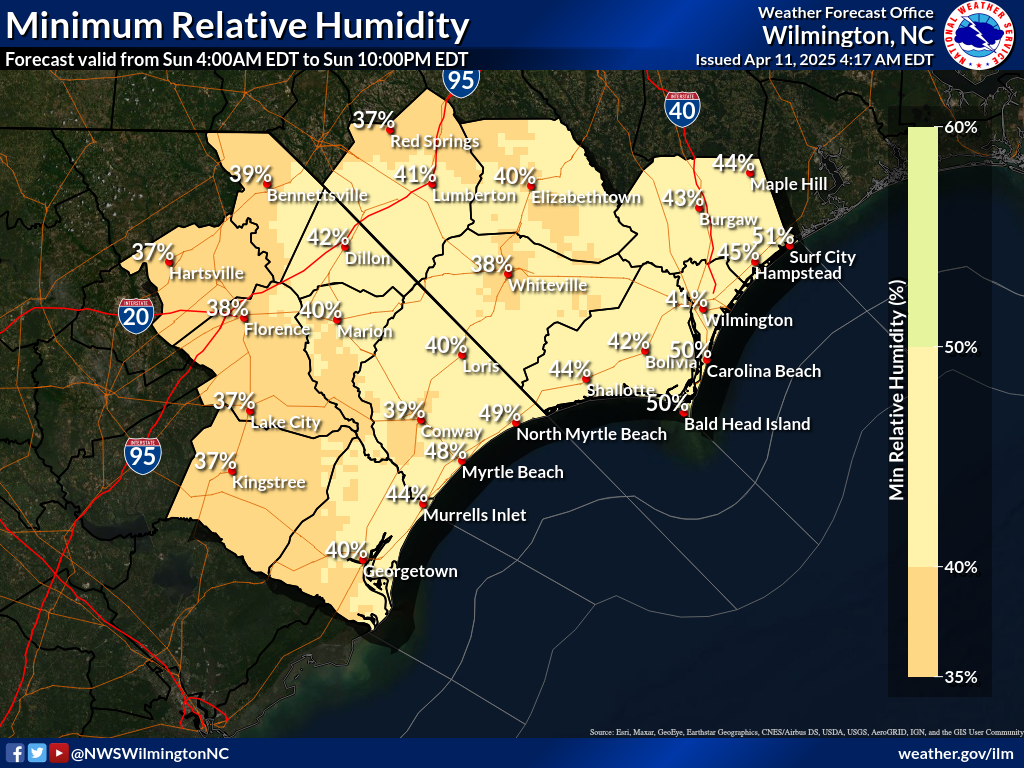
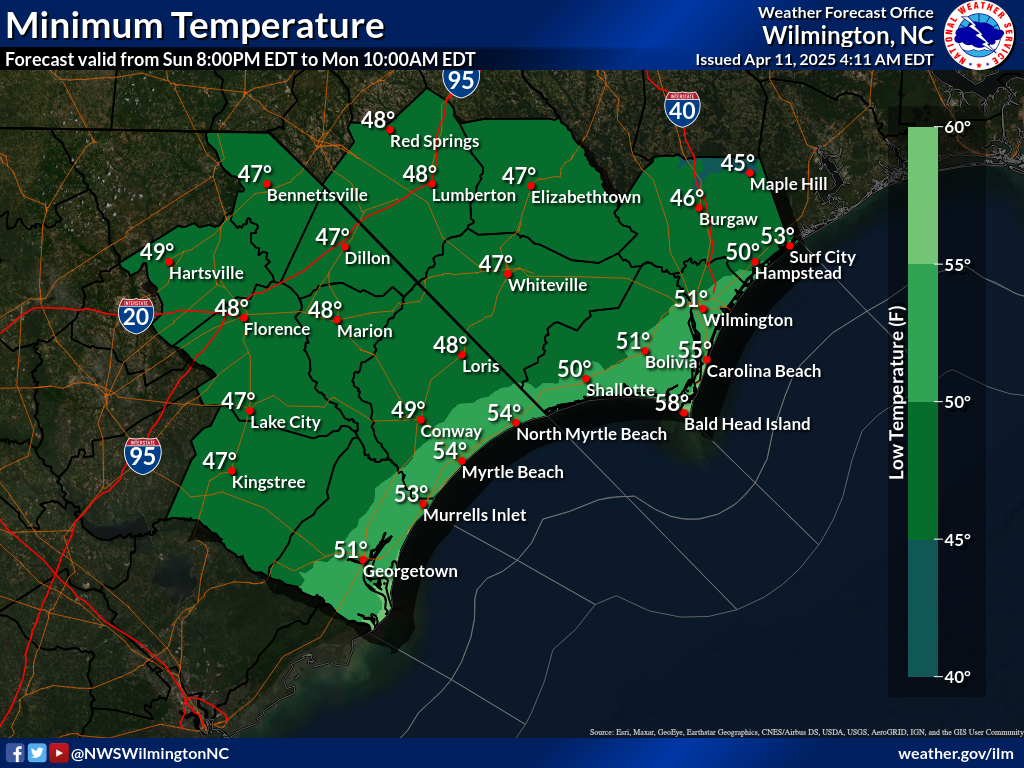
Day 1
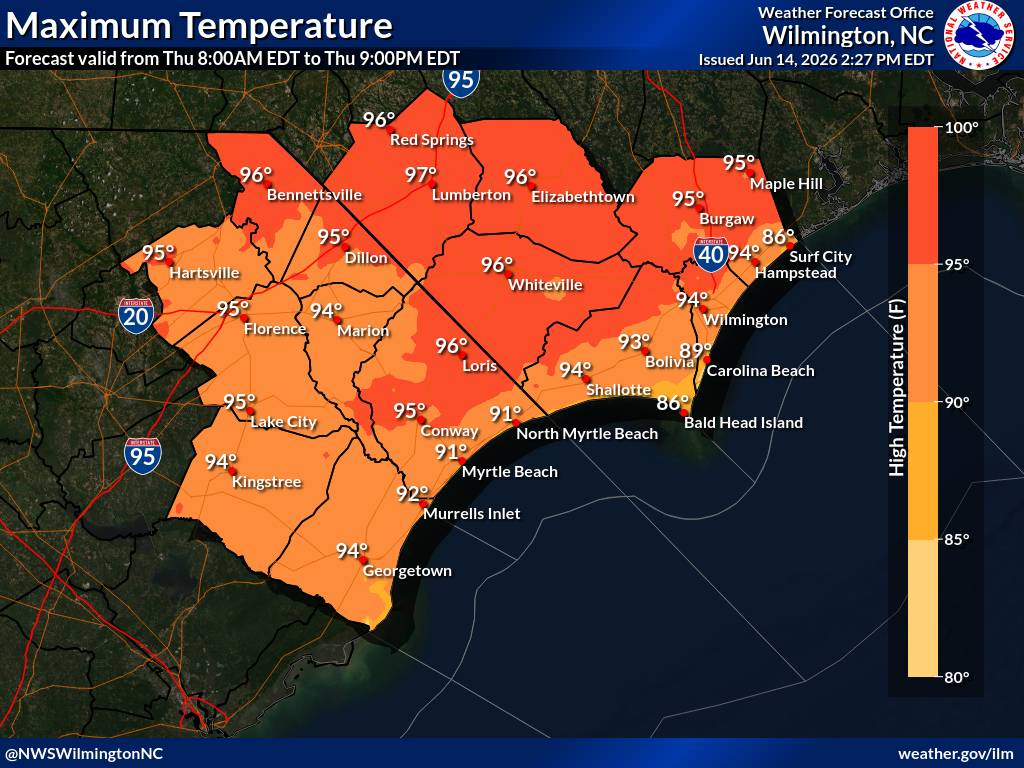
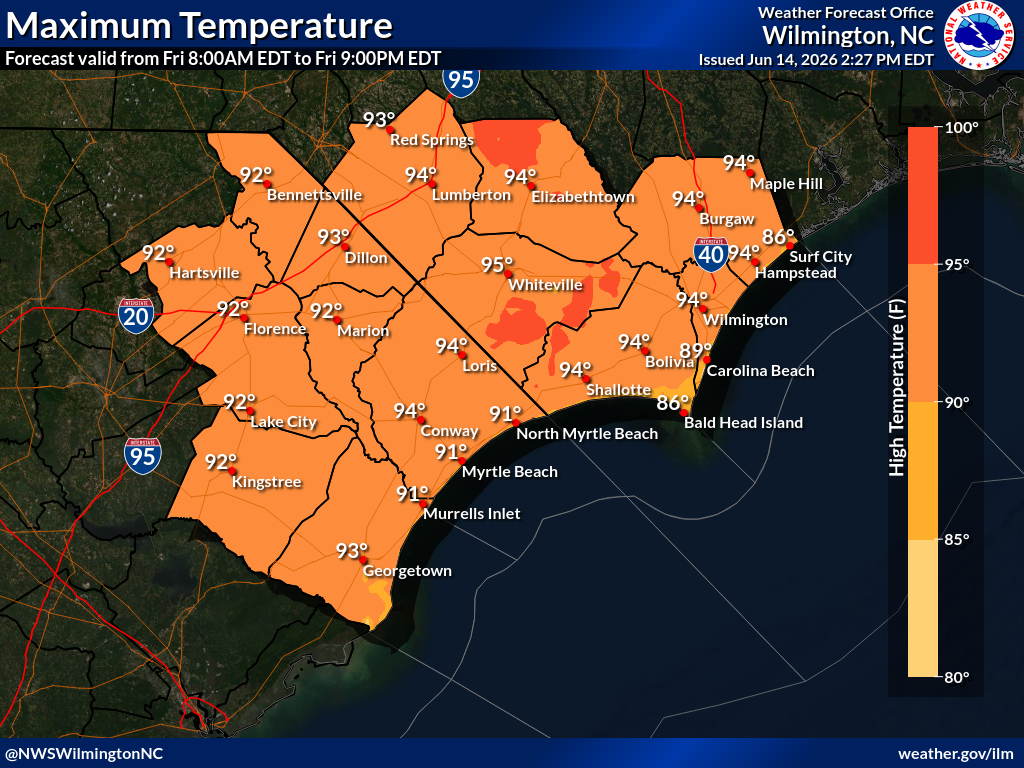
Max Temp
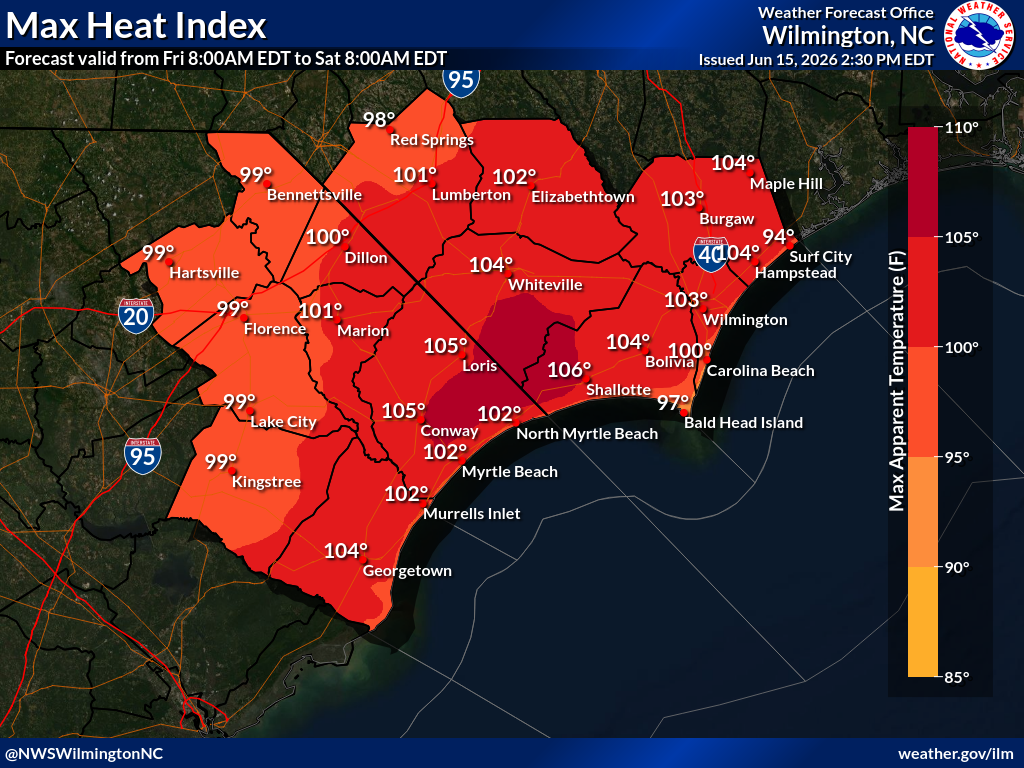
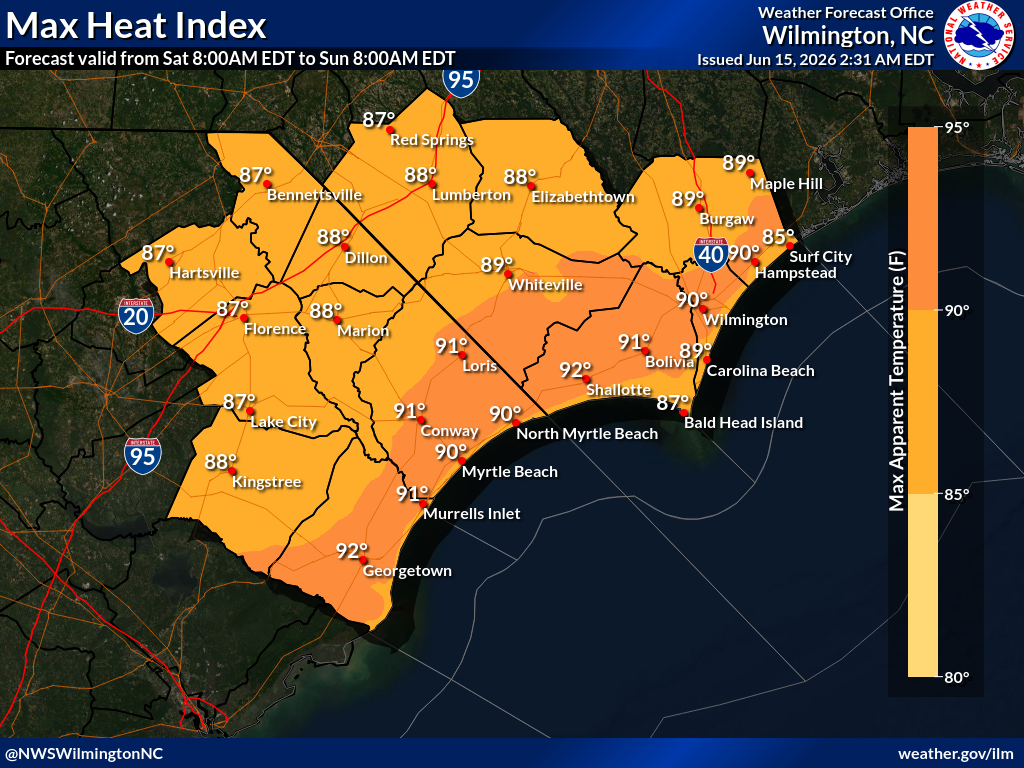
Max Heat Index
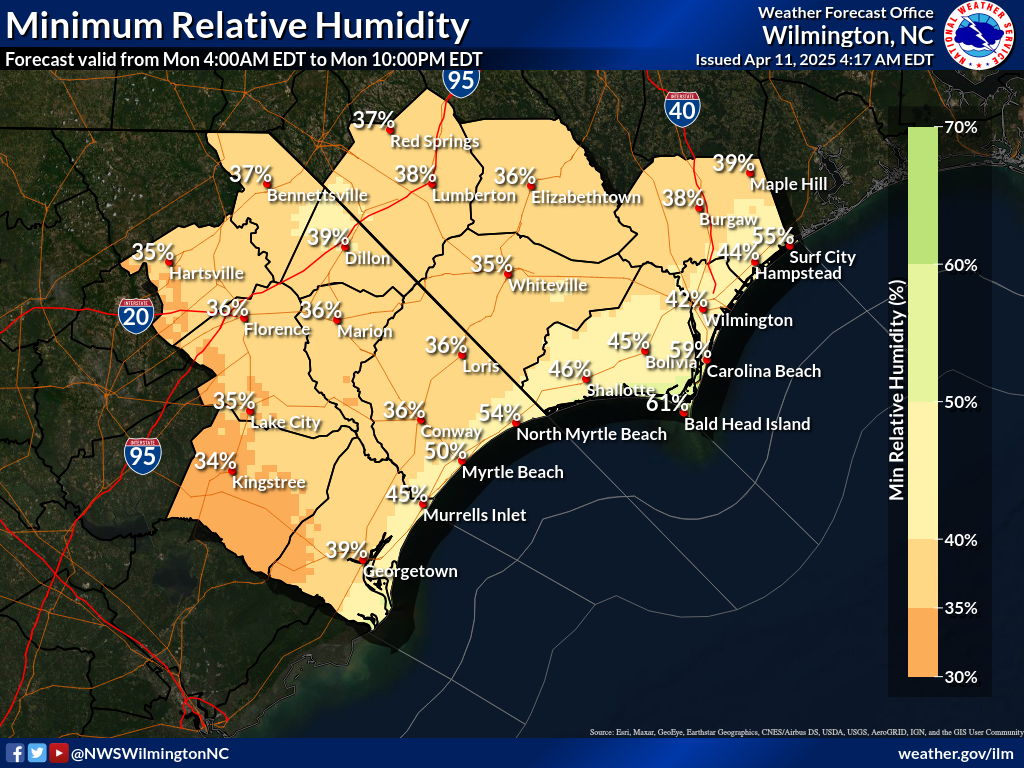
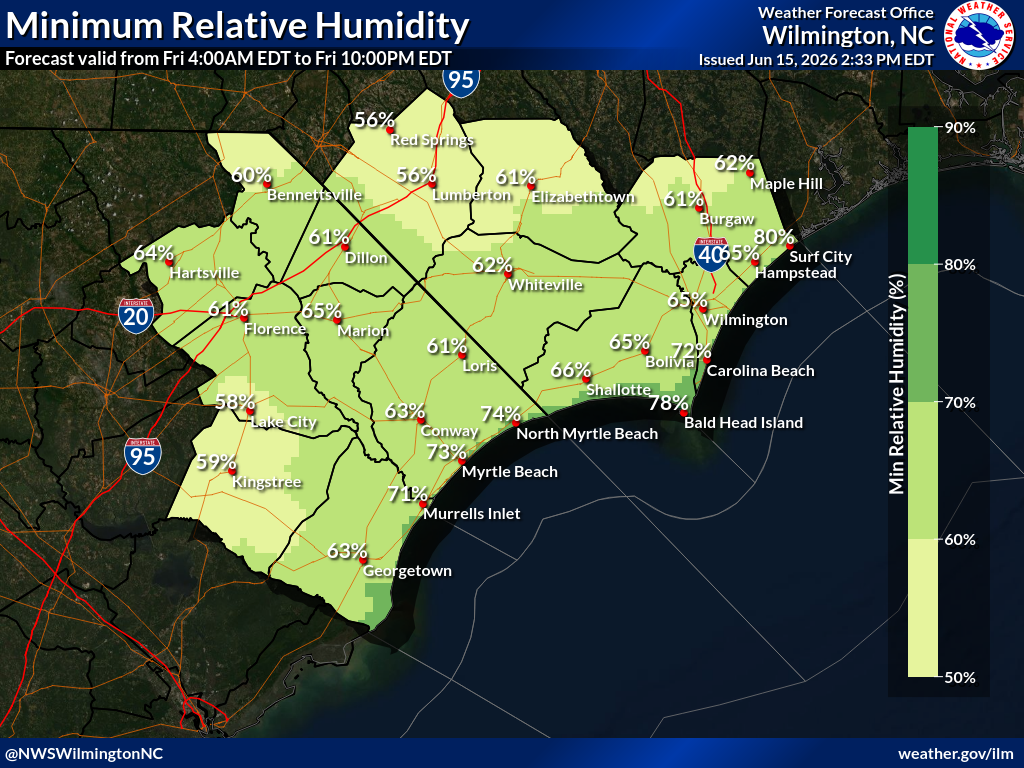
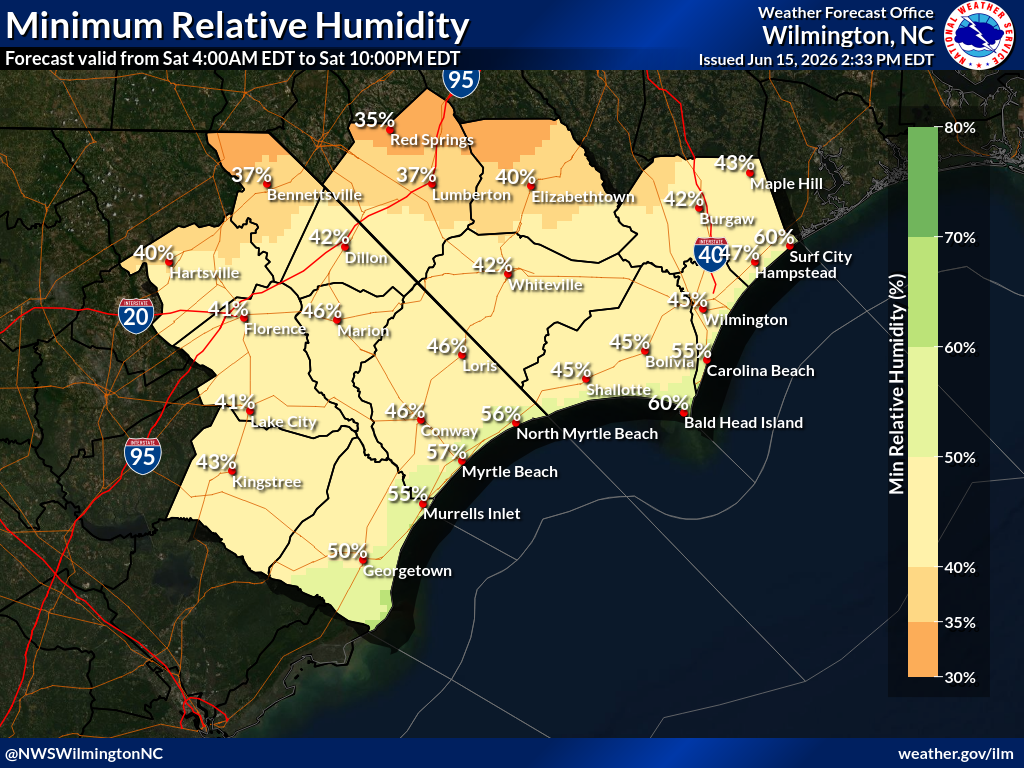
Min Rel Hum
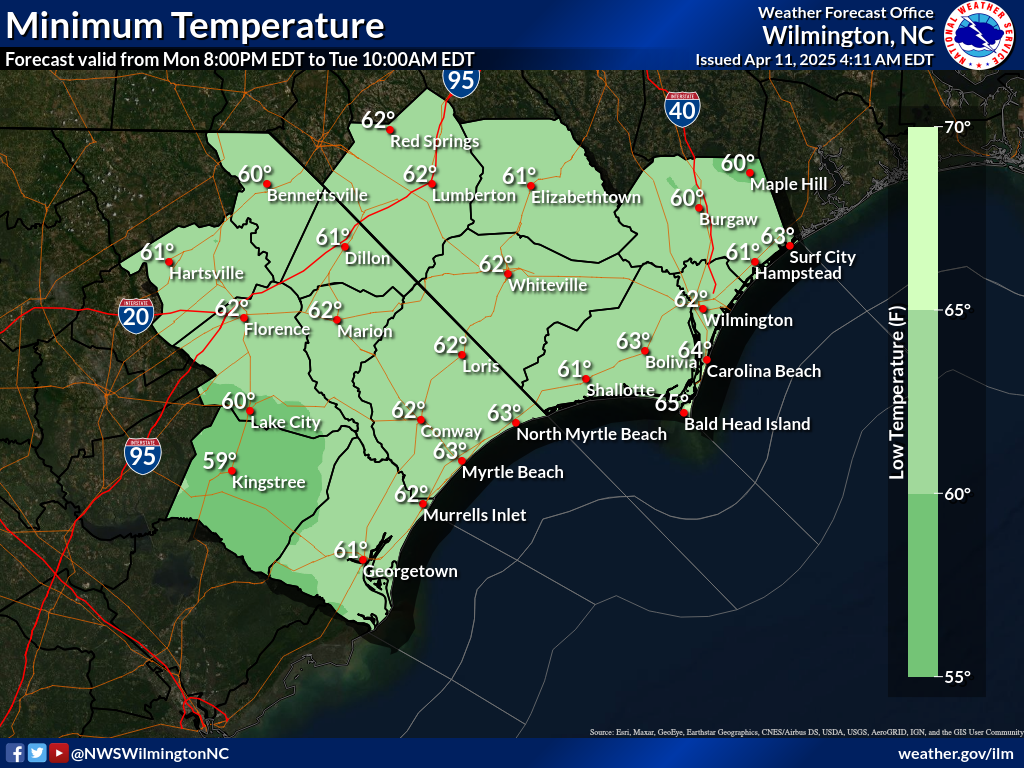
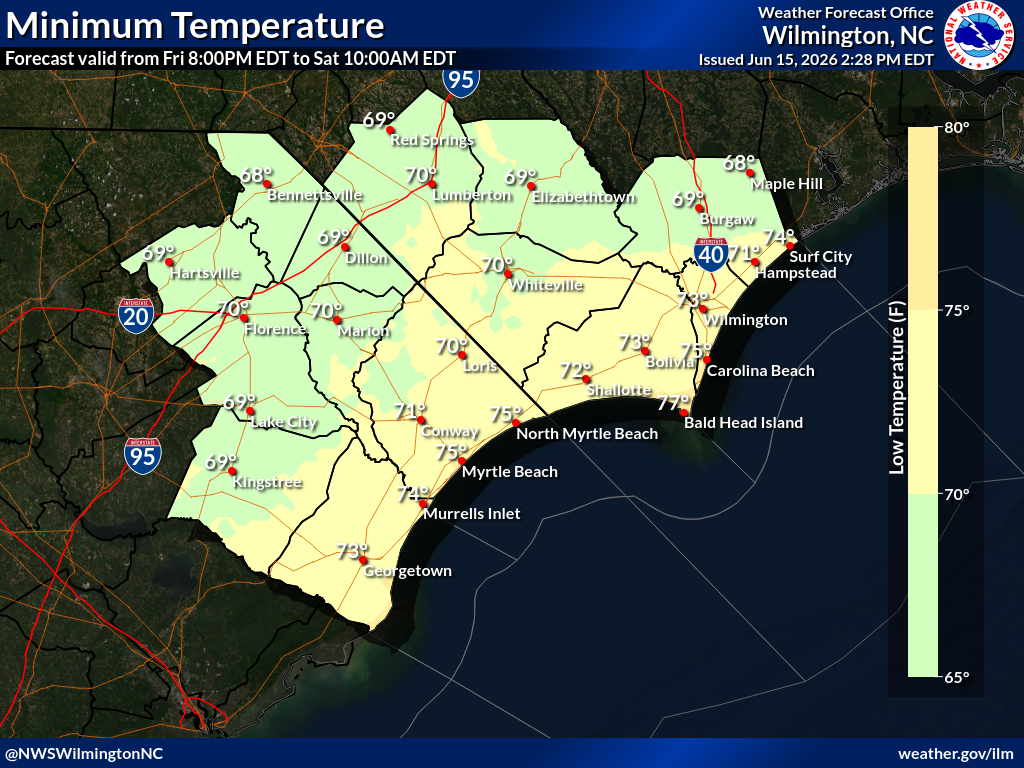
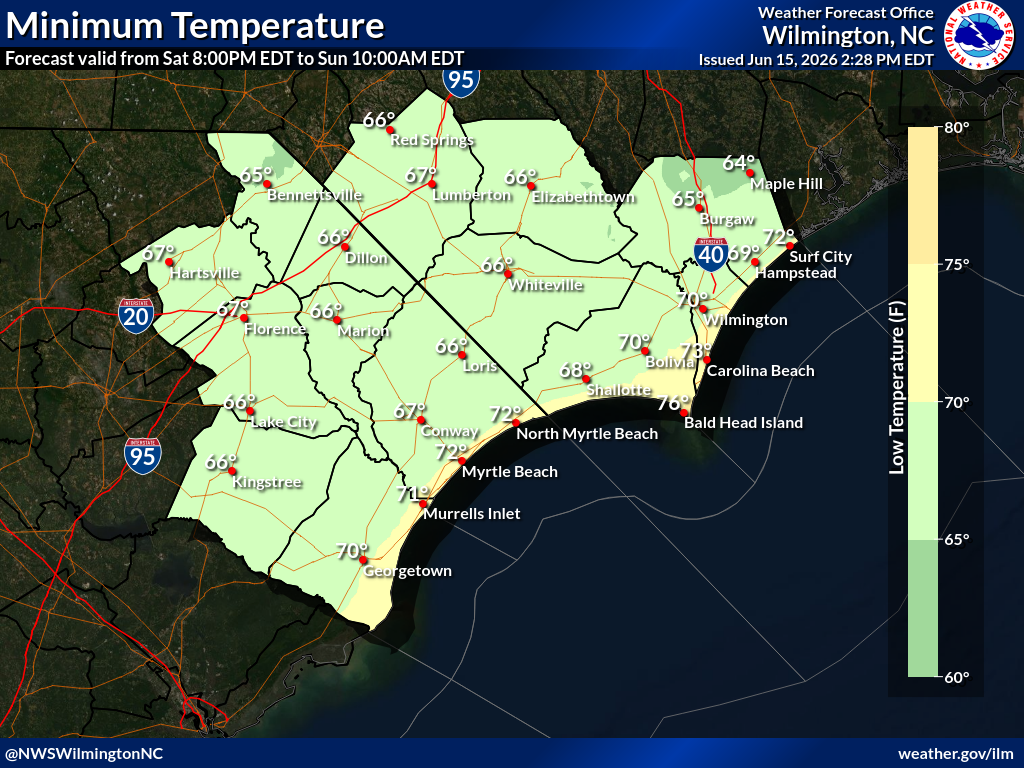
Min Temp
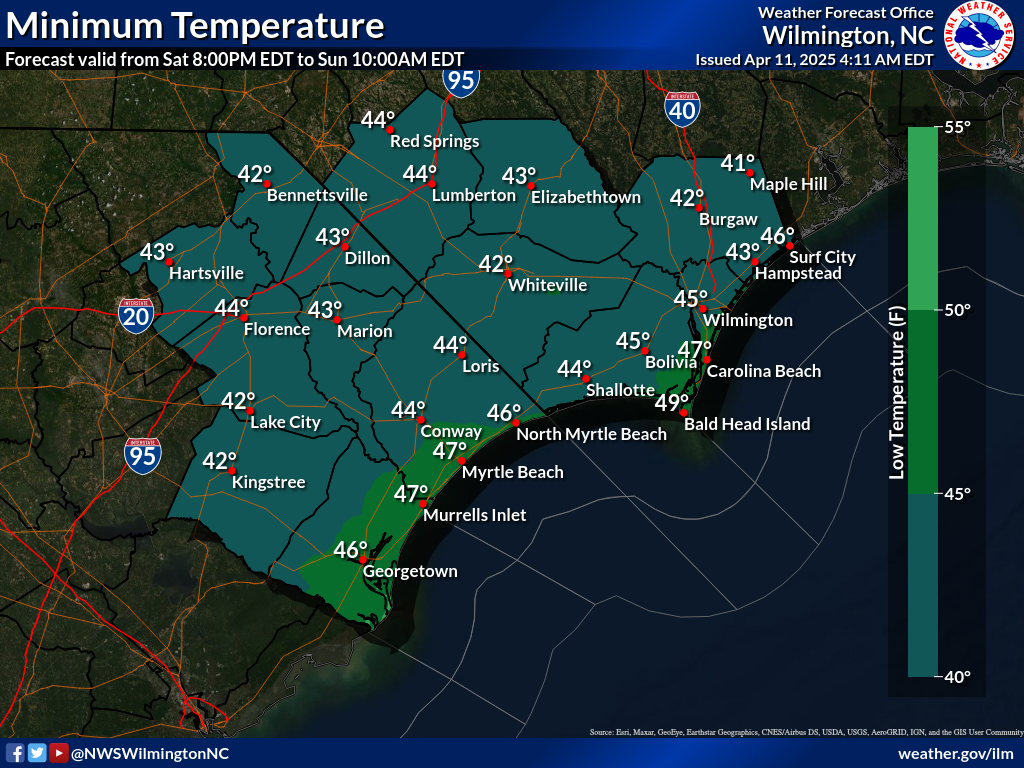
Day 2
Max Temp
Max Heat Index
Min Rel Hum
Min Temp

Day 3
Max Temp
Max Heat Index
Min Rel Hum
Min Temp

Day 4
Max Temp
Max Heat Index
Min Rel Hum
Min Temp

Day 5
Max Temp
Max Heat Index
Min Rel Hum
Min Temp
Day 6
Max Temp
Max Heat Index
Min Rel Hum
Min Temp
Day 7
Max Temp
Max Heat Index
Min Rel Hum
Min Temp


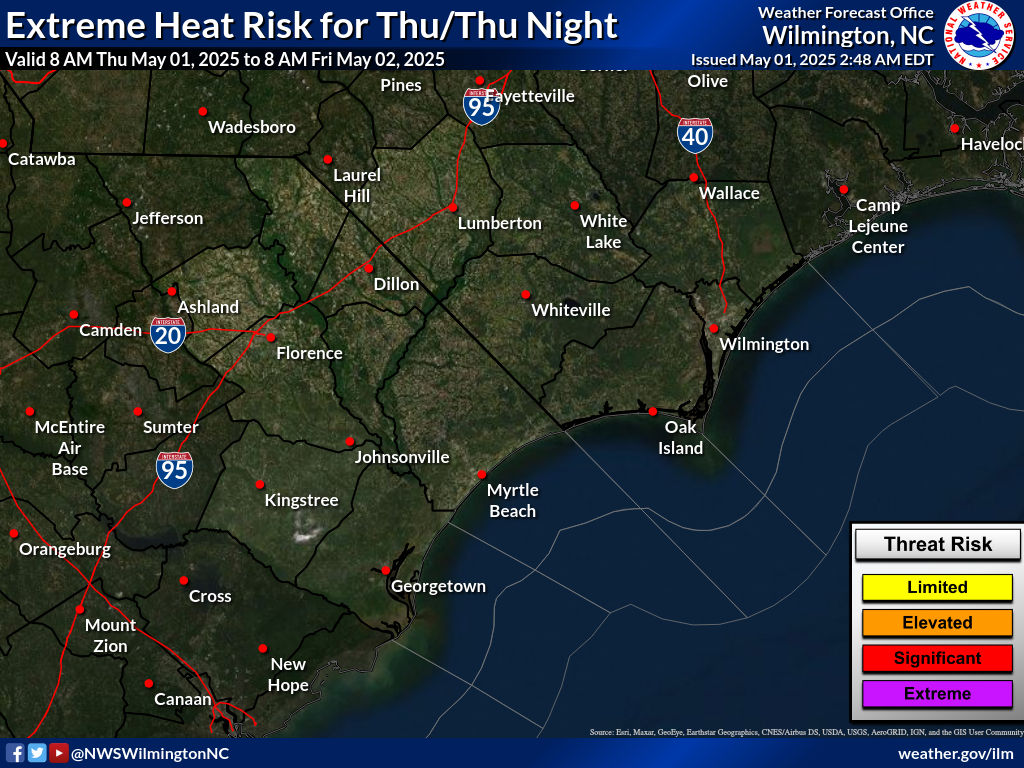
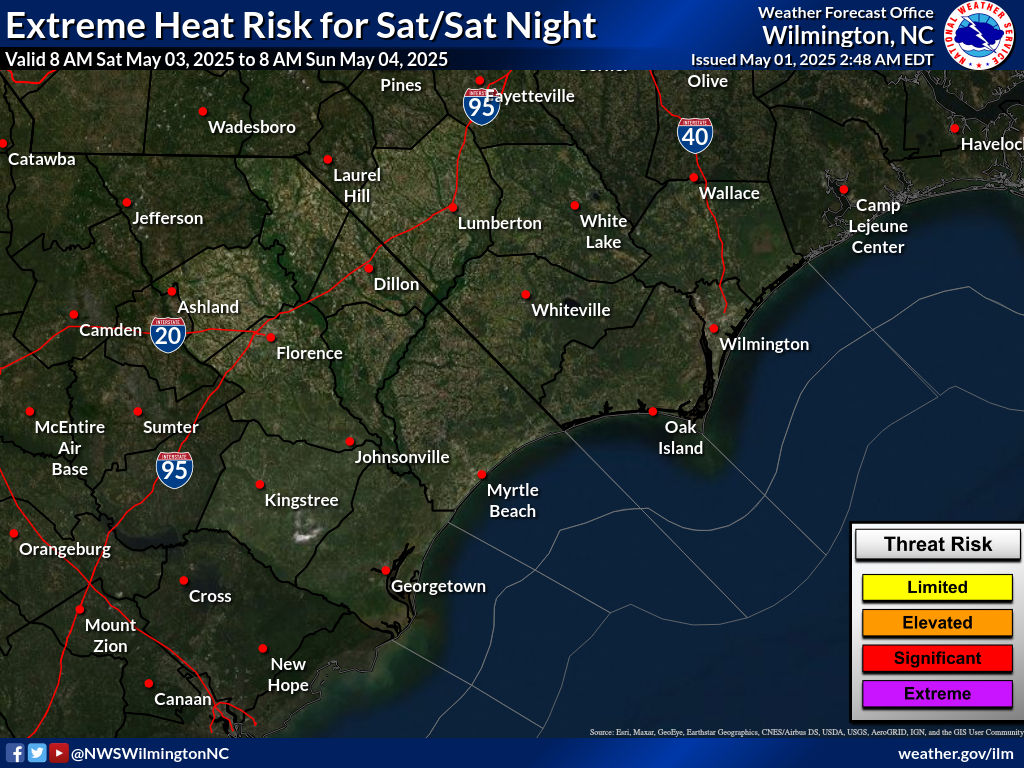
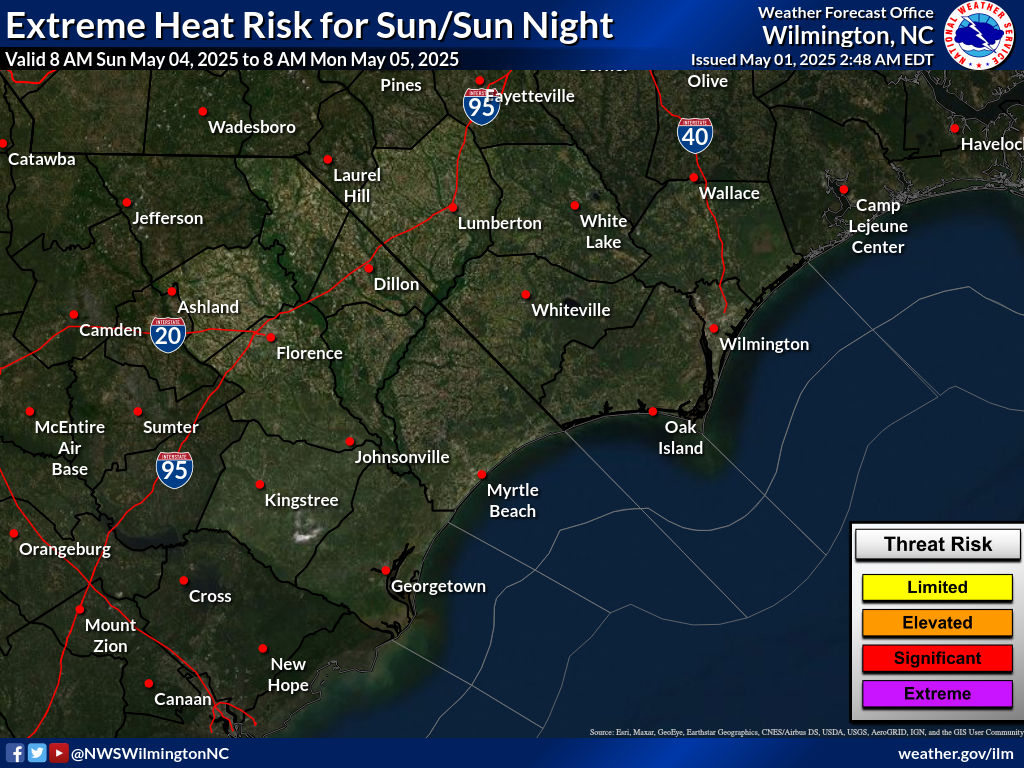
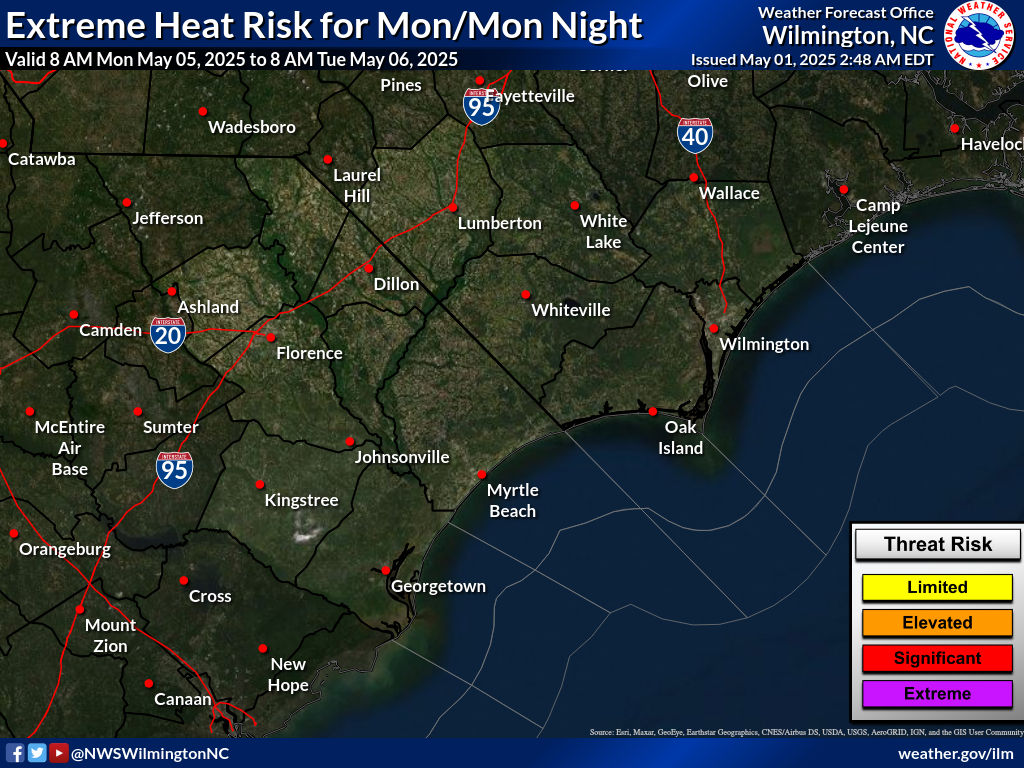
NOTE: The following Extreme Heat Risk maps are from the Graphical Hazardous Weather Outlook and are based solely on heat indices. They are only available April through September. Click on the images to enlarge them.
Day 1
Day 2
Day 3
Day 4


Day 5
Day 6
Day 7

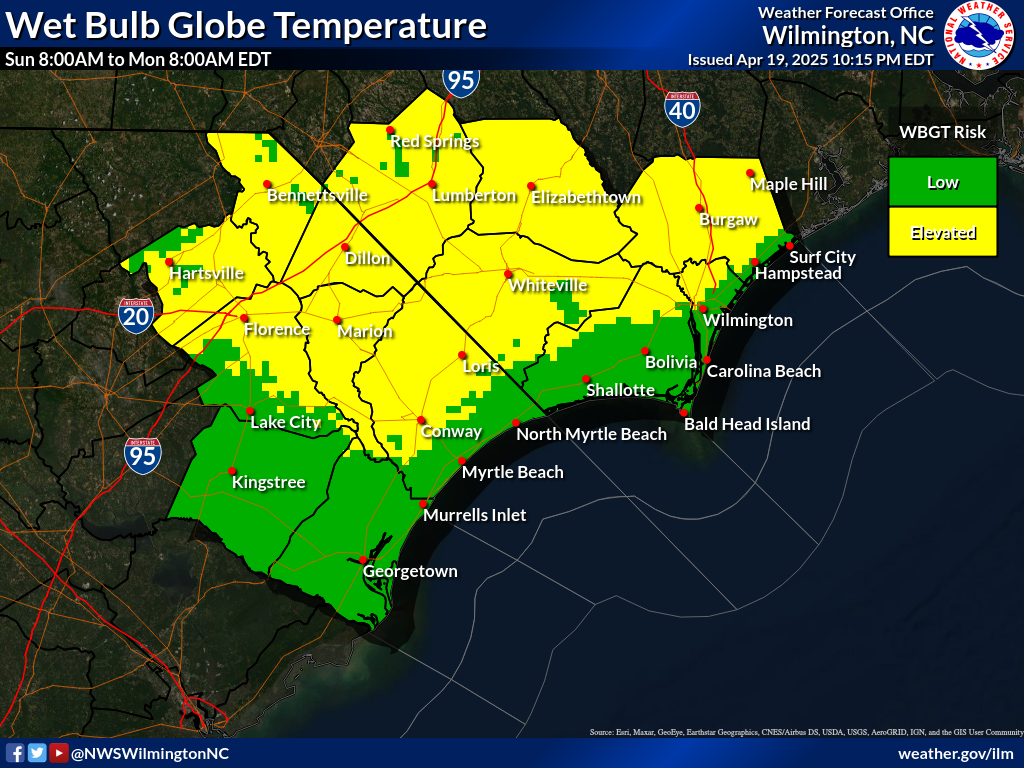
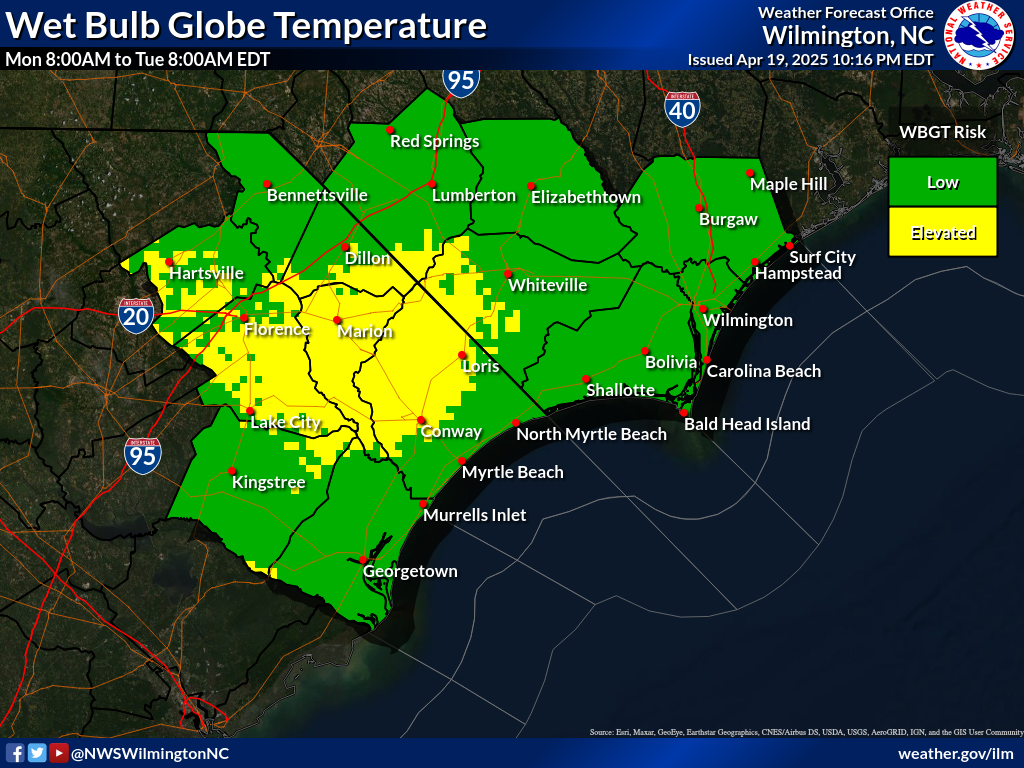
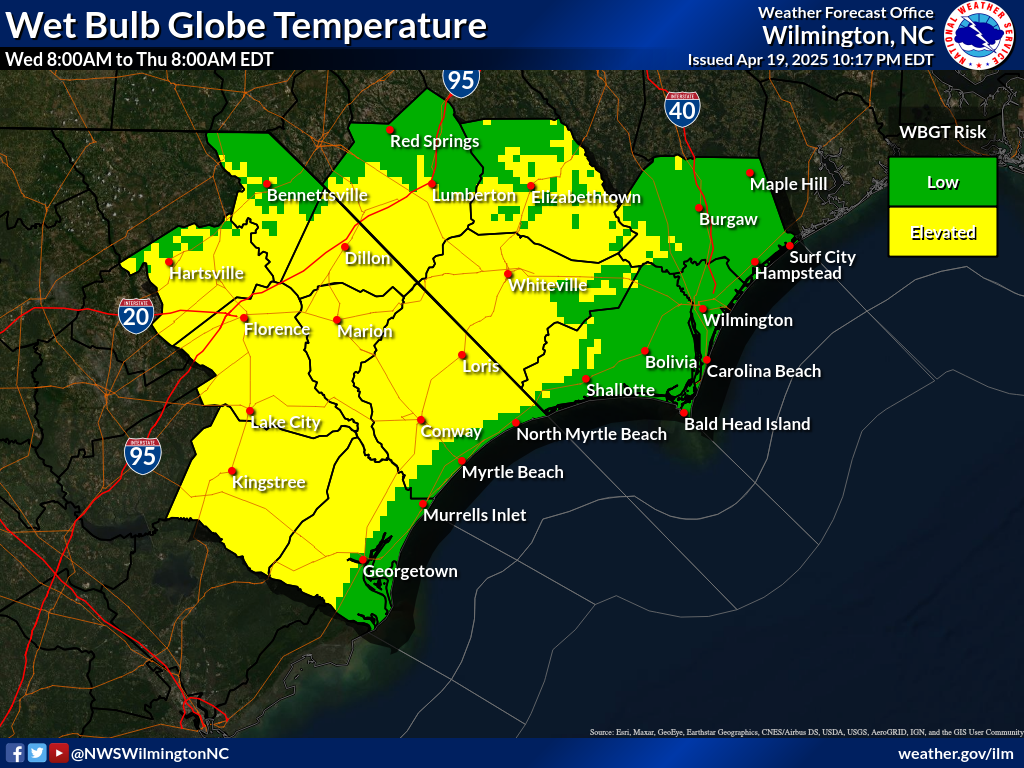
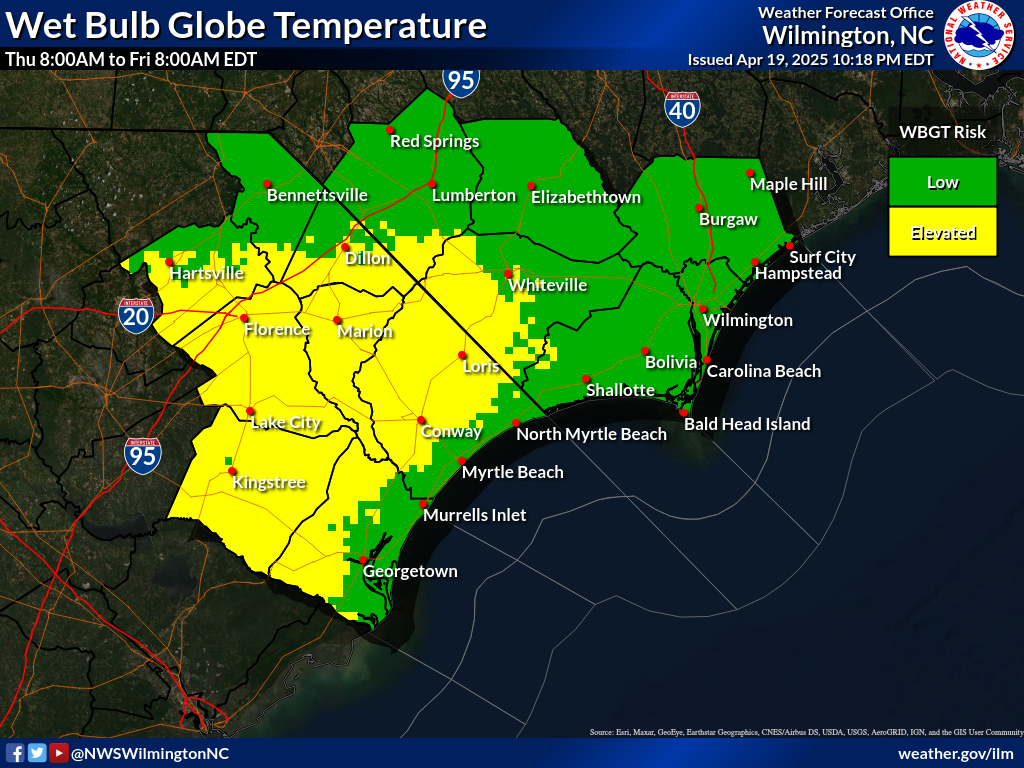
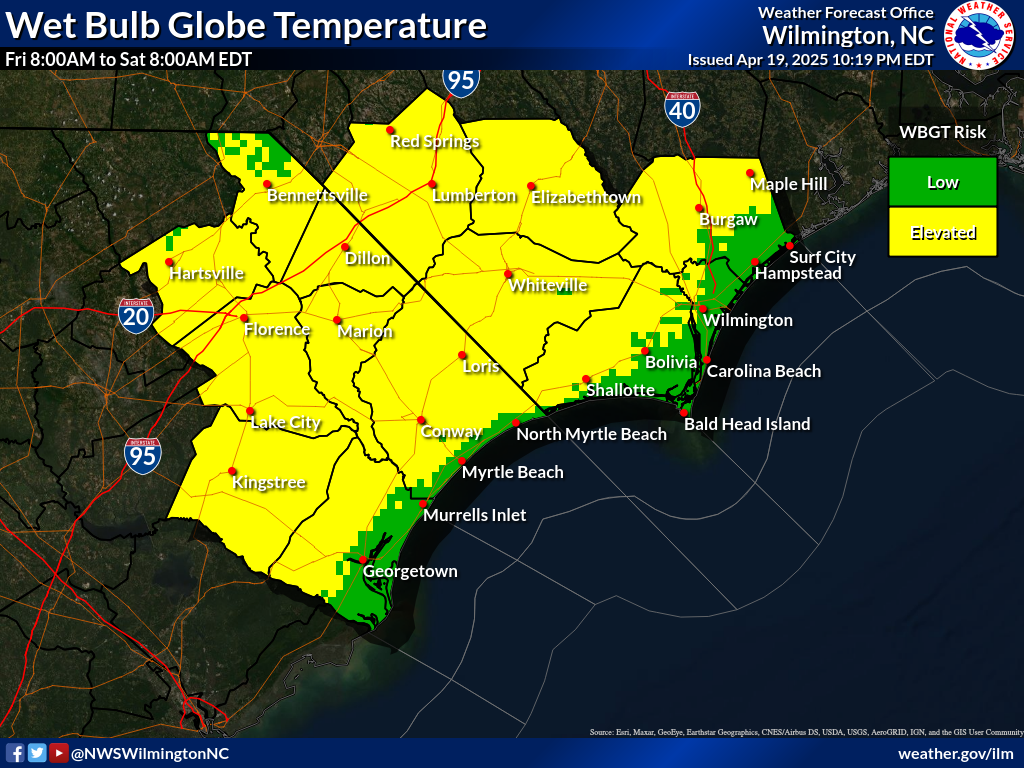
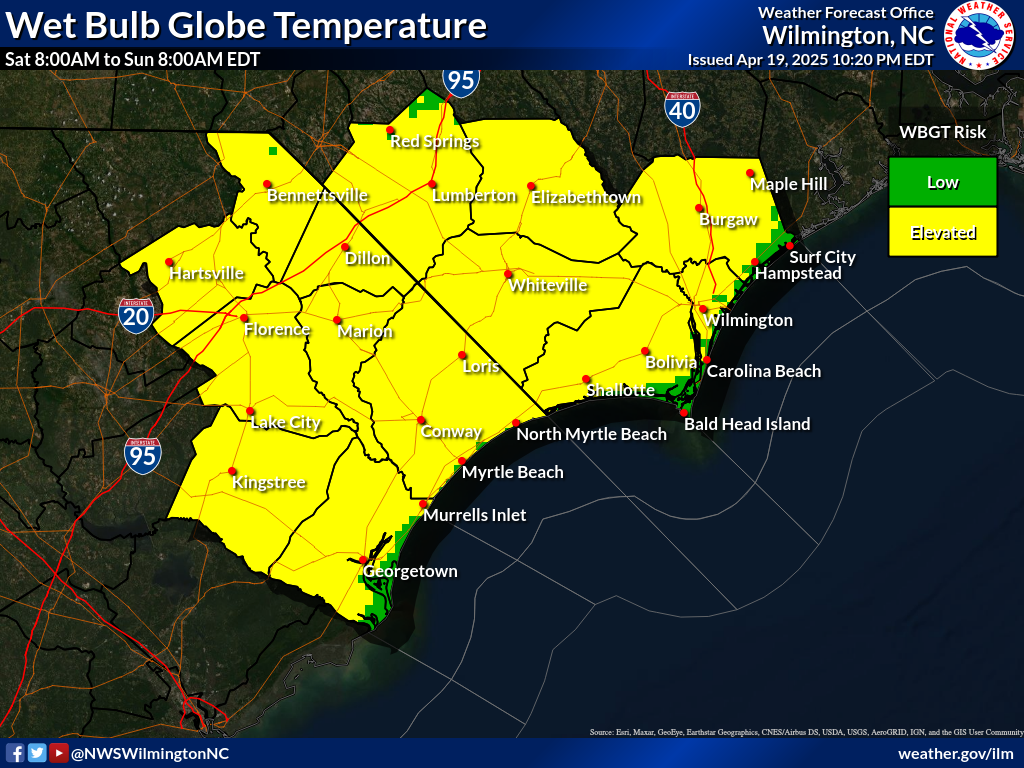
NOTE: The following maps represent the Wet Bulb Globe Temperature (WBGT) Risk. Click on the images to enlarge them.
Day 1
Day 2
Day 3
Day 4

Day 5
Day 6
Day 7
Heat Advisory
Extreme Heat Watch/Warning
Heat indices of 105-109 degrees for 2+ hours
Heat indices of 110+ degrees for 2+ hours


 Coastal Flood