|
|
For the third year in a row, La Niña is expected to be the dominant climate pattern affecting our upcoming winter season. During La Niña winters, the eastern portions of North and South Carolina tend to see less precipitation than normal. Temperatures also have a tendency to run above normal -- and with the addition of steadily warming temperatures due to ongoing climate change there's a good potential for above normal temperatures this winter.
 |
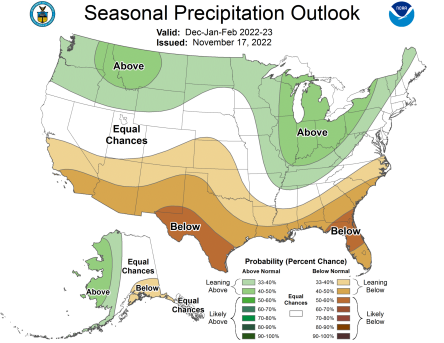 |
Outlook graphics from the NWS Climate Prediction Center
La Niña is one half of a naturally occurring cycle in tropical east Pacific water temperatures called ENSO -- the El Niño Southern Oscillation. ENSO brings weather and climate impacts across the world.
During La Niña, cool water in the tropical Pacific Ocean causes fewer thunderstorms to form there, leading to a weaker subtropical jet stream that brings less moisture and less rainfall across the southern United States during the winter. The position of the polar jet stream also lifts farther north during La Niña. This tends to focus storminess across the Ohio Valley and Great Lakes, leaving the Carolinas mainly clear and dry with warmer than normal temperatures.
The other half of the ENSO cycle, El Niño, is often associated with cool, wet winter conditions across the southern United States. The last time El Niño occurred was during the winter of 2018-2019.
>
Learn more about ENSO, El Niño, and La Niña...
This winter will be only the third time since records began in 1950 that La Niña has occurred in three consecutive winters. This last occurred during the 1998-99 through the 2000-01 winter seasons. The bulk of dynamical computer models and statistical climate models show La Niña should weaken over the next few months and likely will end during the spring of 2023.
To get an idea how conditions this winter may unfold, we'll look at the most recent five winter seasons when similar La Niñas (ONI between -0.5 and -1.0) were present and use them as a guide: 2008-2009, 2011-2012, 2017-2018, 2020-2021, and 2021-2022.
Precipitation
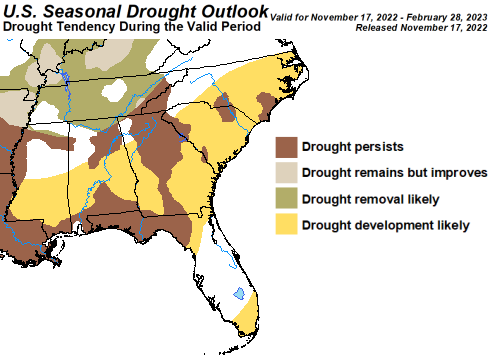
With the exception of widespread rain that fell during Hurricane Ian at the end of September, this fall has been very dry across the eastern Carolinas. Rainfall totals since September 1 have been 6 inches below normal in Myrtle Beach and almost 10 inches below normal in Wilmington. Moderate drought has officially been declared across portions of the Cape Fear and Pee Dee regions, and drought will likely expand during the months ahead.
|
The CPC Seasonal Drought Outlook shows drought is expected to expand across the Carolinas this winter |
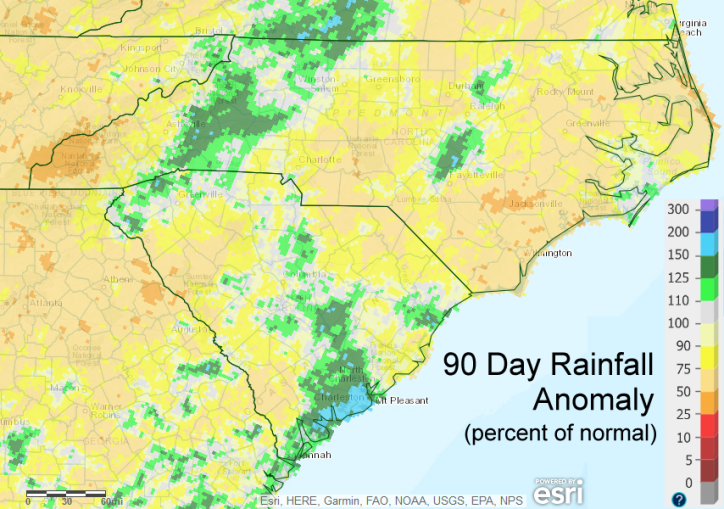
Radar-estimated precipitation anomalies from August 22 through November 22, 2022. Portions of southeastern North Carolina have received less than 50 percent of normal rainfall |
Observed rainfall totals were below normal in four of the previous five winters when La Niña was similar in strength to this winter's La Niña. This makes it likely we'll see below normal rainfall again this winter. The winters of 2008-2009 and 2011-2012 were exceptionally dry with seasonal precipitation totals 3 to 6 inches shy of normal values.
The one exception to these dry La Niña winters occurred in 2020-2021 when above normal rainfall totals were recorded, particularly across interior portions of North and South Carolina. Despite Pacific Ocean temperatures showing a La Niña pattern, the atmosphere behaved differently, making the winter of 2020-2021 an oddball for sure. More discussion on that unique winter is available here: https://www.climate.gov/news-features/blogs/enso/did-northern-hemisphere-get-memo-years-la-ni%C3%B1a
| Wilmington | Florence | N. Myrtle Beach | Lumberton | |
| NORMAL WINTER PRECIPITATION TOTALS | 10.97" | 9.55" | 9.29" | 8.63" |
| Winter 2008-2009 observed (and anomaly) | 6.64" (-4.33") | 4.82" (-4.73") | 6.31" (-2.98") | 3.22' (-5.41") |
| Winter 2011-2012 observed (and anomaly) | 4.52" (-6.45") | 5.39" (-4.16") | 3.71" (-5.58") | 5.59" (-3.04") |
| Winter 2017-2018 observed (and anomaly) | 12.51" (+1.54") | 7.70" (-1.85") | 9.14" (-0.15") | 7.09" (-1.54") |
| Winter 2020-2021 observed (and anomaly) | 13.49" (+2.52") | 15.33" (+5.78") | 14.36" (+5.07") | 16.61" (+7.98") |
| Winter 2021-2022 observed (and anomaly) | 8.04" (-2.93") | 8.11" (-1.44") | 8.16" (-1.13") | 7.67" (-0.96") |
| COMPOSITE OF THESE FIVE WINTERS | 9.00" (-1.93") | 8.30" (-1.28") | 8.30" (-0.95") | 8.00" (-0.59") |
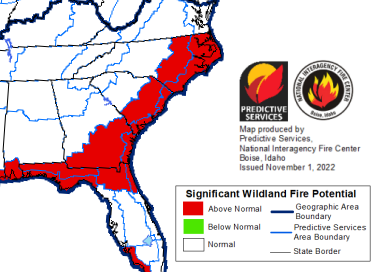 |
In addition to a growing potential for drought this winter, consistently dry weather could create a heightened risk for wildfires toward the end of winter and into spring of 2023. Meteorologists with the National Interagency Coordination Center have highlighted the eastern Carolinas in their February 2023 Wildland Fire Potential Outlook.
Expected warm and dry conditions this winter plus the chance for an earlier than normal spring leaf-out should increase fire potential.
The South Carolina Forestry Commission states that "late winter and early spring" is the busiest time of year for wildfires across the state.
Temperatures
La Niña tends to bring above normal winter temperatures across the eastern Carolinas. This is at least partially due to the larger number of dry, sunny days that occur as the jet stream and main storm track remain to our north. Over the past five years when La Niñas similar in strength to this winter's event have occurred, local winter temperatures have averaged around 1° F above normal. Two of these years saw considerably warmer temperatures including last winter (2021-2022) when temperatures averaged 3° F above normal.
| Wilmington | Florence | N. Myrtle Beach | Lumberton | |
| NORMAL WINTER AVERAGE TEMPERATURE | 48.6° | 48.4° | 48.2° | 46.8° |
| Winter 2008-2009 observed (and anomaly) | 48.3° (-0.3°) | 47.8° (-0.6°) | 48.9° (+0.7°) | 46.8° (+0.0°) |
| Winter 2011-2012 observed (and anomaly) | 51.2° (+2.6°) | 50.8° (+2.4°) | 51.2 (+3.0°) | 49.3° (+2.5°) |
| Winter 2017-2018 observed (and anomaly) | 48.9° (+0.3°) | 48.8° (+0.4°) | 49.2° (+1.0°) | 47.1° (+0.3) |
| Winter 2020-2021 observed (and anomaly) | 48.3° (-0.3°) | 46.9° (-1.5°) | 47.8° (-0.4°) | 46.2° (-0.6°) |
| Winter 2021-2022 observed (and anomaly) | 51.9° (+3.3°) | 51.0° (+2.6°) | 50.4° (+2.2°) | 49.6° (+2.8°) |
| COMPOSITE OF THESE FIVE WINTERS | 49.7° (+1.1°) | 49.1° (+0.7°) | 49.5° (+1.3°) | 47.8° (+1.0°) |
We've had some cool weather during the middle of November, including the first freeze of the season across many coastal locations. While temperatures for the upcoming winter are expected to run above normal, this doesn't address day-to-day fluctuations in temperature, or what the coldest single temperature reached during the winter will be. La Niña winters can feature widely varying temperatures throughout the season. One of the most significant arctic outbreaks of the past 100 years occurred during the 1984-1985 La Niña winter. This January 1985 arctic outbreak produced the all-time record low temperatures for many cities across North and South Carolina -- including zero degrees in Florence, SC.
It's also worth noting that despite that period of extreme cold, the winter of 1984-1985 was otherwise mild with above average temperatures recorded along the coast.
The past five years with similar La Niñas to what we're expecting this winter showed no clear trend in coldest winter temperature.
| Wilmington | Florence | N. Myrtle Beach | Lumberton | |
| NORMAL WINTER COLDEST TEMPERATURE | 18° | 16° | 19° | 16° |
| Winter 2008-2009 observed (and anomaly) | 15° (-3°) | 14° (-2°) | 17° (-2°) | 13° (-3°) |
| Winter 2011-2012 observed (and anomaly) | 20° (+2°) | 16° (+0°) | 20° (+1°) | 20° (+4°) |
| Winter 2017-2018 observed (and anomaly) | 11° (-7°) | 8° (-8°) | 16° (-3°) | 6° (-10°) |
| Winter 2020-2021 observed (and anomaly) | 25° (+7°) | 22° (+6°) | 24° (+5°) | 23° (+7°) |
| Winter 2021-2022 observed (and anomaly) | 19° (+1°) | 18° (+2°) | 19° (+0°) | 15° (-1°) |
| COMPOSITE OF THESE FIVE WINTERS | 18.0° (+0.0°) | 15.6° (-0.4°) | 19.2° (+0.2°) | 15.4° (-0.6°) |
If temperatures do run above normal as is expected this winter, energy consumption for heating will likely be less than normal. Heating degree days (HDD) are a statistical measure of how far below 65 degrees each day's average temperature is. By summing up heating degree days over a season, it's possible to predict energy usage as a function of seasonal temperature. For the eastern Carolinas, each one degree increase in winter average temperature equates to approximately six percent less energy needed to maintain a home at a comfortable temperature.
| Observed Winter Average Temperature Anomaly | +1° | +2° | +3° | +4° | +5° |
| Heating Energy Savings relative to a Normal Winter | 6% | 12% | 18% | 24% | 30% |
This season's heating degree day total and departure from normal can be found in our daily climate reports.
Snowfall
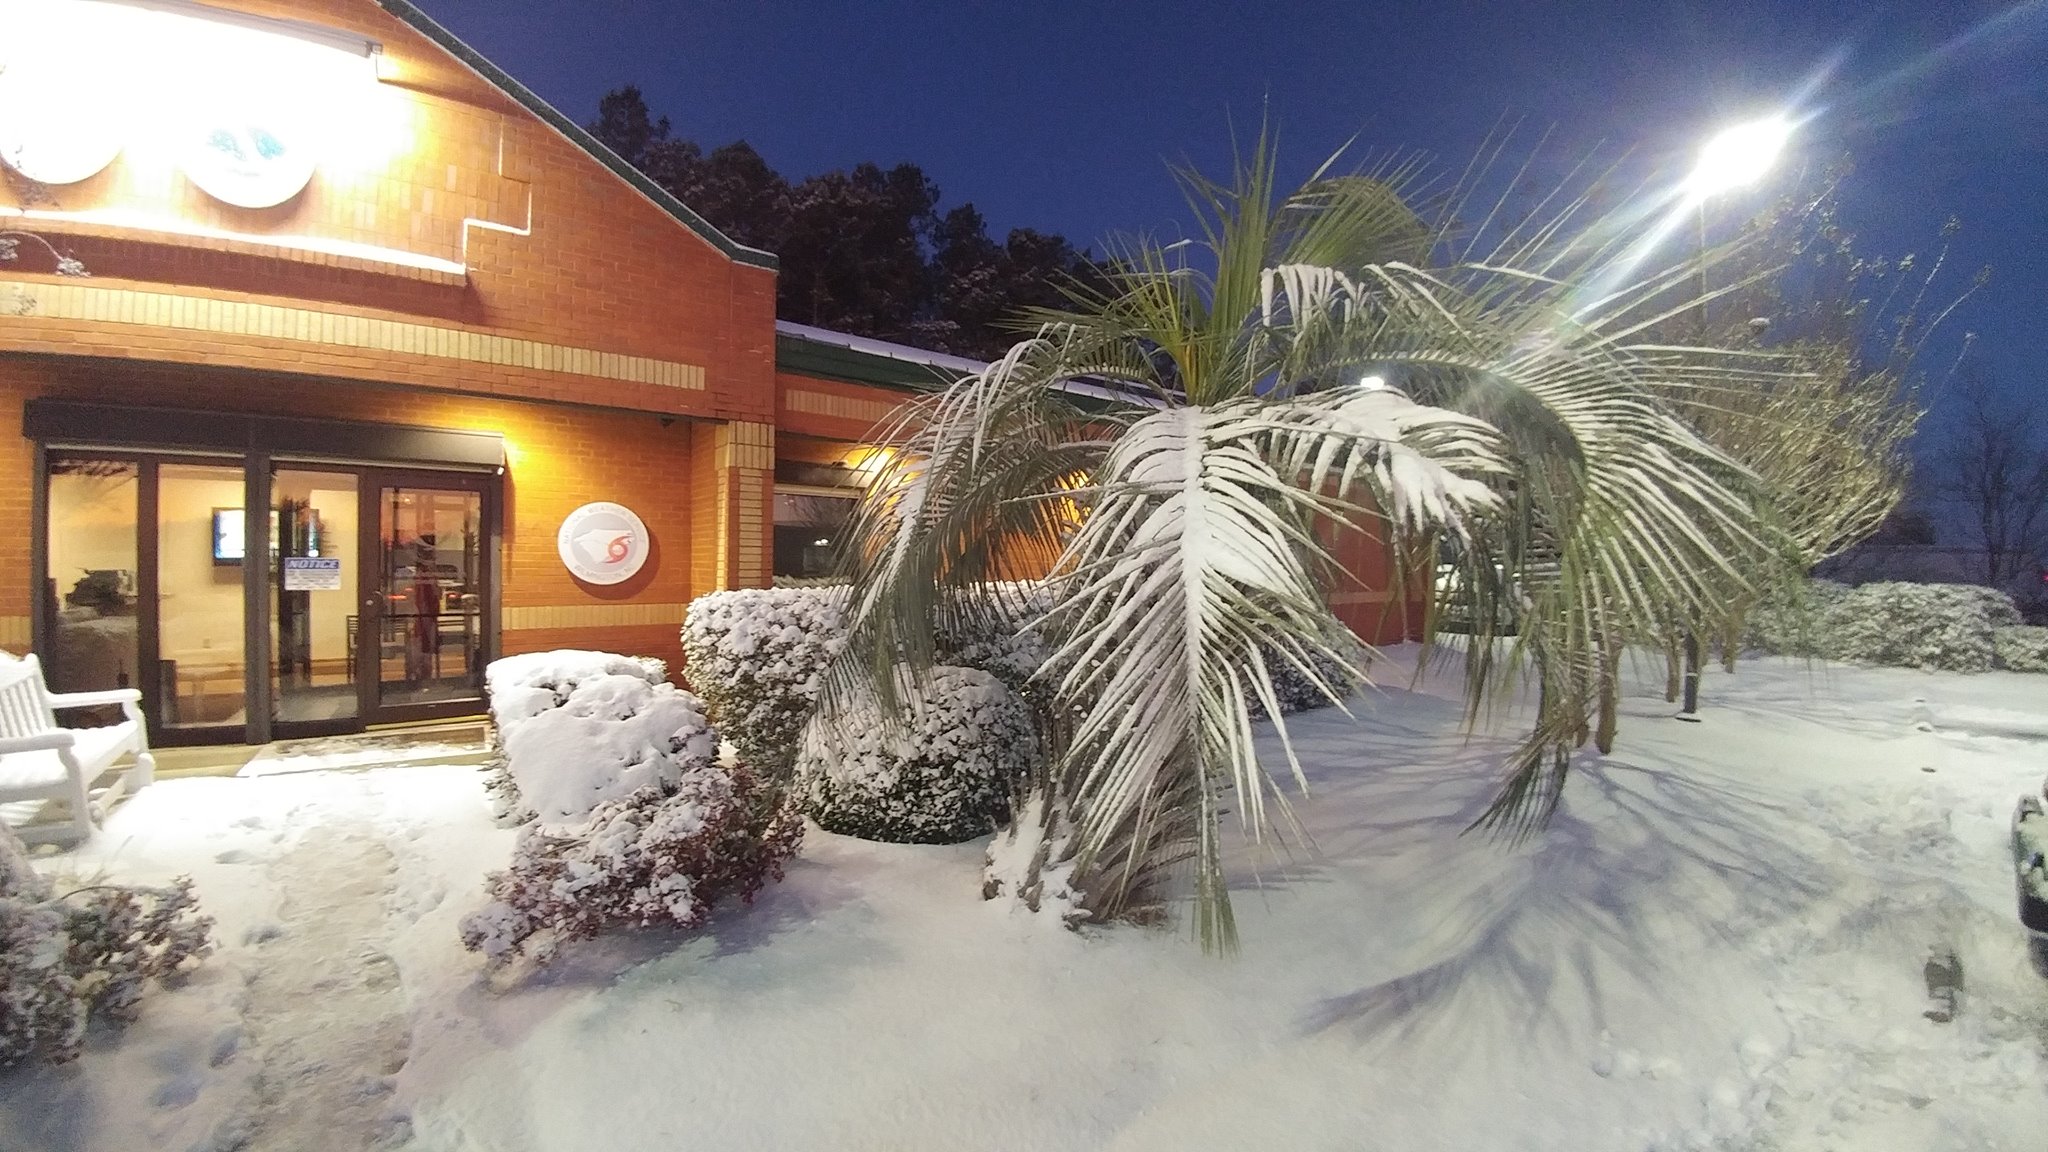
|
January 2018 snow at the NWS office in Wilmington |
Snow is always an unusual occurrence here in the eastern Carolinas. While dozens of storm systems bring rain to the Carolinas each winter, few occur while enough cold air is in place to change precipitation over to snow. The warm Atlantic Ocean further complicates matters near the coast as any onshore wind will bring in air with well above freezing temperatures.
On average, measurable snow (0.1 inches or more) falls less than once every other year in Myrtle Beach. Wilmington and Florence see measurable snow on average three out of every four winters, however significant snowfall (greater than 3 inches) is more rare, occurring on average once every four or five winters.
During the last five years with similar La Niña conditions to what we expect this winter, measurable snow fell in three of those years in Wilmington and Florence, but only once in North Myrtle Beach. Despite the relatively small number of events, considerable snow did fall in a couple of those years including 3.8 inches in Wilmington (January 3-4, 2018) and back-to-back three inch snows in Florence in January 2022.
| Wilmington | Florence | N. Myrtle Beach | |
| NORMAL WINTER SNOWFALL | 0.9" | 1.2" | 0.4" |
| Winter 2008-2009 observed (and anomaly) | 0.1" (-0.8") | 2.5" (+1.3") | 0.0" (-0.4") |
| Winter 2011-2012 observed (and anomaly) | trace (-0.9") | 0.0" (-1.2") | 0.0" (-0.4") |
| Winter 2017-2018 observed (and anomaly) | 3.8" (+2.9") | 2.5" (+1.3") | 0.0" (-0.4") |
| Winter 2020-2021 observed (and anomaly) | 0.0" (-0.9") | 0.0" (-1.2") | 0.0" (-0.4") |
| Winter 2021-2022 observed (and anomaly) | 0.5" (-0.4") | 6.5" (+5.3") | 0.5" (+0.1") |
| COMPOSITE OF THESE FIVE WINTERS | 1.1" (+0.2") | 2.3" (+1.1") | 0.1" (-0.3") |
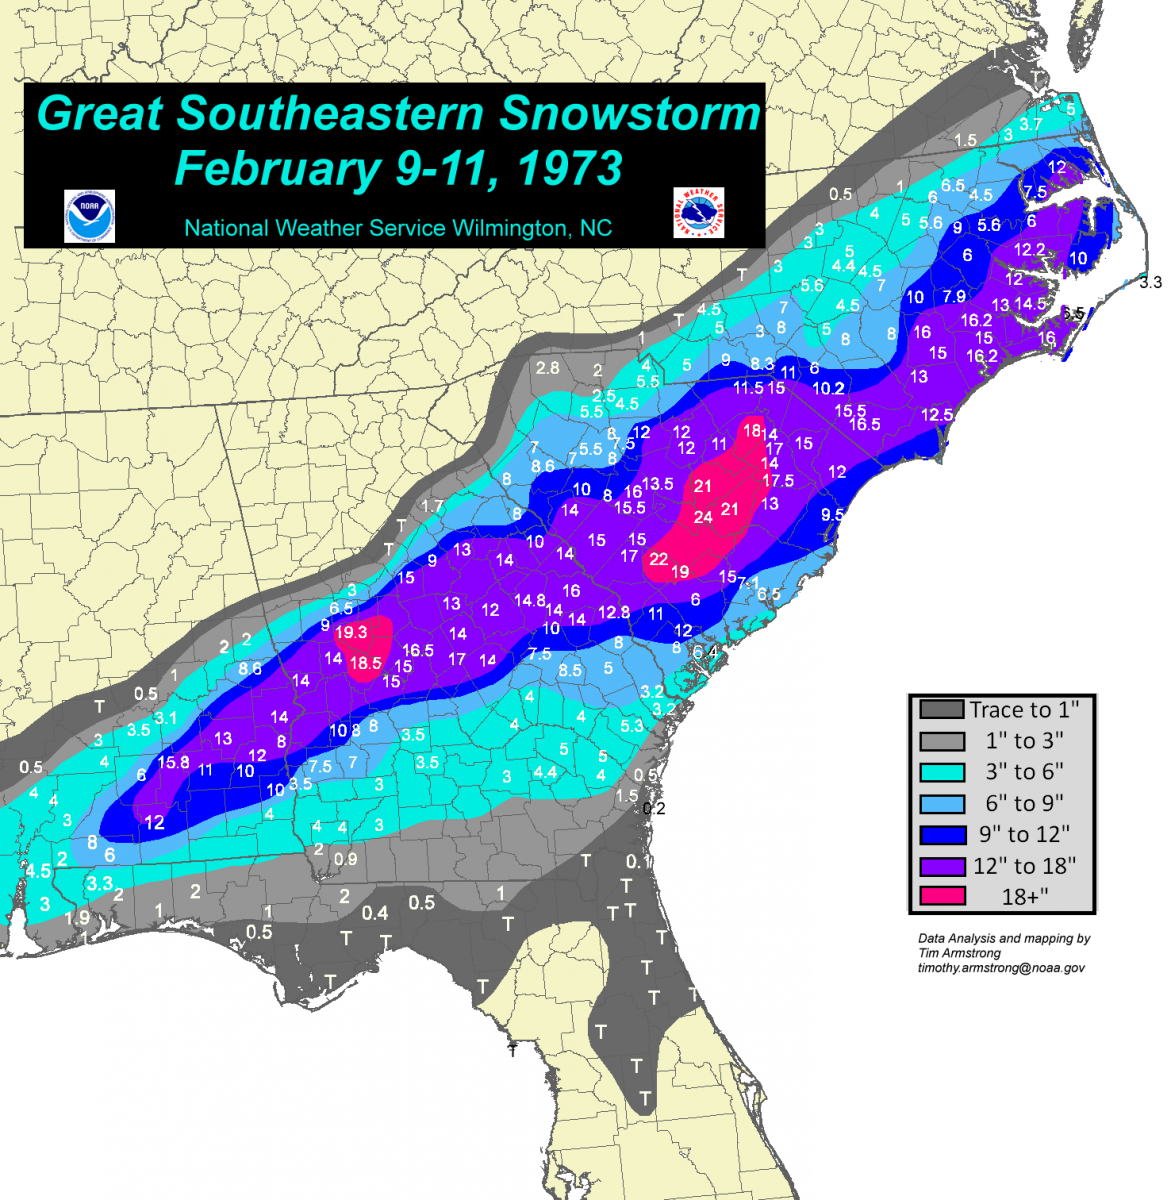
The ideal pattern for a snowstorm across the eastern Carolinas is for cold, arctic air to move into the region while low pressure moves across central Florida, then northeastward off the East Coast. The Great Southeast Snowstorm of February 1973 is an ideal example and brought record-breaking snowfall amounts over 20 inches to portions of eastern South Carolina.
|
Surface weather maps from February 9 through 11, 1973 (above) and snowfall accumulation map. (right) This storm brought over 20 inches of snow to portions of eastern South Carolina and is the single largest snowstorm on record for Florence and Myrtle Beach, SC. |
 |
One final factor to consider is climate change may be making snow less likely in general across the eastern Carolinas. Thirty-year average snowfall computed over the past 120 years in Wilmington ranged from 1.3 to 2.3 inches per year -- that is up until the most recent 30 year period (1991-2020) when this computed average fell to only 0.9 inches per year. Warming temperatures associated with climate change could be playing a role in this decrease in observed snowfall totals.
 |
River Flood and Coastal Flood Potential
The expectation for expanding drought this winter supports for a lower than average risk for river flooding. Current river levels across the eastern Carolinas are low, and it would take a significant period of rainfall for rivers to rise to flood stage.
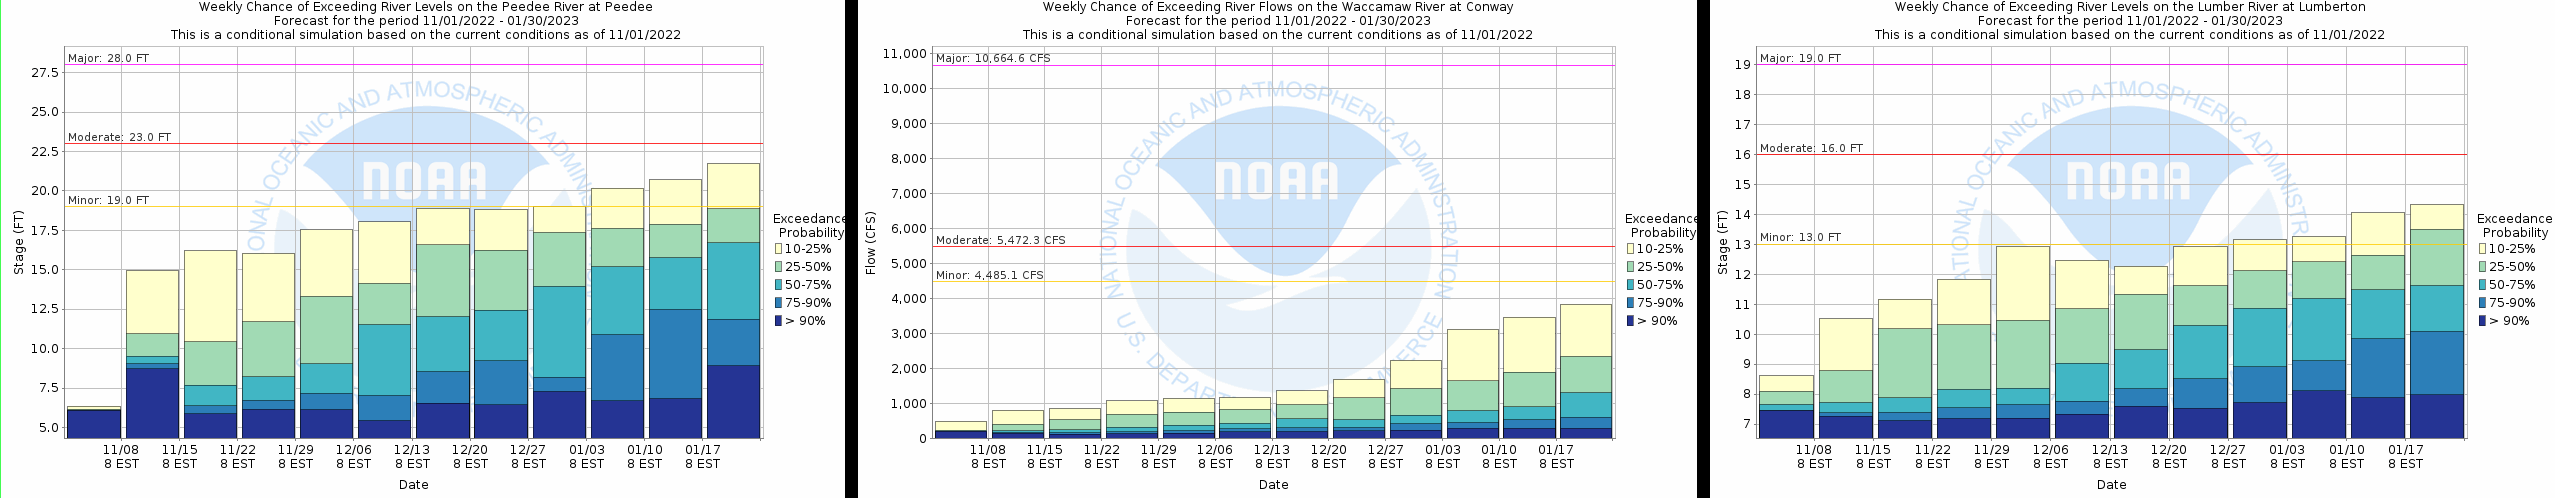
Probabilistic river stage forecasts provided by the NWS Southeast River Forecast Center show the weekly risk for flooding should remain less than 10 percent through December, and less than 25 percent until the end of January.
|
NWS Southeast River Forecast Center probabilistic flood outlooks for the Pee Dee, Waccamaw, and Lumber Rivers |
If the risk for river flooding grows, current and forecast stages as well as any river flood warnings are available at https://water.weather.gov/ahps2/index.php?wfo=ilm
At the beaches, tidal ranges naturally become larger and smaller over the span of a month as the phase of the moon changes. During a Full Moon or New Moon high tides are at their largest; if a Nor'easter or a period of strong onshore winds develops during that time coastal flooding can easily occur.
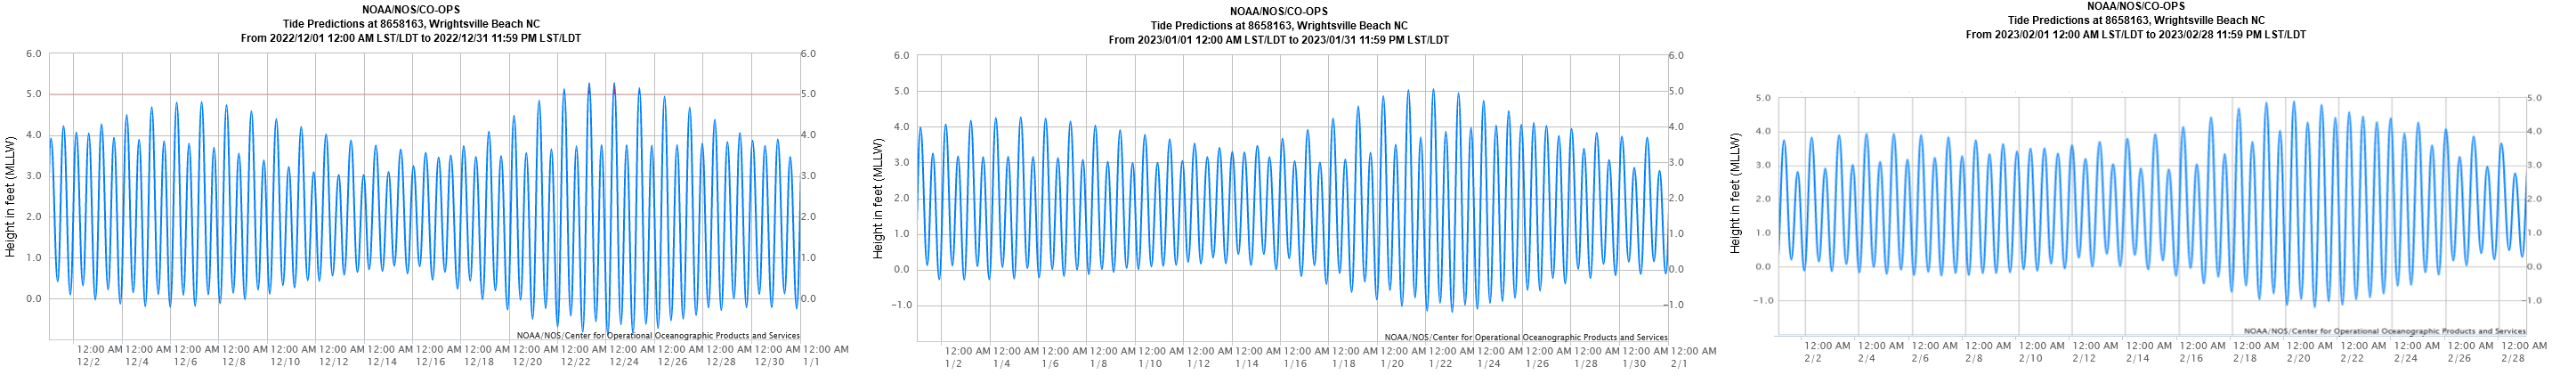
Astronomical tidal predictions for the winter season of 2022-2023 show only one period where tides will be particularly large: December 21 through 25 during the final New Moon of 2022. Maximum astronomical tides during January and February should remain more than one foot below minor coastal flooding thresholds.
|
December 2022 through February 2023 daily astronomical tidal ranges for Wrightsville Beach, NC |
The National Ocean Service produces the NOAA High Tide Bulletin with more information about the risk for coastal flooding over the coming season, available here: https://oceanservice.noaa.gov/news/high-tide-bulletin/winter-2022
Current water level forecasts that include wind and storm tide anomalies are available for Wrightsville Beach, Myrtle Beach, and for the Cape Fear River at downtown Wilmington.
Additional Links
Research and Page Author: Tim Armstrong
Last Updated: November 21, 2022


 Coastal Flood