The NWS Climate Prediction Center has issued its outlook for the 2021-2022 winter season and is calling for above normal temperatures across North and South Carolina. There is larger uncertainty surrounding precipitation this winter, but an increased likelihood of below normal rainfall is forecast.
|
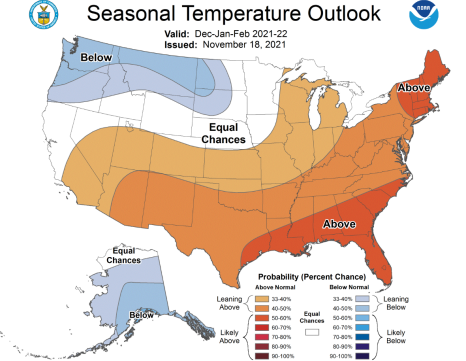
The CPC Winter 2021-2022 Temperature Outlook shows good potential for above-normal temperatures across the Carolinas this winter |
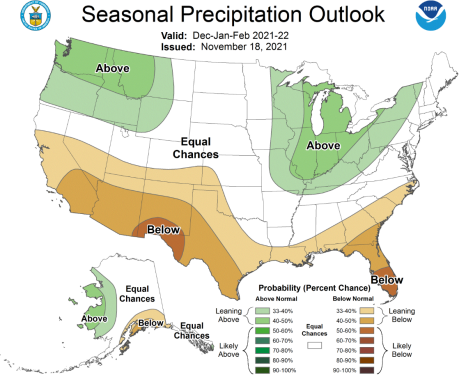
The CPC Winter 2021-2022 Precipitation Outlook shows slightly increased chances for below-normal rainfall across the Carolinas this winter |
La Niña
The major climate factor that will affect the Carolinas this winter is La Niña. La Niña, and its opposite phase El Niño, are two extremes in a natural cycle in Pacific water temperatures that usually takes two to five years to complete. During La Niña, water temperatures are cooler than normal across the tropical east Pacific Ocean. This sets into motion a series of changes in the strength of trade winds, the position of jet streams, and the track of storm systems. La Niña brings weather and climate impacts around the entire planet.
Learn more about El Niño and La Niña...
This winter's La Niña is a little different than most since we also had La Niña conditions last winter. That La Niña ended early last summer as tropical east Pacific water temperatures warmed to almost normal, however a new La Niña developed in October and is expected to last through this winter and into early spring of 2022. These "double dip" La Niñas have occurred four times over the past 50 years and are generally associated with above normal temperatures and below normal rainfall across eastern North and South Carolina.
|
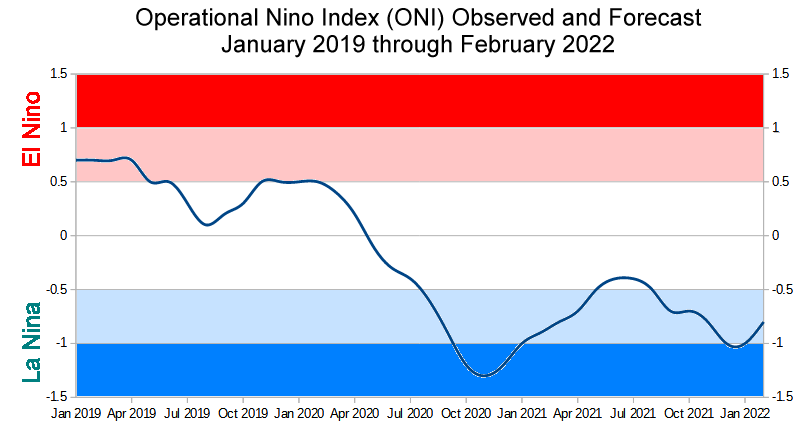
The Operational Nino Index (ONI) shows standardized water temperature anomalies in the tropical east Pacific Ocean and is used to track the strength and occurrence of El Niño (> 0.5) and La Niña (< -0.5). La Niña ended early this summer, but and a second La Niña has since developed and is expected to last through this winter. Raw ONI data is available here. |
Temperatures
The three months of climatological winter (December, January, and February) are the coldest of the year with highs across eastern North and South Carolina generally in the 50s with lows in the 30s. Relative to normal, "double dip" La Niña winters usually feature temperatures one to two degrees above normal for Wilmington, Florence, and Myrtle Beach.
Observed Winter Average Temperatures (and Anomalies) during "Double Dip" La Niñas
| Wilmington, NC | Florence, SC | N. Myrtle Beach, SC | |
| Normal Winter | 48.6° | 48.4° | 48.2° |
| 1974-1975 observed | 50.8° (+2.2°) | 52.5° (+4.1°) | 51.7° (+3.5°)* |
| 1984-1985 observed | 50.4° (+1.8°) | 46.3° (-2.1°) | 49.4° (+1.2°)* |
| 2008-2009 observed | 48.3° (-0.3°) | 47.8° (-0.6°) | 48.9° (+0.7°) |
| 2011-2012 observed | 51.2° (+2.6°) | 50.8° (+2.4°) | 51.2° (+3.0°) |
| Double-Dip La Nina Averages | 50.2° (+1.6°) | 49.4° (+1.0°) | 50.3° (+2.1°) |
*1974-1975 and 1984-1985 data is from Brookgreen Gardens, SC as Myrtle Beach data was N/A
While this may seem like an insignificant difference from normal, above-normal winter temperatures can save homes and businesses money on heating bills. Heating degree days (HDD) are a statistical measure of how far below 65 degrees each day's average temperature is. By summing up heating degree days over a season, it's possible to predict energy usage as a function of seasonal temperature. Here in the eastern Carolinas, each one degree increase in winter average temperature equates to approximately six percent less energy needed to maintain a home at a comfortable temperature.
| Observed Winter Average Temperature Anomaly | +1° | +2° | +3° | +4° | +5° |
| Heating Energy Savings relative to a Normal Winter | 6% | 12% | 18% | 24% | 30% |
It's possible we'll see temperatures this winter run 1 to 2 degrees above normal, implying a possible 6 to 12 percent savings on energy bills.
|
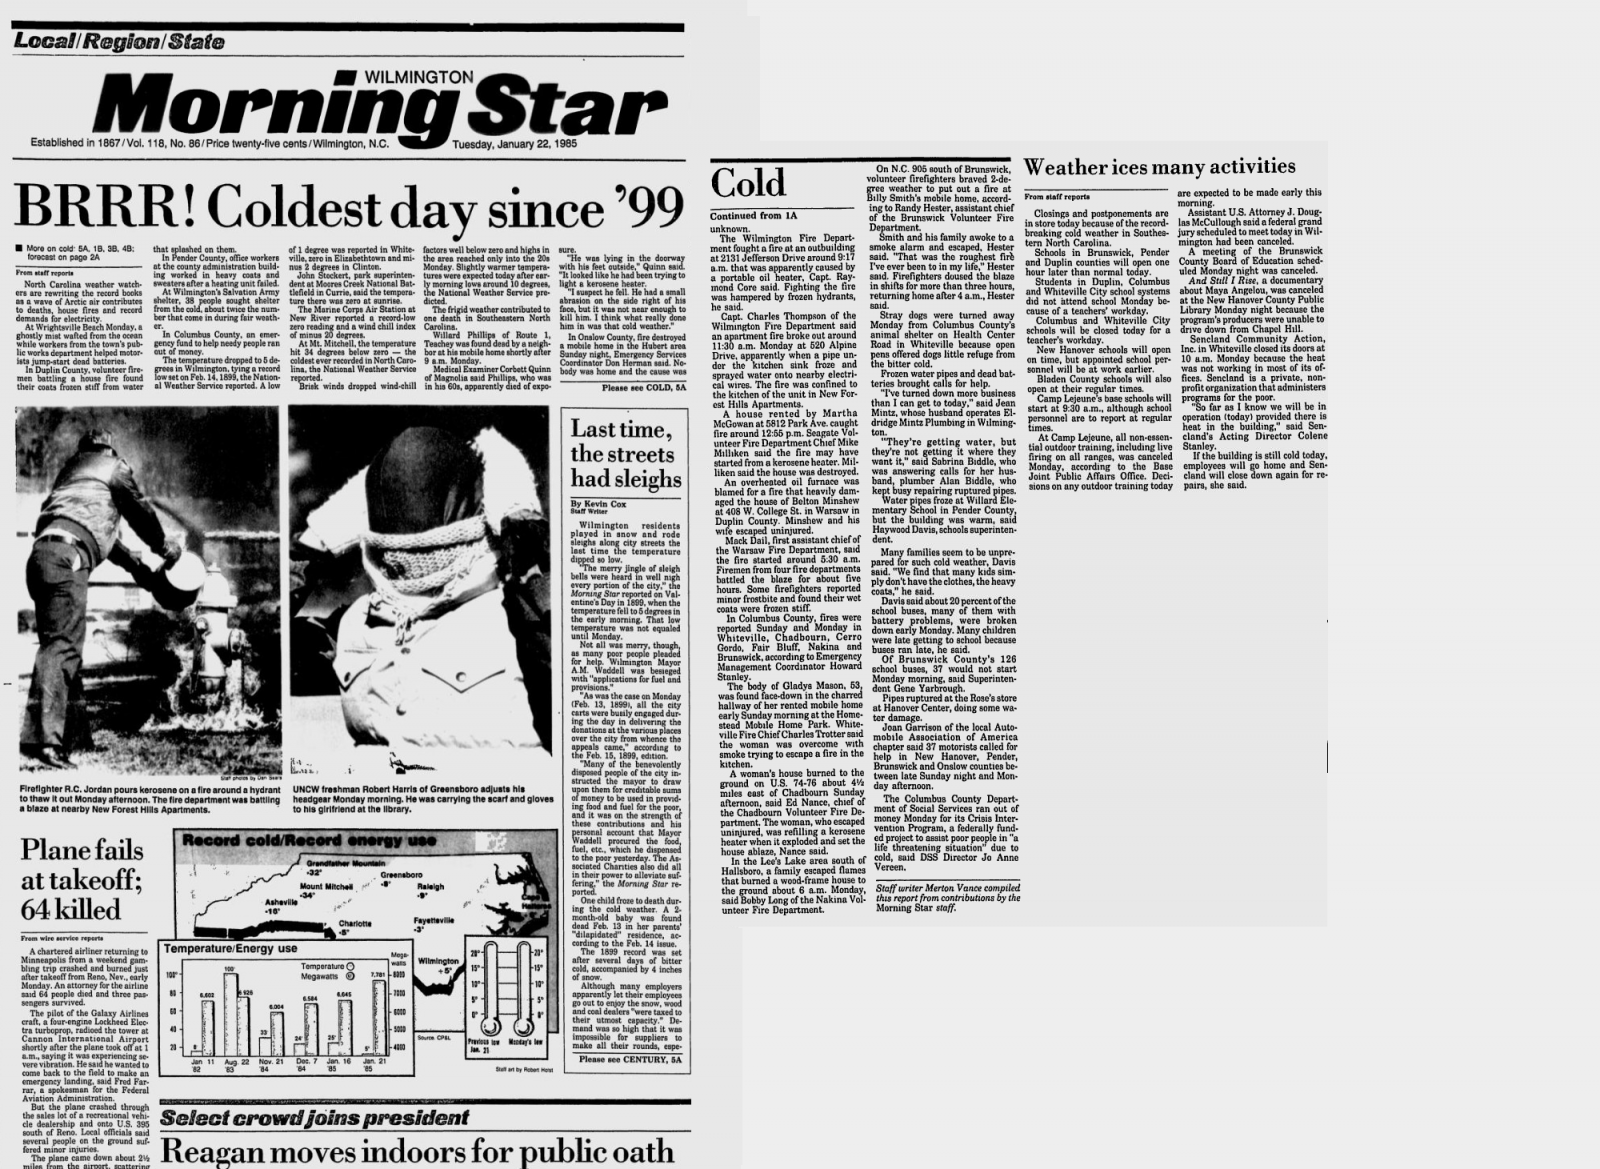
Front page of the Wilmington Morning Star on January 22, 1985 |
While temperatures averaged across the upcoming winter are expected to run above normal, this doesn't address day-to-day fluctuations in temperature or what the coldest temperature reached during the winter season will be. La Niña winters, including "double dip" La Niñas, can feature widely varying temperatures throughout the season. One of the most significant arctic outbreaks of the past 100 years occurred during the 1984-1985 La Niña, a "double dip" following a La Niña that occurred one year earlier in 1983-1984. This January 1985 arctic outbreak produced the all-time record low temperatures for many cities across North and South Carolina -- including zero degrees in Florence, SC.
It's also worth noting that despite that period of extreme cold, the winter of 1984-1985 was otherwise mild with above average temperatures recorded along the coast.
Observed Lowest Winter Temperatures (and Anomalies) during "Double Dip" La Ninas
| Wilmington, NC | Florence, SC | N. Myrtle Beach, SC | |
| Normal Winter | 18° | 16° | 19° |
| 1974-1975 observed | 26° (+8°) | 24° (+8°) | 19° (+0°)* |
| 1984-1985 observed | 5° (-13°) | 0° (-17°) | 4° (-15°)* |
| 2008-2009 observed | 15° (-3°) | 14° (-2°) | 17° (-2°) |
| 2011-2012 observed | 20° (+2°) | 16° (+0°) | 20° (+1°) |
| Double-Dip La Nina Averages | 17° (-1°) | 14° (-3°) | 15° (-4°) |
*1974-1975 and 1984-1985 data is from Brookgreen Gardens, SC as Myrtle Beach data was N/A
Rainfall, Drought, and Wildfire Risk
Moderate drought currently covers the majority of eastern North and South Carolina as climatological fall is ending. Abnormally dry conditions began to develop in September and October as the main portion of this year’s hurricane season failed to deliver a storm or even rain associated with tropical remnants. Rainfall totals since July 1 have been only 50 to 80 percent of normal -- as much as 5 to 10 inches below normal in spots.
|
Rainfall since July 1 has been below normal across large sections of North and South Carolina outside of the mountains |
La Niña typically shifts the main storm track northward and away from the Carolinas during the winter. This may lead to fewer storm systems and overall lighter rainfall totals. Drought conditions this winter are not expected to improve and may even expand despite seasonally low evaporation rates and water usage. An average of the last four "double dip" La Niña winters shows seasonal rainfall totals 1 to 3 inches below normal for local cities.
Observed Winter Precipitation (and Anomalies) during "Double Dip" La Niñas
| Wilmington, NC | Florence, SC | N. Myrtle Beach, SC | |
| Normal Winter | 10.97" | 9.55" | 9.29" |
| 1974-1975 | 13.87" (+2.90") | 15.81" (+6.26") | 13.89" (+4.60")* |
| 1984-1985 | 8.41" (-2.56") | 8.44" (-1.11") | 7.32" (-1.97")* |
| 2008-2009 | 6.64" (-4.33") | 4.82" (-4.73") | 6.31" (-2.98") |
| 2011-2012 | 4.52" (-6.45") | 5.39" (-4.16") | 3.71" (-5.58") |
| Double-Dip La Nina Averages | 8.36" (-2.61") | 8.62" (-0.93") | 7.81" (-1.48") |
*1974-1975 and 1984-1985 data is from Brookgreen Gardens, SC as Myrtle Beach data was N/A
The potential for river flooding may also be less than normal this winter. Probabilistic river stage outlooks from the NWS Southeast River Forecast Center show the chances of local rivers reaching flood stage remains less than 10 percent per week through the middle of January 2022.
|
NIFC Wildland Fire Potential Outlook for this winter |
The Wildland Fire Potential Outlook produced by scientists with the National Interagency Coordination Center (NIFC) shows an above average potential for wildfires this winter across the coastal plain of both North and South Carolina.
Their analysis of wildfire risk this winter is based on a number of factors including:
They also note that the combination of leaf drop, freeze events, and periods of dry, windy weather behind fronts can lead to increased wildfire activity -- including large and significant fires.
More information on wildland fire potential is available from the National Interagency Coordination Center.
Snowfall, or not...
|
North Ocean Blvd in Myrtle Beach, SC after a snow and ice storm on January 29, 2014. Photo credit: Matt Moore |
Snow is always a special occurrence across North and South Carolina outside of the mountains. While dozens of storm systems bring rain to the Carolinas each winter, few occur while enough cold air is in place to change precipitation over to snow. The warm Atlantic Ocean further complicates matters near the coast as any onshore wind will bring in air with well above freezing temperatures.
Over the past 30 years, the average winter has produced less than an inch of snow in Wilmington and Myrtle Beach, and only 1.2 inches in Florence. A “major” snowfall of six inches or greater occurs, on average, only once every 15 to 20 years -- however for most local cities the last major snowfall occurred even longer ago than that.
A composite of the last four “double dip” La Niña winters shows generally below normal snowfall has occurred across the eastern Carolinas. In Myrtle Beach measurable snow did not occur in any of these four winters, however Florence recorded measurable snow two of those four winters. Statistically, it's likely some snow will occur across at least interior portions of eastern North and South Carolina this winter, but large amounts of snow are unlikely.
Much like with hurricanes, snowstorms in the Carolinas are infrequent weather events where it can take just one storm to have an outsized impact on society. The Christmas Snowstorm of 1989 and the February storm in 1973 are examples of storms that paralyzed the coastal Carolinas with heavy snow that stayed on the ground for days.
Observed Winter Snowfall (and Anomalies) during "Double Dip" La Niñas
| Wilmington, NC | Florence, SC | N. Myrtle Beach, SC | |
| Normal Winter | 0.9" | 1.2" | 0.4" |
| 1974-1975 observed | trace (-0.9") | 0.0" (-1.2") | 0.0" (-0.4")* |
| 1984-1985 observed | trace (-0.9") | trace (-1.2") | trace (-0.4")* |
| 2008-2009 observed | 1.0" (+0.1") | 2.5" (+1.3") | 0.0" (-0.4") |
| 2011-2012 observed | trace (-0.9") | 3.0" (+1.8") | trace (-0.4") |
| Double-Dip La Nina Averages | 0.3" (-0.6") | 1.4" (+0.2") | trace (-0.4") |
*1974-1975 and 1984-1985 data is from Brookgreen Gardens, SC as Myrtle Beach data was N/A
Earlier this year NOAA recalculated average temperatures, rainfall, and snowfall based on observed weather over the period 1991 through 2020. In particular, this recalculation reduced “normal” values for snowfall significantly across our area. This reflects the lack of significant snow that has occurred over the past thirty years. In Wilmington, the new normal annual snowfall of 0.9 inches is the lowest thirty year average since this statistic was first calculated in the year 1900.
Tides and Coastal Flooding
Coastal flooding can develop during onshore winds or when there is a strong nearby storm system. Flooding more easily occurs when a storm coincides with high astronomical tides during New or Full Moons. This winter the highest astronomical tides will occur during a New Moon on December 2-7, with a second smaller peak January 2-3 with the next New Moon. Tidal ranges will be smaller during February which should help minimize the potential for coastal flooding.
|
December 2021 tides |
January 2022 tides |
February 2022 tides |
A non-tropical storm occurred November 6 through 8 off the Southeast coast during a New Moon and caused significant coastal flooding and erosion along the beaches of North and South Carolina. Forecasts of storm systems and potential coastal flooding usually become available several days in advance, providing adequate time to move vehicles to higher ground or to make preparations to minimize property damage.
|
Additional Reading
Research & Page Author: Tim Armstrong
Last Updated: November 25, 2021


 Coastal Flood