So far 2020 has been one of the warmest years in recorded history across the eastern Carolinas with temperatures running 2 to 3 degrees above normal. Outlooks from the NWS Climate Prediction Center indicate above-normal temperatures should continue through the upcoming winter season (December 2020 through February 2021) along with an increased likelihood for drier than normal weather.
 Temperature outlook for this coming winter. Slightly higher chances of above-normal temperatures are forecast across the Carolinas. Temperature outlook for this coming winter. Slightly higher chances of above-normal temperatures are forecast across the Carolinas. |
 Precipitation outlook for this coming winter. Higher chances of below-normal precipitation are forecast across the Carolinas. Precipitation outlook for this coming winter. Higher chances of below-normal precipitation are forecast across the Carolinas. |
There are many factors that influence our wintertime weather across North and South Carolina. The movement of highs, lows, cold fronts, and warm fronts control our day-to-day weather but become impossible to forecast with any accuracy more than eight or nine days in advance. Fortunately there are other factors that are correlated with longer term trends in temperature and precipitation during the winter. Let's explore these!
Atlantic Multidecadal Oscillation (AMO)
 Graph of North Atlantic Ocean temperature anomalies showing the pattern we call the Atlantic Multidecadal Oscillation (AMO). Graphic from USGS. |
North Atlantic Ocean water temperatures naturally warm and cool in a 60-to-70 year cycle called the Atlantic Multidecadal Oscillation, or AMO. For approximately 30 years water temperatures averaged across the North Atlantic Ocean are warm. This warm phase of the AMO is associated with fewer outbreaks of arctic cold along the U.S. East Coast.
This is followed by an approximately 30 year long cool period when North Atlantic Ocean water temperatures cool by approximately 0.5 degrees Celsius. This cool phase is associated with more frequent cold air outbreaks along the East Coast.
The warm phase of the AMO we're in began around 1996 and will continue this winter. This lowers (but doesn't eliminate) the chances of very cold temperatures.
La Nina
The tropical eastern Pacific Ocean displays a natural cycle in water temperatures which is part of the El Niño Southern Oscillation (ENSO). The warm phase of this cycle is called El Niño, and the cold phase is called La Niña. There is no definite pattern to how often El Niños or La Niñas occur, but a complete cycle usually lasts 2 to 5 years.
|
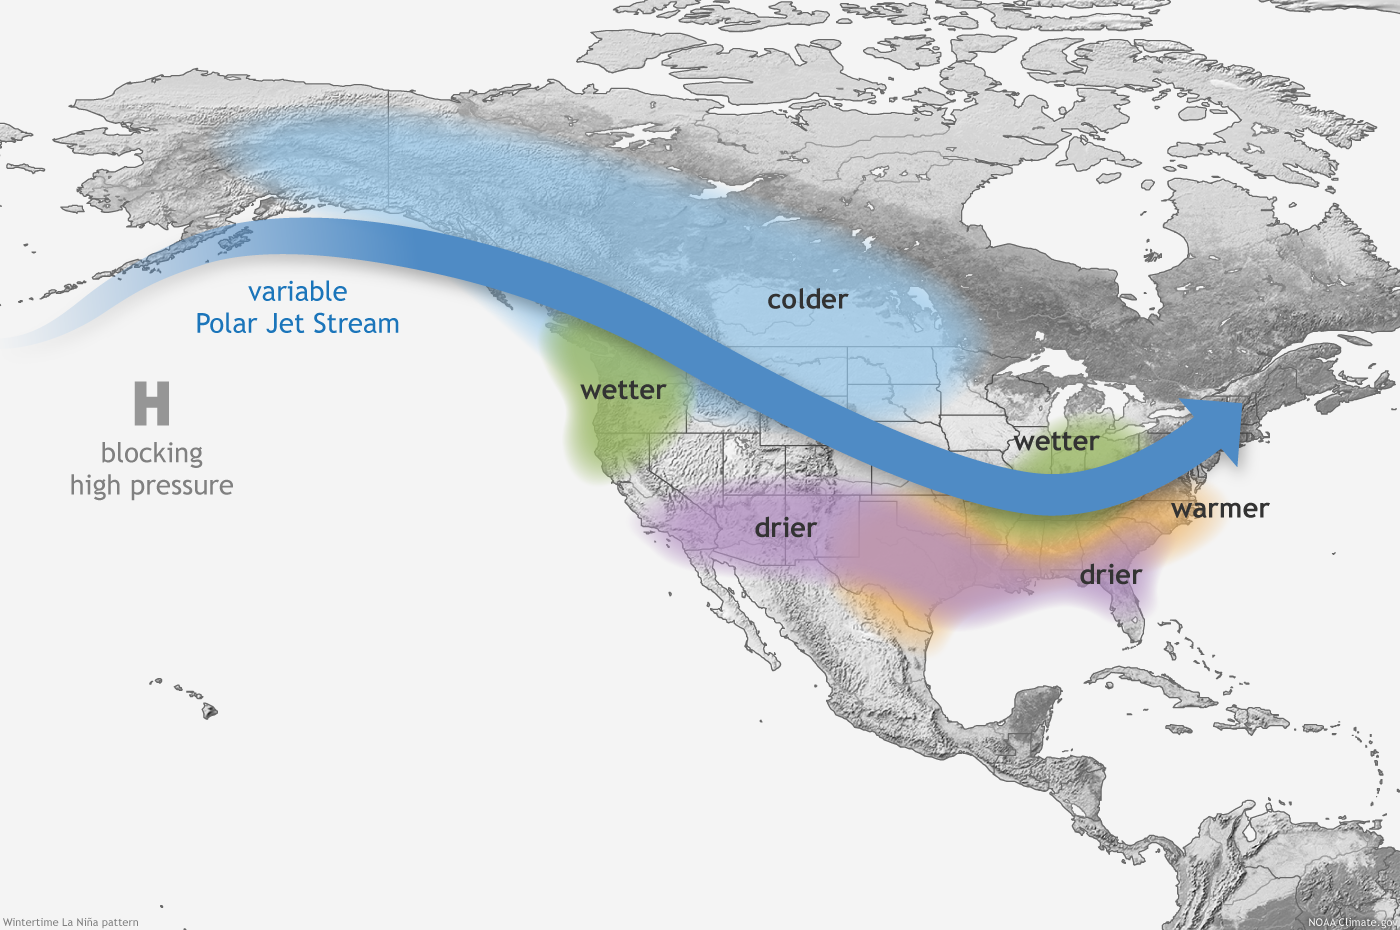
Typical winter jet stream with temperature & precipitation anomalies during La Niña |
During La Niña, cool water in the tropical Pacific causes fewer thunderstorms to form there, leading to a weaker subtropical jet stream that brings less moisture and less rainfall to the southern United States during the winter. The position of the polar jet stream also lifts farther north during La Niña. This tends to focus storminess across the Ohio Valley and Great Lakes, leaving the Carolinas high and dry with warmer than normal temperatures.
Below average water temperatures developed across the tropical east Pacific ocean during the summer of 2020, and La Niña officially began in September. Since then, water temperatures across the tropical Pacific have continued to cool and a moderate to strong La Niña is expected this winter.
Since 1996 when the AMO turned positive (warm), La Niña conditions have developed between July and November ten times. Of those, four events featured a moderate to strong La Niña during the winter months: 1998-1999, 2007-2008, 2010-2011, and 2017-2018. By studying how the weather and climate behaved during these four winter seasons when climate conditions were similar to now, we can attempt to predict how the upcoming winter of 2020-2021 will develop.
Learn more about El Niño and La Niña...
Average Seasonal Temperature
| Wilmington | Lumberton | Florence | North Myrtle Beach | |
| NORMAL WINTER AVERAGE TEMPERATURE | 47.8° | 45.4° | 46.8° | 47.5° |
| Winter 1998-1999 observed (and anomaly) | 51.9° (+4.1°) | 48.6° (+3.2°) | 52.2° (+5.4°) | 51.7° (+4.2°) |
| Winter 2007-2008 observed (and anomaly) | 50.5° (+2.7°) | 49.3° (+3.9°) | 49.6° (+2.8°) | 50.0° (+2.5°) |
| Winter 2010-2011 observed (and anomaly) | 42.4° (-5.4°) | 41.7° (-3.7°) | 43.1° (-3.7°) | 42.8° (-4.7°) |
| Winter 2017-2018 observed (and anomaly) | 48.9° (+1.1°) | 47.1° (+1.7°) | 48.8° (+2.0°) | 49.2° (+1.7°) |
| COMPOSITE OF THESE WINTERS | 48.4° (+0.6°) | 46.7° (+1.3°) | 48.4° (+1.6°) | 48.4° (+0.9°) |
 North Atlantic Oscillation positive (warm) and negative (cold) phases |
During the four previous winters when moderate to strong La Niña and positive AMO occurred (1998-1999, 2007-2008, 2010-2011, and 2017-2018) temperatures averaged slightly above normal for cities across southeastern North Carolina and northeastern South Carolina. Above normal temperatures occurred for three of the four winters -- but one winter, 2010-2011, stands out for its well-below normal temperatures. What happened to make the winter of 2010-2011 so different?
The answer is found in yet another naturally occurring weather pattern that strongly affects winter weather across the Carolinas: the North Atlantic Oscillation (NAO). When high pressure across the central Atlantic is strong and low pressure near Iceland is also strong, a powerful west to east jet stream between these systems keeps cold air bottled up in Canada. This positive phase of the NAO is strongly associated with above normal temperatures here in the Carolinas.
When high pressure across the central Atlantic and low pressure near Iceland both weaken, the jet stream slows down and often makes large north to south dips. This negative phase of the NAO can easily allow bitterly cold arctic air to spread south along the East Coast. During the winter of 2010-2011, the NAO was persistently negative and was the dominant factor in generating cold weather along the U.S. East Coast. Unfortunately, it isn't possible to forecast the phase of the NAO at time ranges longer than a couple of weeks -- and therefore NAO is the big wildcard for this winter's temperatures.
Learn more about the NAO from the NC Climate Office...
Based on a blend of climate models and continuing upward trends in observed seasonal temperatures, the NWS Climate Prediction Center predicts higher than normal chances of above normal temperatures this winter across the Carolinas.
Given this increased potential for mild weather this winter, less energy may be needed for indoor heating. Daily, monthly, and seasonal temperatures are often converted to heating degree days when energy usage is discussed. What are heating degree days and how are they calculated?
Solar energy generation potential could be higher than normal given the expected large number of dry, sunny days. Outdoor recreational activities could also benefit this winter with less cloudy, cold, or wet weather expected.
Coldest Winter Low Temperature
| Wilmington | Lumberton | Florence | North Myrtle Beach | |
| NORMAL COLDEST WINTER TEMPERATURE | 16° | 13° | 15° | 19° |
| Winter 1998-1999 observed (and anomaly) | 18° (+2°) | 18° (+5°) | 16° (+1°) | 18° (-1°) |
| Winter 2007-2008 observed (and anomaly) | 16° (+0°) | 16° (+3°) | 16° (+1°) | 16° (-3°) |
| Winter 2010-2011 observed (and anomaly) | 17° (+1°) | 13° (+0°) | 13° (-2°) | 17° (-2°) |
| Winter 2017-2018 observed (and anomaly) | 11° (-5°) | 6° (-7°) | 8° (-7°) | 16° (-3°) |
| COMPOSITE OF THESE WINTERS | 15.5° (-0.5°) | 13.3° (+0.3°) | 13.3° (-1.8°) | 16.8° (-2.3°) |
Even if average temperatures this winter are above normal, there will undoubtedly be occasional arctic outbreaks that bring below normal temperatures to the Carolinas for at least a few days at a time. On average, our local cities dip into the teens at least once during the winter, even at Myrtle Beach! When evaluating the previous four winter seasons with similar climate conditions to this winter, the coldest observed temperature was fairly close to normal with the notable exception of 2017-2018. During that winter, an exceptionally cold period developed in early January where some inland locations recorded temperatures in the single digits for the first time in over 30 years. It's interesting to note that this period of exceptional cold still occurred within a winter of otherwise above normal temperatures.
Some cool season field crops in the eastern Carolinas can be damaged or killed if temperatures fall too far. Common winter crops for local backyard gardens or commercial farms include kale, collard greens, parsley, and spinach. Your local master gardener or county agricultural extension office can provide specific recommendations for your area.
Winter Rainfall Totals
| Wilmington | Lumberton | Florence | North Myrtle Beach | |
| NORMAL WINTER PRECIPITATION | 11.00" | 8.76" | 9.16" | 10.57" |
| Winter 1998-1999 observed (and anomaly) | 10.76" (-0.24") | 14.44" (+5.68") | 13.45" (+4.29") | 10.62" (+0.05") |
| Winter 2007-2008 observed (and anomaly) | 10.22" (-0.78") | 7.82" (-0.94") | 11.44" (+2.28") | 10.39" (-0.18") |
| Winter 2010-2011 observed (and anomaly) | 10.79" (-0.21") | 6.01" (-2.75") | 6.43" (-2.73") | 8.25" (-2.32") |
| Winter 2017-2018 observed (and anomaly) | 12.51" (+1.51") | 7.09" (-1.67") | 7.70" (-1.46") | 9.14" (-1.43") |
| COMPOSITE OF THESE WINTERS | 11.07" (+0.07") | 8.84" (+0.08") | 9.76" (+0.60") | 9.60" (-0.97") |
La Niña is often associated with drier than normal weather during the winter for much of the southern United States. In some cases this reduction in rainfall can extend as far north as the Carolinas, due in part because less tropical Pacific moisture reaches our area during La Niña. While a check of the four previous winters with a similar climate setup shows no significant departures from normal rainfall, forecasts from the NWS Climate Prediction Center do show an enhanced potential for drier than normal conditions this winter.
Since soil moisture is currently above normal across the Southeast and evaporation is typically low during the winter, it's unlikely that below normal rainfall would have a significant impact on the area. In fact, some dry weather could be beneficial as it favors a lower flood risk along the Waccamaw, Cape Fear, Pee Dee, and Lumber Rivers. If below normal rainfall were to continue into the Spring of 2021, however, it could lead to issues with enhanced fire risk or drought developing by March or April.
Snowfall
| Wilmington | Lumberton | Florence | North Myrtle Beach | |
| NORMAL WINTER SNOWFALL | 1.7" | 1.8" | 1.9" | 1.0" |
| Winter 1998-1999 observed (and anomaly) | 0.0" (-1.7") | 0.0" (-1.8") | 0.0" (-1.9") | 0.0" (-1.0") |
| Winter 2007-2008 observed (and anomaly) | 0.0" (-1.7") | 0.0" (-1.8") | 0.0" (-1.9") | 0.0" (-1.0") |
| Winter 2010-2011 observed (and anomaly) | 4.0" (+2.3") | 7.1" (+5.3") | 6.0" (+4.1") | 0.5" (-0.5") |
| Winter 2017-2018 observed (and anomaly) | 3.8" (+2.0") | 2.0" (+0.2") | 3.0" (+1.1") | 0.0" (-1.0") |
| COMPOSITE OF THESE WINTERS | 2.0" (+0.3") | 2.3" (+0.5") | 2.3" (+0.4") | 0.1" (-0.9") |
Lumberton snowfall based on estimates from nearby spotter reports
Measurable snowfall is rare across eastern North and South Carolina, historically only occurring in about half of our winter seasons. Cold and dry arctic air moving south from Canada has to intercept a storm system moving northeastward across Florida to produce snow. Bringing moisture overhead without bringing in warm temperatures from the Atlantic Ocean is a very difficult balancing act.
During winters with similar climate conditions to what we expect this winter, measurable snowfall has occurred about half the time -- very close to long-term climate averages. It's not possible to say with any certainty whether measurable snow will fall this winter -- but La Niña coupled with a warm AMO doesn't rule it out.
 Surface weather maps from the Great Southeastern Snowstorm of February 1973 -- an example of the perfect storm track to bring significant snow to eastern North and South Carolina. |
.jpg) Photo from College Road during the January 28-29, 2014 ice and snow storm in Wilmington, NC. |
Additional Reading
Daily Climate Normals and Records for Wilmington, North Myrtle Beach, Florence, and Lumberton
Historical snowfall for Wilmington, Myrtle Beach, and Florence
NC Climate Office Winter Outlook 2020-2021
SC Climatology Office: Influence of the El Nino Southern Oscillation Cold and Warm Event Cycles on South Carolina's Seasonal Precipitation
Research & Page Author: Tim Armstrong
Last Updated: November 18, 2020


 Coastal Flood