National Weather Service United States Department of Commerce
Water Temperature Climatology, Wrightsville Beach, North Carolina

Select a new site using this map:  Wrightsville Beach, Oak Island, Myrtle Beach, Frying Pan Shoals Buoy

Water temperature climatology information
is available for each site above.  Click for info.


Latest Water Temp
83°

Wrightsville Beach is a 4.5 mile long barrier island located in New Hanover County, NC.  From June through early October water temperatures are practically tropical making this beach perfect for swimming and surfing.  The water cools significantly during the winter months due to cold offshore winds and longer nights.  The other beaches of Pender and New Hanover counties should have very similar water temperatures including Fort Fisher, Kure Beach, Carolina Beach, Masonboro Island, Figure Eight Island, Topsail Island, and Surf City.


Average Water Temperatures for Wrightsville Beach, NC

January

February

March

April

May

June

1-10

11-20

21-31

1-10

11-20

21-29

1-10

11-20

21-31

1-10

11-20

21-30

1-10

11-20

21-31

1-10

11-20

21-30

54

53

52

52

52

53

54

56

57

60

63

66

68

71

75

78

79

80


July

August

September

October

November

December

1-10

11-20

21-31

1-10

11-20

21-31

1-10

11-20

21-30

1-10

11-20

21-31

1-10

11-20

21-30

1-10

11-20

21-31

81

82

82

83

83

83

83

82

80

78

75

72

68

65

62

60

58

56

Average values are given for early (1st-10th), mid (11th-20th), and late (21st-31st) each month.


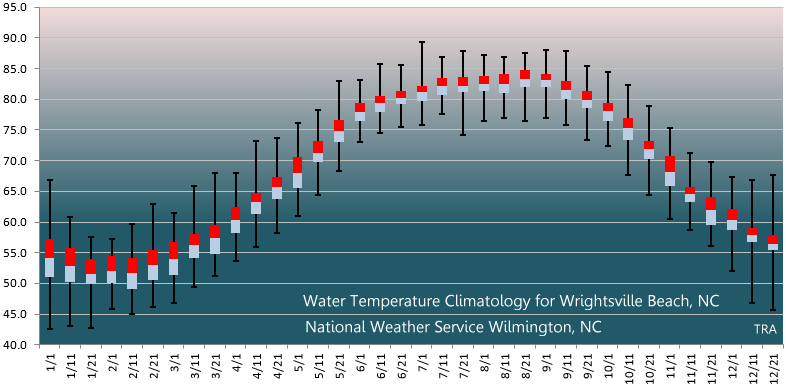
Detailed Water Temperature Statistics for Wrightsville Beach, NC

Box and Whisker statistical plot.  Colored boxes indicate the 25th through 75th percentiles, with the red/blue center of each box indicating the mean (average) value.  The black whiskers indicate the highest and lowest temperatures ever observed during each roughly 10 day time period throughout the year.

Box and whisker statistical plot of water temperatures for Wrightsville Beach, NC


Statistical table of water temperature data.  In addition to mean, highest and lowest values for each time period, various percentiles are displayed. 


Jan


Feb


Mar


Apr


May


Jun


1-10

11-20

21-31

1-10

11-20

21-29

1-10

11-20

21-31

1-10

11-20

21-30

1-10

11-20

21-31

1-10

11-20

21-30

Highest

66.9

60.8

57.6

57.2

59.7

63.0

61.5

65.8

68.0

68.0

73.2

73.8

76.1

78.3

82.9

83.1

85.8

85.6

Upper 0.1%

66.9

60.4

57.0

57.0

59.2

63.0

61.5

65.7

67.6

67.8

72.9

73.5

75.6

78.1

82.6

82.9

84.9

84.9

Upper 1%

65.8

59.5

56.1

56.8

57.9

61.7

60.4

64.0

66.4

67.3

70.7

72.5

74.1

76.5

81.0

82.2

83.8

83.8

Upper 5%

60.3

58.3

55.8

56.3

57.2

59.5

59.5

62.2

63.0

65.8

68.5

71.1

72.9

75.2

79.3

81.3

83.1

82.9

Upper 10%

59.2

57.4

55.2

55.8

56.3

57.6

58.8

60.8

62.1

64.4

66.9

70.3

72.1

74.5

78.1

80.6

82.4

82.6

Upper 25%

57.2

55.8

54.0

54.5

54.1

55.4

56.8

58.1

59.5

62.4

64.8

67.3

70.5

73.2

76.6

79.3

80.6

81.3

MEAN

54.1

52.8

51.6

52.0

51.7

53.0

54.0

56.2

57.4

60.3

63.3

65.7

68.1

71.2

74.8

77.9

79.5

80.2

Lower 25%

51.1

50.2

49.8

50.0

49.1

50.5

51.4

54.1

54.9

58.3

61.3

63.7

65.5

69.8

73.0

76.5

77.9

79.2

Lower 10%

46.8

46.0

48.0

47.8

47.5

49.5

49.5

52.2

53.6

56.7

59.9

62.2

63.9

67.1

71.4

75.4

77.0

77.9

Lower 5%

45.5

44.4

45.0

47.1

46.8

48.2

48.9

51.1

53.1

55.8

59.0

61.2

63.0

66.0

70.0

74.8

76.6

77.2

Lower 1%

43.9

43.3

43.5

46.6

45.9

47.1

47.8

50.0

52.2

54.3

56.7

59.4

62.2

64.9

68.7

74.1

75.4

76.5

Lower 0.1%

42.8

43.0

43.0

46.2

45.5

46.6

46.9

49.6

51.6

53.8

55.9

58.5

61.5

64.6

68.4

73.0

74.7

75.6

Lowest

42.6

43.0

42.8

45.9

45.0

46.2

46.8

49.5

51.3

53.6

55.9

58.3

61.0

64.4

68.4

73.0

74.5

75.6


Jul


Aug


Sep


Oct


Nov


Dec


ANNUAL


1-10

11-20

21-31

1-10

11-20

21-31

1-10

11-20

21-30

1-10

11-20

21-31

1-10

11-20

21-30

1-10

11-20

21-31


Highest

89.4

86.9

87.8

87.3

86.9

87.6

88.0

87.8

85.5

84.4

82.4

79.0

75.4

71.2

69.8

67.3

66.9

67.6

89.4

Upper 0.1%

89.1

86.7

87.4

86.7

86.7

87.3

87.8

87.6

85.3

84.2

82.4

78.6

75.4

71.1

69.3

66.7

66.7

67.3

87.3

Upper 1%

88.0

86.0

86.0

86.2

86.2

86.7

87.3

86.5

83.8

83.7

81.7

78.3

74.5

70.3

67.8

66.0

66.6

66.9

85.6

Upper 5%

85.5

85.1

85.1

85.3

85.5

85.8

86.0

84.7

83.1

82.4

79.5

77.0

73.0

68.9

66.7

64.9

64.8

64.9

84.0

Upper 10%

83.7

84.6

84.6

84.9

85.1

85.5

85.1

84.0

82.6

81.7

78.3

75.2

72.0

68.0

65.3

64.0

63.1

59.0

82.9

Upper 25%

82.2

83.5

83.7

83.8

84.2

84.7

84.2

82.9

81.3

79.3

77.0

73.2

70.7

65.7

64.0

62.1

59.0

57.9

79.9

MEAN

81.1

82.1

82.3

82.5

82.5

83.3

83.1

81.6

79.9

78.0

75.2

71.9

68.2

64.6

62.0

60.3

57.9

56.5

68.4

Lower 25%

79.7

80.8

81.1

81.3

81.0

82.0

82.0

80.1

78.6

76.5

73.4

70.3

65.8

63.3

59.5

58.6

56.7

55.4

57.6

Lower 10%

78.6

79.7

79.5

80.1

79.2

80.6

80.8

78.4

77.2

75.2

72.5

68.4

64.0

62.2

58.1

57.0

55.4

52.0

52.9

Lower 5%

78.1

79.0

78.4

79.0

78.4

79.7

79.7

78.1

76.6

74.5

71.8

67.1

63.3

60.6

57.6

55.8

50.5

48.0

50.2

Lower 1%

77.0

77.9

75.0

77.4

77.5

78.1

78.4

76.8

75.4

73.0

69.3

66.0

62.2

59.2

56.8

54.0

48.0

46.4

46.6

Lower 0.1%

75.7

77.5

74.1

76.5

77.2

76.6

77.5

75.7

73.9

72.7

68.0

64.8

61.5

58.8

56.5

52.7

47.1

46.0

43.7

Lowest

75.7

77.5

74.1

76.5

77.0

76.5

77.0

75.7

73.4

72.3

67.6

64.4

60.4

58.6

56.1

52.0

46.8

45.7

42.6


After quality control, a total of 1,045,991 individual water temperature observations were available to calculate the values used in this climatology.  Data was collected from the NOAA/NOS weather and tide station on Johnnie Mercer Pier over the period 2004 through 2018.  Current weather and tide data for this site is available here.


Page Author and Statistical Analysis:  Tim Armstrong
Page Created:  July 31, 2014
Last Updated:  February 28, 2019