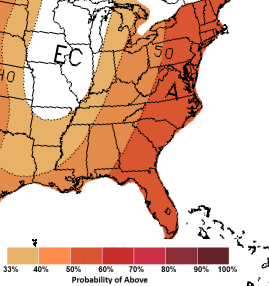
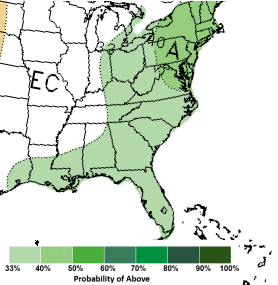
June, July, and August are the three months of climatological summer, the hottest part of the year across North and South Carolina. Heat and humidity are part of our summer climate and this year should be no exception. Climatologists with the NWS Climate Prediction Center are predicting good chances of above normal temperatures across North and South Carolina this summer, along with slightly elevated chances of above normal rainfall.
|
The NWS Climate Prediction Center outlook shows increased chances for above normal temperatures this summer across the East Coast including the Carolinas |
The NWS Climate Prediction Center outlook shows slightly increased potential for above normal rainfall this summer across the East Coast including the Carolinas |
La Nina developed last September but ended earlier this month, leaving us in a neutral ENSO (El Nino Southern Oscillation) pattern. During the summer there is no strong correlation between ENSO and the temperatures or rainfall we experience here in the Carolinas. However ENSO does have an impact on Atlantic hurricane activity; its cool phase, La Nina, has been linked to active hurricane seasons like in 2020.
Rainfall and Drought
|
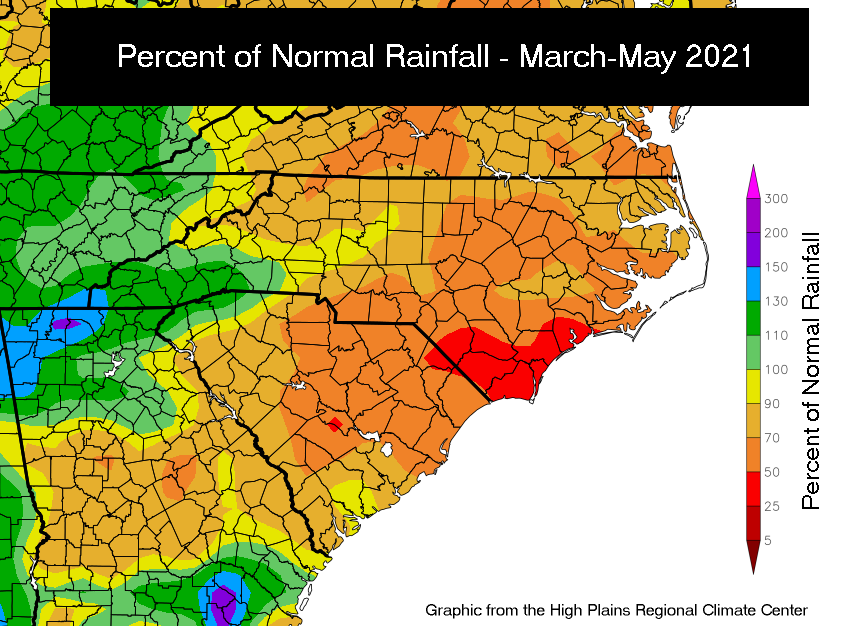
Below normal rainfall has been widespread across eastern North and South Carolina this spring |
The U.S. Drought Monitor classifies a portion of southeastern North Carolina and northeastern South Carolina in Moderate Drought (D1) |
Portions of eastern North and South Carolina will begin summer with ongoing moderate drought as defined by the U.S. Drought Monitor. Although rainfall last winter was 2 to 6 inches above normal, the weather became consistently dry at the beginning of spring with rainfall deficits of 3 to 6 inches noted since March 1. This spring has had some of the lowest rainfall amounts on record at local long-term climate stations, eclipsing previously record dry seasons in 2007 and 1985.
Although the Climate Prediction Center outlook shows a slightly increased potential for above-normal rainfall this summer, there is considerable uncertainty associated with this outlook. Our rainfall totals likely will depend on how quickly tropical air arrives this summer to bring afternoon thunderstorms, and also on how the Atlantic hurricane season unfolds.
Normal Summer Rainfall Statistics
| Wilmington, NC | Avg. Rainfall | Avg. # of Days ≥ 0.01" | Avg. # of Days ≥ 1.00" | |||||
| June | 5.67" | 11.2 | 1.6 | |||||
| July | 6.86" | 13.2 | 2.2 | |||||
| August | 8.16" | 13.9 | 2.7 | |||||
| Florence, SC | Avg. Rainfall | Avg. # of Days ≥ 0.01" | Avg. # of Days ≥ 1.00" | |||||
| June | 4.61" | 10.2 | 1.2 | |||||
| July | 5.80" | 11.7 | 1.7 | |||||
| August | 4.86" | 10.9 | 1.7 | |||||
| N. Myrtle Beach, SC | Avg. Rainfall | Avg. # of Days ≥ 0.01" | Avg. # of Days ≥ 1.00" | |||||
| June | 4.07" | 10.4 | 1.1 | |||||
| July | 5.40" | 11.7 | 1.9 | |||||
| August | 6.25" | 11.7 | 2.2 | |||||
| Lumberton, NC | Avg. Rainfall | Avg. # of Days ≥ 0.01" | Avg. # of Days ≥ 1.00" | |||||
| June | 4.92" | 11.9 | 1.4 | |||||
| July | 4.61" | 11.8 | 1.2 | |||||
| August | 4.77" | 12.9 | 1.7 |
Even normal rainfall may not be enough to alleviate the drought. CPC's Seasonal Drought Outlook (shown below) calls for no significant relief from ongoing drought conditions through August due to above normal temperatures and seasonally high evapotranspiration. Additional information is available here: https://www.cpc.ncep.noaa.gov/products/expert_assessment/sdo_discussion.php
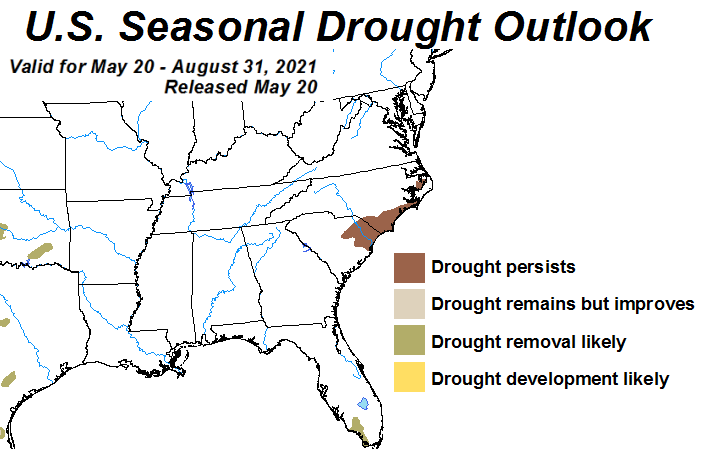 |
Water usage by lawns, trees, crops, and livestock reaches its peak during the summer months and even relatively short periods of drought can have negative impacts. Municipal and private water systems also can suffer supply issues during periods of drought. If drought conditions worsen through June and July, it is very likely voluntary or mandatory water use restrictions will expanded beyond those already in place to guarantee an adequate water supply remains available to homes and industry.
Drought resource and response information is available here:
Temperatures
Drought and above normal temperatures often go hand-in-hand. This is because during drought less solar energy is consumed evaporating moisture from dry soil, leaving more energy to heat the soil and the overlying air. Since our area will be starting the summer in a moderate drought, odds are immediately tilted in favor of hot weather. Climate Prediction Center outlooks for above normal temperatures are based mainly on observed upward trends related to ongoing climate change with additional contributions from the NMME (North American Multi-Model Ensemble.)
Normal Summer Temperature Statistics
| Wilmington, NC | Avg. High | Avg. Low | Avg. Temp | Avg. # of Days ≥ 95° | Avg. # of Days ≥ 100° | |||
| June | 87.0° | 69.3° | 78.2° | 2.3 | 0.2 | |||
| July | 90.0° | 73.0° | 81.5° | 4.9 | 0.5 | |||
| August | 88.3° | 71.7° | 80.0° | 2.1 | 0.1 | |||
| Florence, SC | Avg. High | Avg. Low | Avg. Temp | Avg. # of Days ≥ 95° | Avg. # of Days ≥ 100° | |||
| June | 89.2° | 69.0° | 79.1° | 4.8 | 1.4 | |||
| July | 92.0° | 72.4° | 82.2° | 8.8 | 0.9 | |||
| August | 90.3° | 71.4° | 80.9° | 5.0 | 0.9 | |||
| N. Myrtle Beach, SC | Avg. High | Avg. Low | Avg. Temp | Avg. # of Days ≥ 95° | Avg. # of Days ≥ 100° | |||
| June | 84.8° | 70.3° | 77.5° | 1.1 | 0.1 | |||
| July | 87.6° | 73.7° | 80.6° | 1.7 | 0.0 | |||
| August | 86.5° | 72.5° | 79.5° | 0.7 | 0.1 | |||
| Lumberton, NC | Avg. High | Avg. Low | Avg. Temp | Avg. # of Days ≥ 95° | Avg. # of Days ≥ 100° | |||
| June | 88.8° | 68.7° | 78.8° | 4.3 | 0.8 | |||
| July | 91.0° | 72.3° | 81.6° | 6.5 | 0.8 | |||
| August | 89.1° | 70.9° | 80.0° | 3.7 | 0.4 |
|
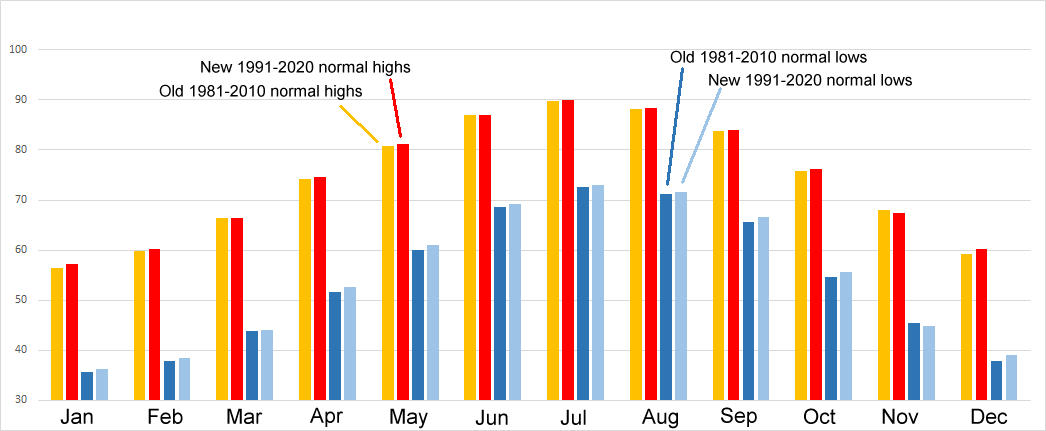
Normal temperatures have increased by around half a degree Fahrenheit over the past 10 years. |
Every ten years NOAA updates normal temperatures and rainfall based on the most recent 30 years of daily observations. Earlier this month NOAA began using the period 1991 through 2020 to calculate normals. Across the eastern Carolinas most long-term climate stations have experienced around a half degree Fahrenheit increase in average temperature since the last time climate normals were updated in 2010.
A detailed look at the changes in normals for local cities is available at https://www.weather.gov/ilm/1991-2020ClimateNormals
The increase in nighttime low temperature has been larger than the increase in daytime high temperature. In fact, one of the clearest signs of climate change in the Carolinas has been a significant increase in the frequency of warm low temperatures. Just last year Myrtle Beach recorded 77 consecutive nights between June 22 and September 6 with low temperatures of 70 degrees or warmer. This is the longest such streak on record. Wilmington also broke its consecutive warm night record with 65 nights of 70+ degree lows between July 4 through September 6. More on the causes of climate change...
|
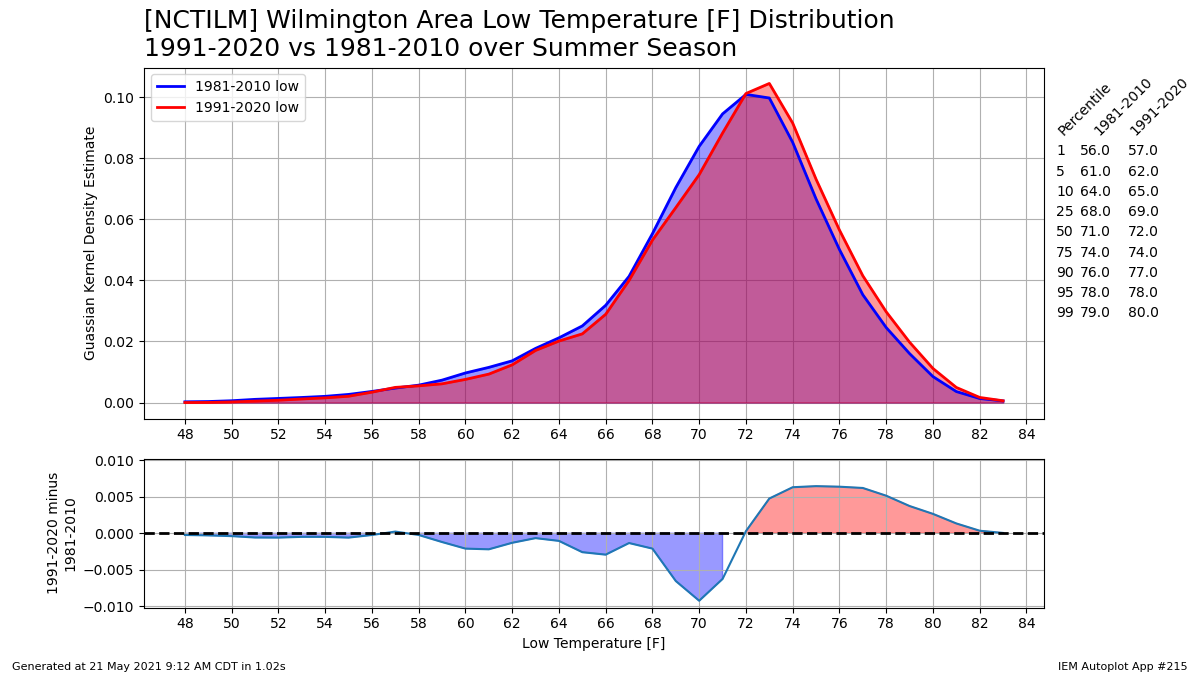
Warm summer nights are becoming much more common. A comparison of the distribution of summer (June-August) low temps in Wilmington, NC shows lows above 72 degrees are becoming more frequent while lows below 72 are decreasing in number. The probability curve has shifted right (warmer) by 1 degree Fahrenheit. Graphic: Iowa State University |
Hotter summer temperatures increase electrical demand for air conditioning and create higher power bills for homes and businesses. An increased potential of heat related illnesses such as heat exhaustion and heat stroke also exists, particularly when high humidity occurs. More on the impact of excessive heat on the human body...
Hurricane Season
The Atlantic Hurricane Season officially begins June 1 and lasts through November 30. This is when the majority of tropical storms and hurricanes occur in the Atlantic Ocean, Caribbean Sea, and Gulf of America. Routine Tropical Weather Outlooks are issued by the National Hurricane Center between May 15 and the end of the hurricane season. The official NOAA seasonal outlook issued on May 20 calls for a 60 percent chance of another above-normal season with more than the usual number of tropical storms and hurricanes developing.
NOAA predicts another active Atlantic hurricane season https://t.co/TDw60ws6c6... #nhc_atlantic #nws pic.twitter.com/TQaVXpyHoy
— NWS Wilmington NC (@NWSWilmingtonNC) May 20, 2021
With the development of tropical Storm Ana on May 22 this is now the seventh consecutive year when a storm developed before the official June 1 start of tropical season. Through 2020 there have been five consecutive years with above normal seasonal hurricane activity; this year could make six. The Carolinas have dealt with a number of destructive hurricanes over the past five years including Hurricane Isaias in 2020, Hurricane Dorian in 2019, Hurricane Florence in 2018, and Hurricane Matthew in 2016.
This spring NOAA updated the annual climatological normal number of Atlantic tropical storms and hurricanes to reflect the higher levels of activity experienced in recent years. The new normal values for the Atlantic include 14 tropical storms, 7 hurricanes, and 3 major hurricanes. Details on the changes are available here: https://www.noaa.gov/media-release/average-atlantic-hurricane-season-to-reflect-more-storms
Factors likely affecting this year’s hurricane season:
|
Sea surface temperature anomalies show above-normal ocean temps across the Bahamas eastward across the subtropical Atlantic |
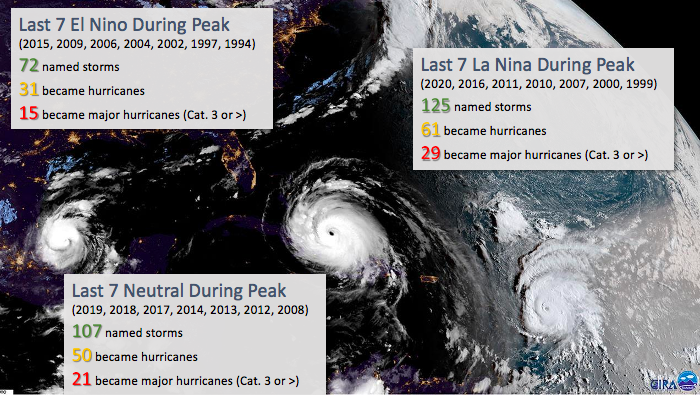
- Neutral ENSO or Redeveloping La Nina: Although the number of Atlantic tropical cyclones is typically highest during La Nina years and lowest during El Nino years, ENSO-neutral conditions like we currently have can still allow a significant number of storms to develop. La Nina could redevelop during the heart of the hurricane season in September, creating light wind shear across the Atlantic that favors more and stronger tropical cyclones.
- Strong West African Monsoon: increases the number and strength of tropical waves that move off the African coast and potentially become tropical cyclones
- Above normal sea surface temperatures: Warm water is the fuel that powers hurricanes. Above normal water temperatures like currently found across the Gulf o Mexico, the Bahamas, and much of the subtropical Atlantic Ocean can more easily develop or sustain tropical cyclones.
- Ongoing High Activity Era for Atlantic Hurricanes: While the existence of the Atlantic Multidecadal Oscillation (AMO) has recently been called into question, there is no disagreement that ocean and atmospheric conditions have allowed an unusually large number of Atlantic tropical cyclones to develop beginning in 1995 and continuing to the present. This overall pattern should continue into this year's hurricane season.
|
Graphic illustrating the number of Atlantic tropical cyclones which have developed during El Nino, neutral, and La Nina patterns since the mid 1990s. Tropical cyclones can occur under any regime, but are most frequent during La Nina. |
River Flooding
Due to ongoing drought conditions, the risk of river flooding is very low across southeastern North Carolina and northeastern South Carolina. Probabilistic long-range forecasts produced by the Southeast River Forecast Center show the probability of rivers reaching flood stage is no higher than 10 percent per week through the end of July.
|
Probabilistic river stage forecasts for the Waccamaw River at Conway, SC |
Probabilistic river stage forecasts for the Northeast Cape Fear River at Burgaw, NC |
Probabilistic river stage forecasts for the Lumber River at Lumberton, NC |
Tides/Coastal Flooding/Beach Hazards
|
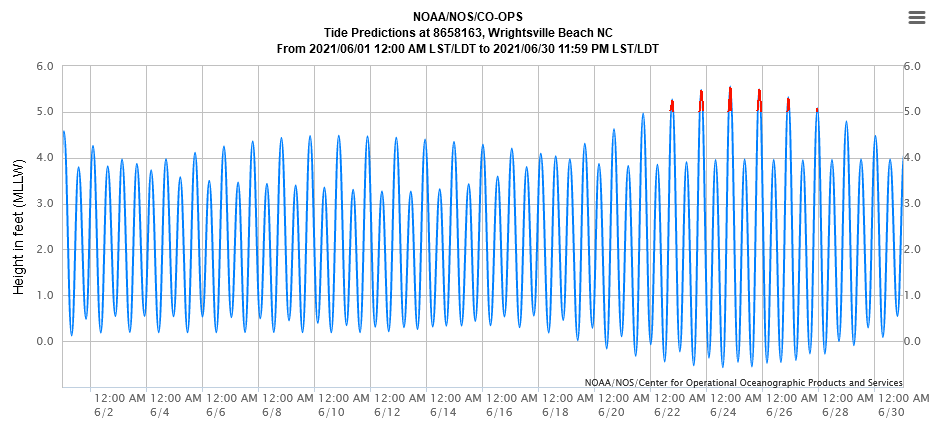
Predicted June tides. Tides within 1 foot of flooding thresholds are highlighted in red. |
|
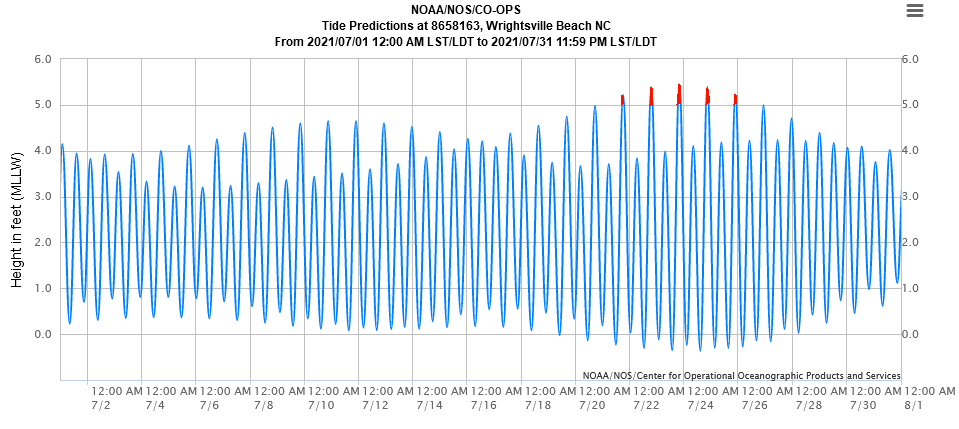
Predicted July tides. Tides within 1 foot of flooding thresholds are highlighted in red. |
|
Predicted August tides. Tides within 1 foot of flooding thresholds are highlighted in red. |
Tides naturally vary as a result of the moon's changing phase and gravitational influence on the oceans. The highest tidal ranges (difference in water level between high and low tide) occur during new and full moons. Tidal ranges are naturally smaller during first quarter and last quarter moons.
This summer tides will be highest during a 2-3 day period on either side of full moons on June 24, July 23, and August 22. If strong onshore winds or a tropical cyclone were to occur during these time periods, coastal flooding could easily develop.
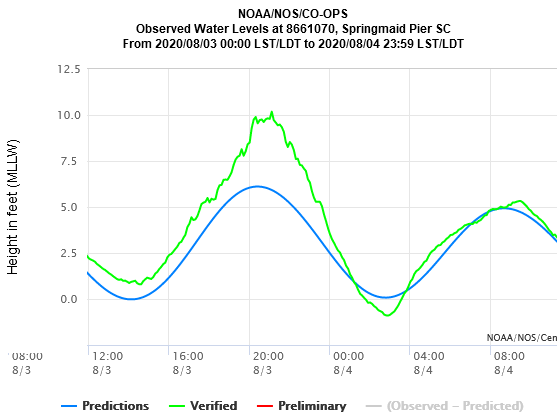
Last year's Hurricane Isaias made landfall at Ocean Isle Beach, NC shortly after high tide. The storm's four foot storm surge was made more damaging by the additional water present during high tide.
|
Storm surge from Hurricane Isaias at Myrtle Beach, SC on August 3, 2020. The blue line is the astronomical tide; the green line is what was actually measured by the tide gauge due to storm surge. |
Those enjoying the sun, sand, and surf are always cautioned to be aware of rip currents, narrow channels of fast-flowing water that can pull swimmers away from the beaches and out into deeper water. Rip currents are more common during certain combinations of swells, wind, and tides. We provide daily Rip Current forecasts on our website for area beaches at https://www.weather.gov/beach/ilm
Links of Interest
Page Author: Tim Armstrong
Created: May 25, 2021


.png)


 Coastal Flood
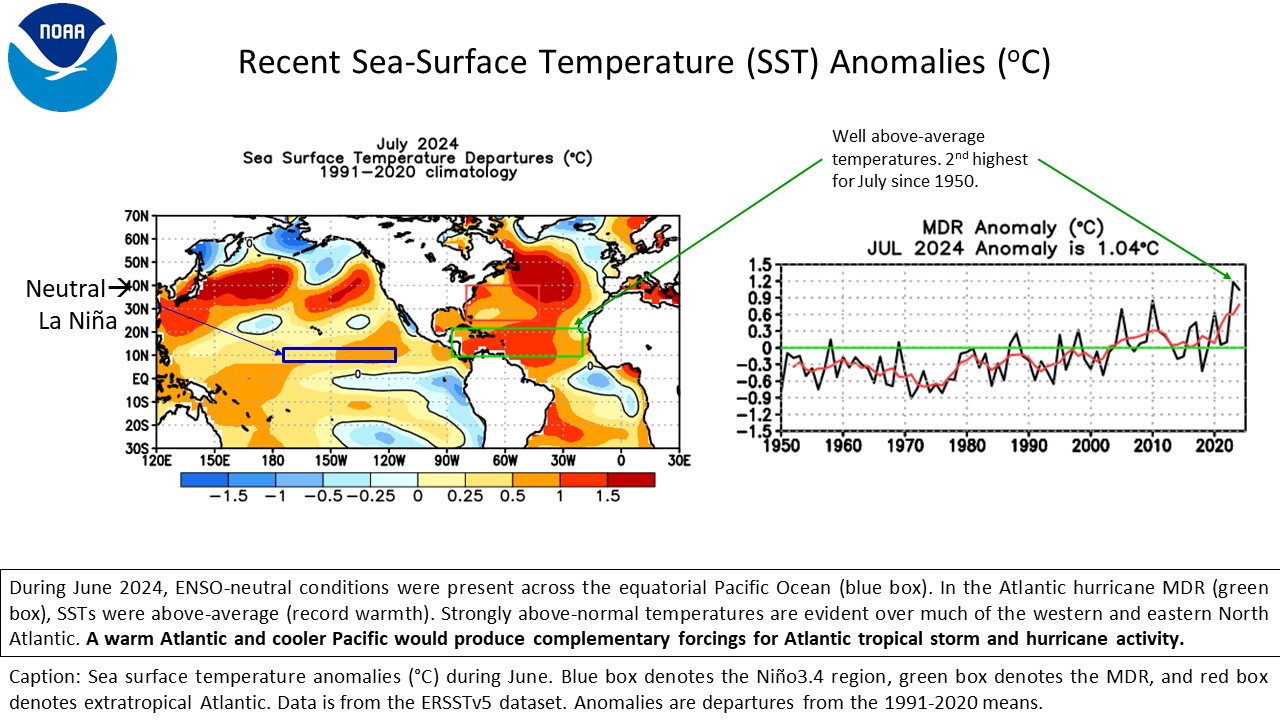