Official outlooks from the Climate Prediction Center show an increased likelihood of above-normal temperatures across the Carolinas during March, April, and May of 2020. The outlook for precipitation over the same period is less certain as there are no clear signals to favor above, near, or below normal rainfall across South Carolina. Most of North Carolina is expected to see a slightly enhanced potential for above-normal rainfall.
|
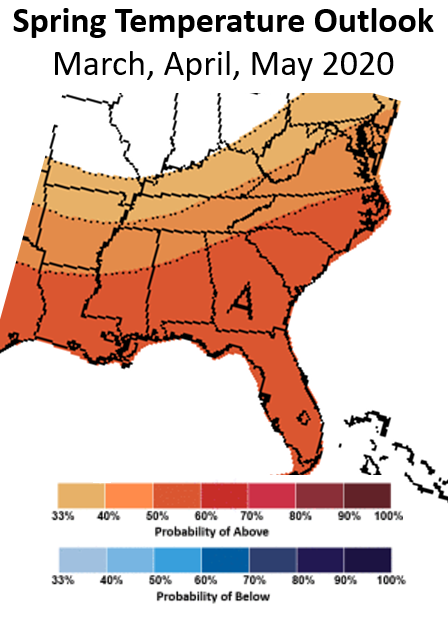
The spring 2020 temperature outlook from the Climate Prediction Center shows increased chances (50-60 percent) of above-normal temperatures this spring across North and South Carolina. |
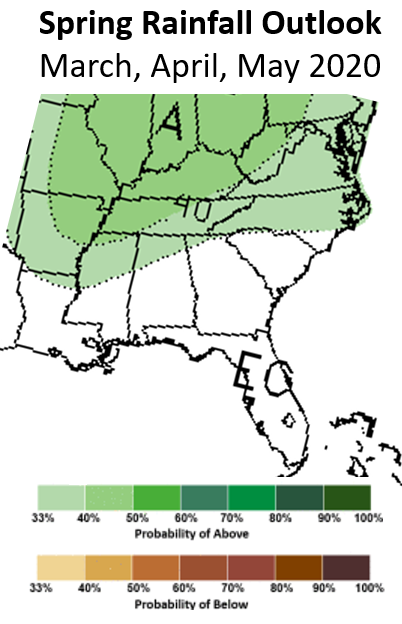
The spring 2020 rainfall outlook from the Climate Prediction Center shows slightly increased chances (33-40 percent) for above-normal precipitation across most of North Carolina. Equal chances for below, near, or above normal rainfall are forecast across South Carolina. |
Here are some of the factors expected to influence the weather across North and South Carolina this spring.
ENSO
|
Sea surface temperature anomalies within the Nino 3.4 monitoring region of the tropical Pacific ocean are only slightly positive. |
The El Nino Southern Oscillation (ENSO) is a naturally occurring cycle in tropical Pacific Ocean water temperatures that influences weather patterns around the world. During its warm phase, El Nino, the Carolinas typically experience cool, wet winter weather and a decrease in hurricane activity during the summer and fall. The cool phase of this cycle is called La Nina. When it occurs winters are typically warmer and drier across the Carolinas and there is an increased likelihood of hurricane strikes during the summer or fall.
Water temperatures across the tropical Pacific are currently above normal by less than 0.5 degrees Celsius. This is not warm enough to meet the threshold for even a weak El Nino. In situations like these, ENSO is said to be neutral with neither El Nino or La Nina occurring. Recent climate history across North and South Carolina since the year 2000 shows that during these warm-neutral ENSO periods (Nino 3.4 index between 0.0 and +0.5 C) spring temperatures have averaged 0.5 to 1.1 degrees F above normal, with the majority of years experiencing above-normal temperatures.
The following table shows spring (March, April, and May) observed temperatures and departures from normal during recent warm-neutral ENSO years. With the exception of 2005, note the frequent occurrence of above normal temperatures.
| Wilmington | Florence | Charleston | Columbia | Raleigh | Charlotte | Asheville | |
| NORMALS | 62.8 | 63.3 | 65.1 | 63.6 | 59.9 | 59.3 | 55.1 |
| 2002 | 64.2 (+1.4) | 64.8 (+1.5) | 67.1 (+2.0) | 65.2 (+1.6) | 60.9 (+1.0) | 60.6 (+1.3) | 56.3 (+1.2) |
| 2004 | 64.4 (+1.6) | 65.2 (+1.9) | 66.8 (+1.7) | 65.7 (+2.1) | 62.1 (+2.2) | 61.8 (+2.5) | 57.0 (+1.9) |
| 2005 | 60.1 (-2.7) | 60.5 (-2.8) | 63.0 (-2.1) | 61.3 (-2.3) | 57.3 (-2.6) | 57.4 (-1.9) | 53.5 (-1.6) |
| 2010 | 63.5 (+0.7) | 64.1 (+0.8) | 66.1 (+1.0) | 65.1 (+1.5) | 62.3 (+2.4) | 61.7 (+2.4) | 56.3 (+1.2) |
| 2014 | 63.7 (+0.9) | 63.0 (-0.3) | 66.4 (+1.3) | 64.0 (+0.4) | 58.7 (-1.2) | 59.4 (+0.1) | 55.0 (-0.1) |
| 2017 | 64.8 (+2.0) | 65.1 (+1.8) | 67.8 (+2.7) | 66.8 (+3.2) | 62.6 (+2.7) | 62.6 (+3.3) | 57.9 (+2.8) |
Rainfall during these same warm-neutral ENSO springs has not shown a consistent tendency to be above or below normal. In fact since the year 2000 there have been an almost equal number of wet and dry springs across the Carolinas during these years. The following table shows spring (March, April and May) rainfall recorded in recent warm-neutral ENSO years.
| Wilmington | Florence | Charleston | Columbia | Raleigh | Charlotte | Asheville | |
| NORMAL | 11.52" | 9.21" | 9.64" | 9.32" | 10.30" | 10.23" | 10.82" |
| 2002 | 8.57" (-2.95") | 9.49" (+0.28") | 8.44" (-1.20") | 14.54" (+5.22") | 6.44" (-3.86") | 9.09" (-1.14") | 9.51" (-1.31") |
| 2004 | 7.01" (-4.51") | 5.88" (-3.33") | 7.50" (-2.14") | 6.24" (-3.08") | 8.47" (-1.83") | 5.74" (-4.49") | 8.20" (-2.62") |
| 2005 | 12.93" (+1.41") | 8.59" (-0.62") | 11.21" (+1.57") | 9.72" (+0.40") | 8.74" (-1.56") | 10.69" (+0.46") | 7.84" (-2.98") |
| 2010 | 8.49" (-3.03") | 6.78" (-2.43") | 8.90" (-0.74") | 5.35" (-3.97") | 9.77" (-0.53") | 9.18" (-1.05") | 11.31" (+0.49") |
| 2014 | 13.78" (+2.26") | 11.64" (+2.43") | 12.40" (+2.76") | 12.64" (+3.32") | 14.31" (+4.01") | 15.87" (+5.64") | 11.16" (+0.34") |
| 2017 | 14.95" (+3.43") | 9.84" (+0.63") | 10.98" (+1.34") | 15.64" (+6.32") | 17.43" (+7.13") | 14.01" (+3.78") | 18.60" (+7.78") |
RECENT RAINFALL, SOIL MOISTURE, AND RIVER FLOODING
Over the past six months (180 days) rainfall has been above normal across central and western North and South Carolina. In contrast, parts of eastern North Carolina have experienced drier than normal conditions. These rainfall patterns have influenced soil moisture anomalies and drought classification.
|
Central and western North and South Carolina has seen above-normal rainfall over the 180 days ending on January 25, 2020. Parts of eastern North Carolina are several inches short on rainfall over the same period. |
Wetter than normal soil exists across western North and South Carolina, while drier than normal soil exists across parts of eastern North Carolina. |
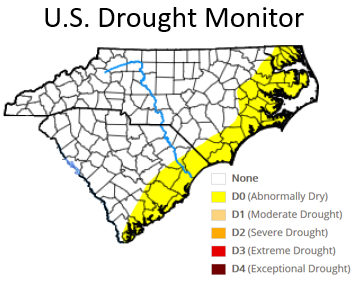
U.S. Drought Monitor classification in late January 2020. The yellow shading indicates "abnormally dry" conditions have developed across portions of eastern North & South Carolina. |
Recent minor river flooding along portions of the Lumber and Great Pee Dee Rivers may continue periodically through March and early April as shown by conditional simulations of river stage. These simulations take into account current river level and projections of future rainfall based on climate outlooks. Probabilities of these rivers exceeding minor flood stage remain 50 to 75 percent for most weeks through early April. The probability of reaching moderate flood stage peaks at 10 to 25 percent for both locations in early March. The latest updates to these flood risk outlooks are available at this link.
|
Probability of river stage exceedance on the Lumber River at Lumberton, NC through late April 2020 |
Probability of river stage exceedance on the Great Pee Dee River at Pee Dee, SC through late April 2020 |
As the weather warms during late April into May, more of our rainfall comes from local showers and thunderstorms rather than from frontal systems sweeping off the coast. Wet soil conditions like currently exist across the central and western Carolinas can provide more moisture to the atmosphere through increased evaporation, feeding the development of additional local showers and thunderstorms. Conversely, dry conditions like currently exist across parts of eastern North Carolina can result in fewer showers and thunderstorms developing. This effect can be summed up as "drought begets drought" as it is sometimes a lack of local moisture that suppresses the development of showers and storms.
CLIMATE CHANGE AND COASTAL FLOODING
Global observed temperatures have been on a warming trend for approximately the past 100 years. NOAA and NASA global temperature data now indicates 2016 and 2019 were the two warmest years in the modern instrumental record began that began in the late 1800s. In Wilmington continuous temperature records date back to the 1870s and confirm a warming trend is occurring locally, particularly over the past 40 years. Even in the absence of weather patterns that might suggest warm weather this spring, recent trends have increased the probability that above-normal temperatures will occur.
|
NASA global annual average air and ocean temperature data shows 2016 and 2019 are the two warmest years since modern records began in 1880. |
Local Wilmington annual average air temperature data shows 1990 and 2019 were the two warmest years on record. The first full year of continuous temperature data in Wilmington was 1875. |
Due in part to melting ice and warming oceans, high and low tides at most North and South Carolina beaches have run consistently 0.5 to 0.8 feet (6 to 10 inches) higher than baseline predictions for the past couple of years. If onshore winds develop during a new moon or full moon when tides are naturally higher, coastal flooding could easily develop. Times to watch for especially high tides this spring will include April 7-11 and May 5-10.
|
High tides May 5-10 pose a heightened risk for coastal flooding along the Carolina coast, especially if a storm system or strong onshore winds develop. |
FURTHER READING
NOAA Climate Prediction Center
Daily and Monthly records and normals for Wilmington, Florence, Myrtle Beach, and Lumberton
Research and Page Author: Tim Armstrong
Page Created: February 1, 2020
Last Updated: February 1, 2020


 Coastal Flood