|
2018 Final Rainfall Total 102.40" 
|
At 9:00 a.m. Saturday, December 15th, annual rainfall in Wilmington, NC officially reached 100 inches!
2018 is the wettest year in Wilmington's history. The all-time annual record that stood for over 140 years was broken on September 16th during Hurricane Florence, almost three and a half months before the end of the year. Every raindrop since then continued to extend the record which ended at 102.40 inches. A few climate statistics will show just how unimaginable 2018's rain has been.
Why was 2018 been so wet? A large part of it was Hurricane Florence's record-breaking 23.02" of rain at the Wilmington airport September 13th through 16th. This is the largest rainfall total from any single weather event in Wilmington's history, handily beating Hurricane Floyd's 19.06" rainfall total back in 1999. According to NOAA Precipitation Frequency Estimates, that much rain falling at Wilmington in just four days occurs, on average, once every 1,000 years.
A steady stream of non-tropical low pressure systems, cold and warm fronts, and daytime thunderstorms also brought well-above normal rainfall amounts in January, May, June, July, and November. Most of North Carolina has recorded well-above normal rainfall this year.
Our local observations show the last five years (2014 through 2018) have all had above-normal rainfall in Wilmington, and are collectively the wettest five year period since records began in 1871. While it's never possible to attribute a single storm or even a particular year's weather events to climate change, the Fourth National Climate Assessment states "Across most of the United States, the heaviest rainfall events have become heavier and more frequent. The amount of rain falling on the heaviest rain days has also increased over the past few decades."
|
2018 broke the record for the most rainfall in a year in Wilmington, NC by over 18 inches. Credit: Tim Armstrong/NWS |
Wilmington Rainfall Calendar for December 2018
| S | M | T | W | T | F | S |
|
1 Actual: 0.47" Year: 95.79" |
||||||
|
2 Actual: 0.03" Year: 95.82" |
3 Actual: 0.01" Year: 95.83" |
4 Actual: 0.00" Year: 95.83" |
5 Actual: 0.00" Year: 95.83" |
6 Actual: 0.00" Year: 95.83" |
7 Actual: 0.00" Year: 95.83" |
8 Actual: 0.62" Year: 96.45" |
|
9 Actual: 1.22" Year: 97.67" |
10 Actual: 0.08" Year: 97.75" |
11 Actual: 0.00" Year: 97.75" |
12 Actual: 0.00" Year: 97.75" |
13 Actual: 0.00" Year: 97.75" |
14 Actual: 1.97" Total: 99.72" |
15 Actual: 0.42" Total: 100.14" |
|
16 Actual: 0.00" Total: 100.14" |
17 Actual: 0.00" Total: 100.14" |
18 Actual: 0.00" Total: 100.14" |
19 Actual: 0.00" Total: 100.14" |
20 Actual: 1.09" Total: 101.23" |
21 Actual: 0.04" Total: 101.27" |
22 Actual: 0.00" Total: 101.27" |
|
23 Actual: 0.00" Total: 101.27" |
24 Actual: 0.00" Total: 101.27" |
25 Actual: 0.00" Total: 101.27" |
26 Actual: 0.00" Total: 101.27" |
27 Actual: 0.18" Total: 101.45" |
28 Actual: 0.81" Total: 102.26" |
29 Actual: trace Total: 102.26" |
|
30 Actual: 0.14" Total: 102.40" |
31 Actual: 0.00" Total: 102.40" |
Latest NWS Wilmington rainfall amount forecasts
Latest NWS Weather Prediction Center (WPC) Rainfall Forecasts
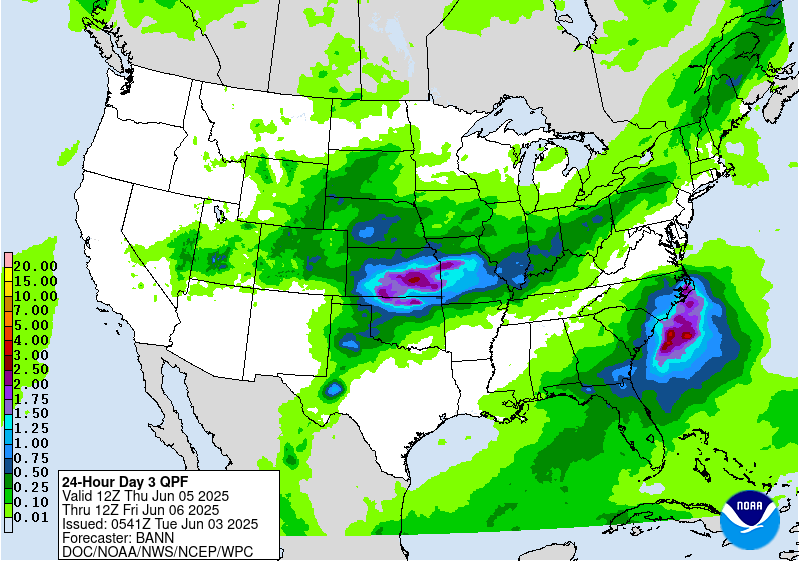
 Day 3 rainfall forecast Day 3 rainfall forecast |
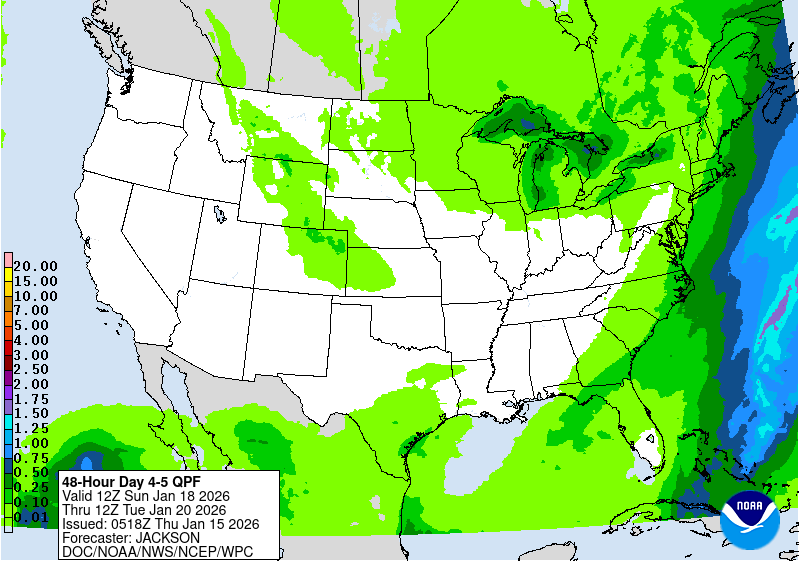
 Days 4-5 rainfall forecast Days 4-5 rainfall forecast |
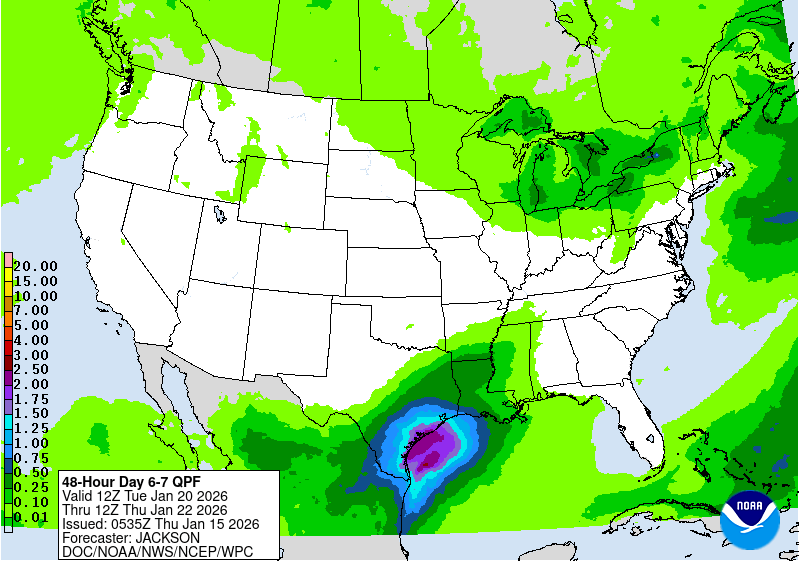
 Days 6-7 rainfall forecast Days 6-7 rainfall forecast |
Latest NWS Climate Prediction Center (CPC) Rainfall Outlooks
|
|
Green colors indicate higher chances for above-normal rainfall, while brown colors indicate higher chances for below-normal rainfall
Research and Page Author: Tim Armstrong
Page Created: December 3, 2018
Last Modified: January 1, 2019